Business services as a growth sector for Great Lakes cities?
As manufacturing activity shrinks and relocates, large cities of the Midwest look to another staple of their economic base, business and professional services. Large cities everywhere typically serve as centers of finance, communication, governance, and varied business services. In the Midwest, business service specializations in cities originally derived from goods production, as surrounding farms and factories looked to cities for financing, advertising, management expertise, product design, legal services, and engineering, as well as computer systems advice, more recently.
In the past few decades, agriculture and manufacturing activity have been shrinking in the Midwest, at least in terms of nominal personal income arising from manufacturing firms. In the overall U.S., for example, personal income derived from manufacturing activity has fallen from 32.9 percent to 15.5 percent from 1969 to 2004. This falloff is especially prominent in large Midwest cities, where manufacturing once thrived due to urban freight transportation advantages and the intense workforce needs of mass production.
Can advanced business services help fill the void in Midwest cities’ economies? There are several reasons to focus attention on these industries. First, there is already a pronounced urban location propensity for business services, so prospects for this sector in large cities are perhaps better than for others; also, in the overall U.S. economy, the business services sector has recently been a growth leader. Finally, many business services employ highly skilled occupations, and they tend to generate high levels of wages and income that may directly and indirectly buoy large city economies.
On the latter point, as formally defined by the North American Industry Classification System (NAICS), the “professional and technical services sector,” NAICS sector 54, tends to employ an above-average share of highly-educated (and highly paid) workers. As described by federal government statistical agencies (Census and BLS), the sector’s industries employ many executive and technical occupations, namely those found in research and development, legal services, management consulting, accounting, advertising, engineering, public relations, and product design.
In the analysis that follows, a focus on the NAICS 54 sector is advantageous because its services are almost exclusively sold to other businesses rather than to households, and many of these services can be sold to customers located far away. In thinking about regional economies, such tradable services may offer a wide scope for possible growth and development. Moreover, data covering employment in the sector are available for geographic regions as small as metropolitan areas.
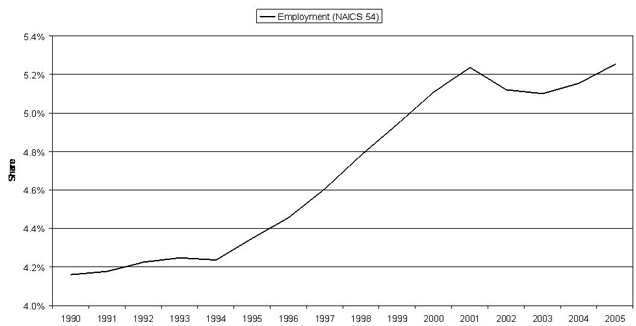
Rapid growth characterizes the business services sector. The chart below illustrates that as a share of total payroll employment, “professional and technical services” has expanded from 4.2% to 5.3% from 1990 to 2005. The sector’s average annual growth of 3.0% per year easily exceeds that of total payroll job growth (1.3%), adding 2.5 million jobs to the U.S. economy since 1990.
1. Professional, technical, and scientific services in the U.S. (share of total employment)
Business services’ urban orientation can be conveniently described by an index of employment. The concentration index is the ratio of two shares. For the ratio, the numerator is the business services sector’s share of total jobs in a particular region. The denominator is the business services sector’s share of total jobs in the overall U.S. And so, for example, if the sectoral share of total jobs in a particular region is equal to the sectoral share of jobs in the U.S., the index will take on a value of one. To the extent that a region’s share of jobs found in business services exceeds the nation’s, the index takes on a value greater than one, and so on.
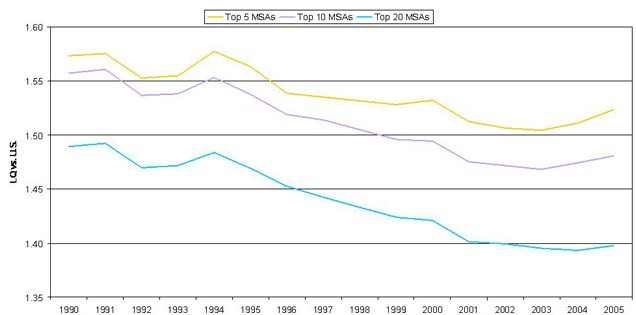
Such a concentration index is constructed below for the most populous metropolitan areas in the U.S. The top five metropolitan statistical areas (MSAs)—New York, Los Angeles, Chicago, Washington, D.C., and San Francisco—are, taken as group, more than 50 percent more concentrated in business services jobs than the overall U.S. Moreover, an hierarchy of this concentration by city size is evident as we expand the index to include less populous metropolitan areas. Though still well above parity with the nation, the indexes of the top ten and top 20 most populous metropolitan areas lie below the concentration of the top five most populous metropolitan areas.
2. NAICS 54 — employment concentration index
Source: BLS/Haver Analytics
Time trends in business services employment also tell us some important economic features. Most prominently, the concentration of business services employment in large urban areas has been falling (i.e., business services jobs have been spreading out toward smaller cities) in the U.S. since 1990. Apparently, the greater ability and lower cost to communicate electronically over time has allowed smaller cities, as well as other nonurban settings, to win out over large, densely populated cities that more easily facilitate face-to-face interactions.
It has been observed that business services employment dipped more than the overall employment during the recessionary periods of the early 1990s and 2000–03. Such cyclical sensitivity to the general economy has long characterized so-called blue-collar and production employment, but its emergence for occupations in business services was somewhat novel during the recession of 1990–91 and its aftermath, when labor market restructuring of mid-level managers and other white-collar occupations took place. In the more recent recessionary period, white-collar employment declines in business services were associated somewhat with the slackening of investment in information equipment and associated services. More generally, many business services may be characterized as “investment goods” by companies, meaning that their purchase tends to slacken during recessionary and subsequent recovery periods, when firms no longer need to expand their own production capacity.
Midwestern metropolitan areas have generally followed these national trends and characteristics of NAICS 54 employment, although there have been some exceptions. For one, as shown below, some of the region’s large metropolitan areas are generally less concentrated in business services as measured against the national employment structure. In part, this follows from the higher manufacturing intensity of Midwest cities; by construction, if a region’s employment base is high in one sector, that concentration must be offset in the others. And so, although Des Moines, Milwaukee, and Indianapolis are centers of business services in relation to the surrounding Midwest areas, their employment base is less concentrated in business services (as narrowly defined) than is the U.S. employment base.
3. Midwest employment concentration index, MSAs NAICS 54
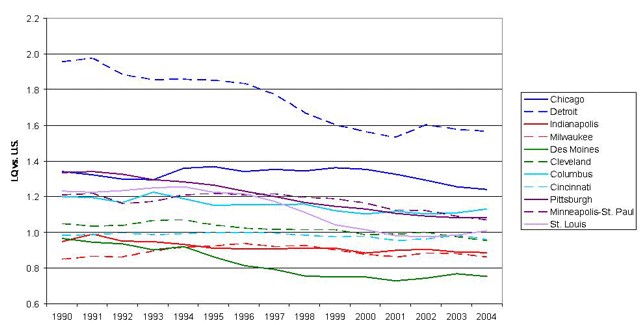
The Chicago and Detroit metropolitan areas register as the most concentrated in business services among large metropolitan areas in the Midwest, with Columbus, Pittsburgh, and Minneapolis–St. Paul also registering concentrations well above the national average.
Owing to its reputation for automotive manufacturing, it will surprise some to find that the Detroit metropolitan area claims the largest concentration in business services. In fact, in this regard, Detroit leads the Chicago area, which is generally renowned as the region’s services and financial capital.
A closer look at the employment structures within the general category of business services raises some interesting and serious questions about the growth prospects of business services for large metropolitan areas in the Midwest. The bar chart below displays the concentration indexes for each detailed business services category, comparing the Detroit MSA with the Chicago MSA.
4. 2005 concentration index
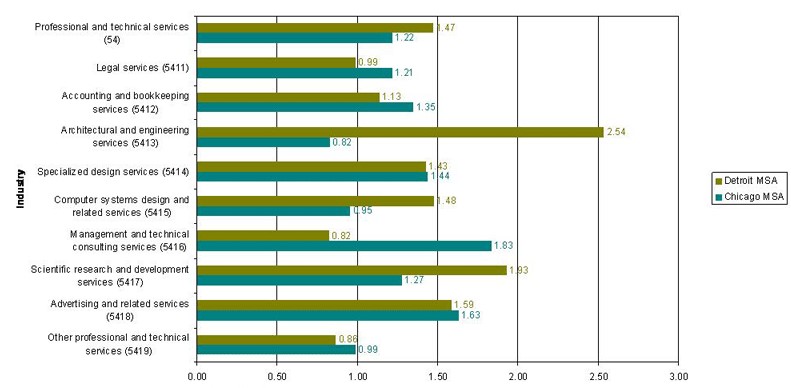
Chicago and Detroit specialize in different sectors of business services. The Detroit MSA scored highest for “architectural and engineering services,” while Chicago scores lowest in this category. This specialization’s high score in Detroit reflects the product engineering completed for the automotive industry, much of which is driven by local demand by domestic automakers. However, some of Detroit’s business services have evolved to serve global customers as well. Another one of Detroit’s employment concentrations, scientific research and development (R&D), also largely reflects Detroit’s reputation as a global research and design center for the world’s prominent automakers. Toyota, for example, has recently announced a new $150 million R&D facility to be built near Ann Arbor, Michigan.
The Chicago MSA’s most significant specialization is “management and technical consulting.” The Chicago area is the domicile of major offices of world-renowned management consulting firms, including Accenture, Booz Allen Hamilton, McKinsey & Company, and A.T. Kearney. Facilitated by the strong air travel connections at Chicago’s O’Hare International Airport, these firms’ consulting operations are able to serve clients throughout the region, the nation, and the world.
As the Midwest’s historic industry specializations decline in size, especially manufacturing, such business and professional services will be increasingly important in maintaining the region’s size and high household incomes. But to what degree are such industries derivative and dependent on local manufacturing itself? If sales to local firms dominate these sectors, then the prospects are possibly dimmer because productivity gains in goods production continues to shrink the nominal share of income derived from manufacturing and agriculture.
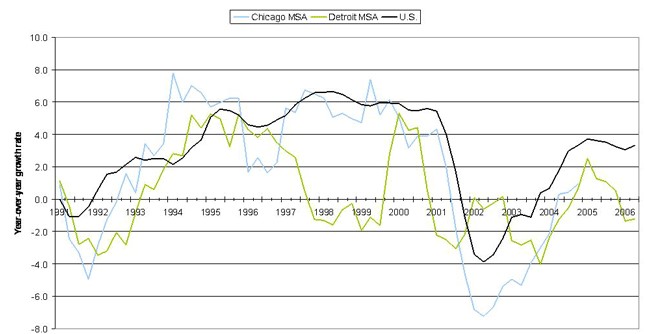
The recent employment performances in business services in Detroit and Chicago offer some clues regarding the degree to which business service firms in the Midwest have expanded their customer base beyond the immediate region. The evidence suggests that business services in these cities do continue to depend on midwestern customer demand in an important way. Midwest employment growth has been lagging significantly since the 2001 recession. At the same time, as the chart below suggests, local employment in the professional and technical services category has also dipped to a greater degree than the national employment, suggesting that the demand for these services derive from local rather than national or global markets. Moreover, further analysis of the employment data suggest that these cities’ steeper-than-national-average declines did not result from any unfortunate mix of industry subsectors in Chicago and Detroit. In particular, had Detroit’s individual industries under the NAICS 54 category each grown at the national rate from 2001-2004, the larger sector’s decline would have totalled only 2.1 percent rather than the actual 7.3 percent decline. And similarly for Chicago, rather than the actual 9.7 percent decline over the period, the NAICS 54 employment decline would have amounted to only .8 percent. And so, though the evidence is not definitive, it appears from this performance that the NAICS 54 sector in Chicago and Detroit continues to serve regional markets to some considerable degree.
5. NAICS 54 year-over-year employment growth
Professional and technical services continue to be important national growth sectors that merit a close watch by Midwest economic analysts. Nationally and regionally, these sectors continue to grow as goods producers and other businesses expand their use of such specialized services and as they outsource some business services that were previously conducted in-house. Regionally, given the slower pace of business expansion in the Midwest, the growth prospects for large Midwest cities, such as Detroit and Chicago, would probably be more robust should their business services firms expand their markets throughout the nation and the world.


