Midwest labor markets: Not as bad as we thought?
By now, it is common knowledge that the Midwest labor market is softer, on average, than the rest of the nation. In our Seventh District states of Illinois, Indiana, Iowa, Michigan, and Wisconsin, the unemployment rate has been running one half percentage point higher than the nation for the past two years. Reported payroll job growth has been running poorly as well—at approximately one-half the national rate. The Midwest’s manufacturing sector has also been weak, dragged down by ongoing restructuring among domestic car makers and parts suppliers.
This March, a glimmer of better news was delivered by the U.S. Bureau of Labor Statistics, who rebenchmarked revised monthly state payroll job numbers back from December 2005 to January 2004. The BLS rebenchmarks the employment data each year to take into account more comprehensive data that becomes available on the number of jobs in each state.
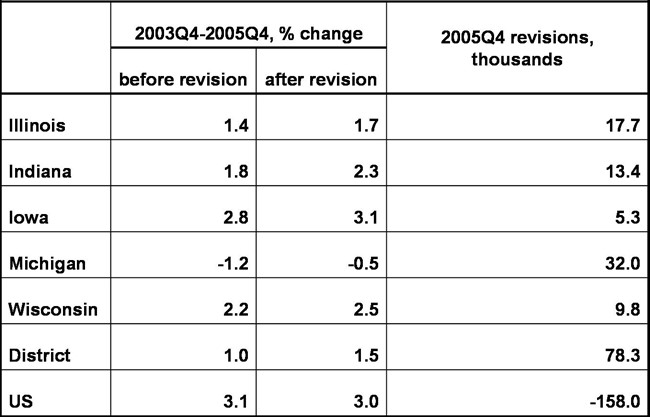
Recent revisions boosted the two-year growth of total employment for the Seventh District, while the U.S. was revised downward slightly. The chart below displays revisions by state from the fourth quarter 2005 back two years to the fourth quarter of 2003. After revising District jobs upward by 78,000 for the fourth quarter of 2005, job growth was found to be 1.5% versus 1.0% prior to revision. U.S. payroll jobs were revised downward slightly (by 158,000). Even after this convergence, the pace of reported job growth for the District lies at one-half the national pace!
1. Total payroll employment, NSA
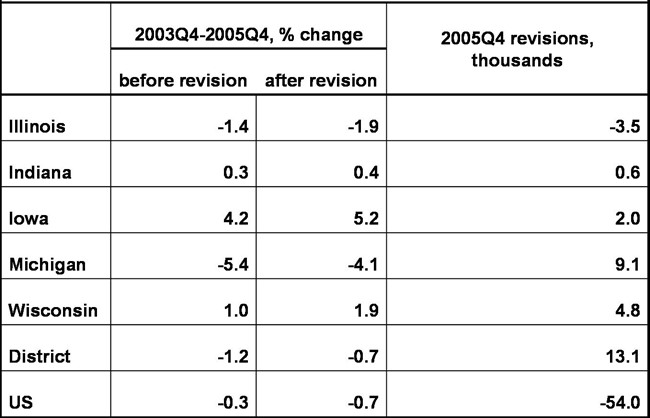
On the beleaguered manufacturing side, favorable revisions were repeated. District manufacturing jobs were revised upward by 13,000 for the fourth quarter of 2005, which raised the pace of decline from a 1.2% decline to a 0.7% decline. For the U.S., revisions eliminated 54,000 jobs, and lowered the pace of growth from –0.3% to a 0.7% decline, thereby matching the District pace over the two-year period.
2. Total manufacturing employment, NSA
In may seem incongruous that pace of the the District’s manufacturing sector matched that of the U.S., while the District’s total employment growth was only one-half of the U.S. This results from the fact that manufacturing jobs are much more concentrated in the District—by about 43%. A falloff in District manufacturing activity is also keenly felt across service sectors such as transportation and distribution.
Considerable statistical noise remains in these numbers. Next year, the payroll numbers will be revised once again, and these revisions will include the fourth quarter of 2005. This means that the payroll job performance reported here will also be revised. Stay tuned.


