What industries are key to Midwest economic performance?
Urban economist Wilbur Thompson once said, “Tell me your industries, and I’ll tell you your future.” A region’s industries do tell us a lot about its economy. In the Midwest, manufacturing industries often drive fluctuations and trends in the region’s overall economic growth because manufacturing is a much larger part of its economy, on average, than the rest of the nation’s. So, too, manufactured goods are traded far and wide—that is, they are exported and imported across national boundaries as well as across regions that make up the U.S. economy. Accordingly, shifts in demand for manufactured goods can have an outsized impact on states and communities in the Midwest. For example, a national shift in buying behavior toward foreign nameplate autos, or toward smaller and more energy efficient autos, may well impact automotive production, investment, and employment in some parts of the Midwest region.
On a short-term basis, fluctuations in aggregate economic activity, such as recessions, diminish demands for durable goods such as capital equipment, thereby making the Midwest economy more sensitive to national “business cycle” fluctuations.
So, too, many Midwest manufacturing industries are impacted by global competitive shifts. Production operations of some home appliance manufacturers have shifted to Mexico, for instance.
But how can we identify which particular industries to observe and follow in the Seventh District? First, we must ascertain how concentrated is an industry in a local economy as compared with the national economy. Analysts often construct a “location quotient” to do so. In one such application, each industry’s employment share of total employment in the region is compared with its national counterpart. The comparison is constructed as a ratio with the local share on top. For example, if a locality’s labor force had 20 percent of its workers in manufacturing as compared with 10 percent nationally, the index (ratio) takes on a value of 2.0, i.e., 20/10. Parity with the nation would take on a value of 1.0.
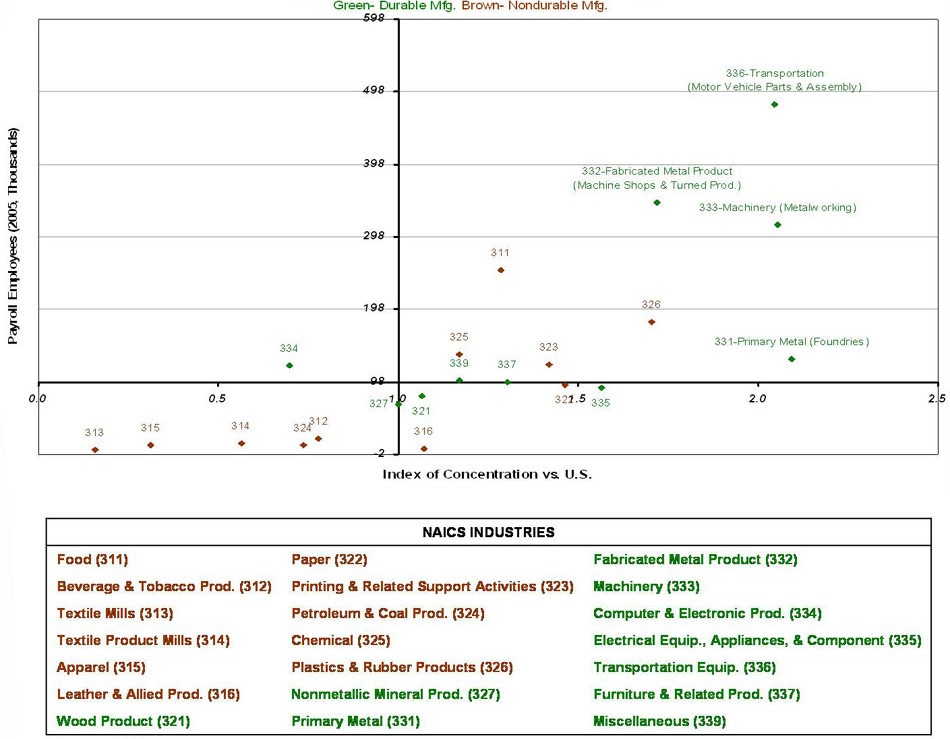
While such an index is useful by way of comparison, it says little about the actual size of a particular industry in a state or region. For this reason, the chart below identifies manufacturing industries in the Seventh District states by relative concentration and by employment size. The horizontal scale depicts the concentration, and it is centered at the index value of one, or parity with the nation. The vertical scale is centered at the value of the median-sized manufacturing industry in the District (as measured by payroll employment).
By construction then, we may quickly characterize the most prominent industries in the District as they are located in the upper right hand quadrant of the graph. For the District, it is clear that transportation, food processing, and machinery are the most prominent industries, with transportation (representing automotive) winning hands down. The fabricated metal products sector also looms large; however, these industries represent many diverse intermediate products that are eventually used to produce more final goods such as autos or machinery. Primary metals, principally steel foundries as designated by the industry code 331 on the chart, is the most concentrated industry (as measured by employment) in the District. Yet, its employment is relatively small in comparison.
1. Industry by concentration and size — 7G District
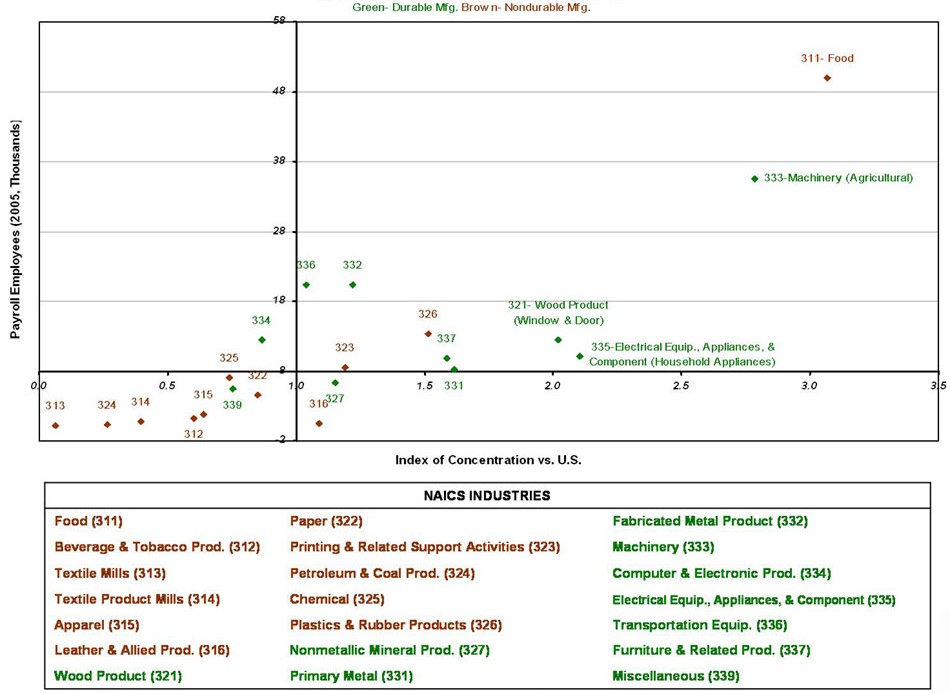
Charts for each individual state will soon be available on our Midwest Regional Website. Iowa is reproduced below. As the chart suggests, employment in food processing stands out as the largest and the most concentrated in the state. In large part, this activity represents Iowa’s further processing of corn and soybeans into meals and oils, as well as its meat packing industry, chiefly pork. Iowa’s large and highly concentrated machinery industry reflects its focus on its manufacturing of farm machinery and equipment.
2. Industry by concentration and size — Iowa
Analysis of the District’s lesser industries can also be informative. In the overall U.S., the computing and electronic products industries have grown rapidly into a large component of overall U.S. manufacturing. In virtually every Seventh District state, for example, employment in this sector exceeds the median manufacturing sector. But at the same time, the states’ concentration of this sector is universally below the national average. In this instance, the sector’s lower concentration and lesser expansion here have contributed to a slower pace of overall economic growth.
Of course, these glimpses are only a superficial beginning to understanding the structure and behavior the region’s economy. For one, individually identified sectors often have important linkages to others that merit further consideration. Such industries as machinery and autos, for example, purchase great volumes of intermediate materials and parts locally, including those found in rubber and plastics, fabricated metals, and machinery (e.g., tool and die and metal cutting machinery). Also, in varying degrees, sectors may purchase local services as diverse as management consulting and transportation. Specific industry linkages can be found in the input–output tables of the U.S., which are produced by the U.S. Bureau of Economic Analysis.
However, the U.S. input–output tables may often be misleading for regional analysis. That is because specific inter-sector buying and selling relationships will differ greatly and vary widely from region to region. For one, local firms will purchase intermediate goods and services from many possible places. For the most part, we know little about the varying geography of such relationships. In response, the BEA has adapted and estimated the national relationships for individual regions of the U.S. in its RIMS II modeling system. This system and others like it, which are available commercially, are often used to estimate the broader economic impacts of small changes to a community or local industry.


