Metropolitan area exports
Expanding export activity has taken on added importance in recent years. For example, the newly released Economic Report of the President (ERP) reports that export growth accounted for one-third of U.S. economic growth in 2006 and 2007. Looking ahead to 2008, this export importance will continue as the U.S. economy slows even while economic growth in many developing regions continues to be robust. Rising incomes abroad stimulate appetites for U.S.-made goods and services alike.
It is timely, then, that new information on goods exports for individual metropolitan areas has just been released by the International Trade Administration (ITA), based on U.S. Census Bureau data. Exports figure prominently in regional economies such as ours that are steeped in manufacturing and agricultural production. On a national scale, the ERP describes the many benefits of export activity. In addition to high-paying jobs and incomes, exports spur U.S. producers to innovate to compete with in global markets. So too, as U.S. producers expand to serve global markets, they can often achieve low-cost economies of scale, thereby reducing prices for consumers.
The new data series on metropolitan exports covers goods only. This means the importance of exports to metropolitan economies is understated in the data because exports of services such as medical, tourism, banking/finance, and transportation now account for 28% of U.S. exports. Moreover, metropolitan areas typically specialize in such services, with ongoing shifts toward service concentration now underway.
Despite our lack of data on service exports, a metropolitan area’s rank order in goods exports very likely reflects its local service exports as well. In the production process, manufacturing companies purchase many services ranging from finance to management consulting, transportation, design, law, R&D, and advertising. The value of these services become part of the value of the final goods for export, and many of these services are purchased locally. Accordingly, in many instances, a host of value added products from surrounding service companies lies behind a metro area’s goods exports.
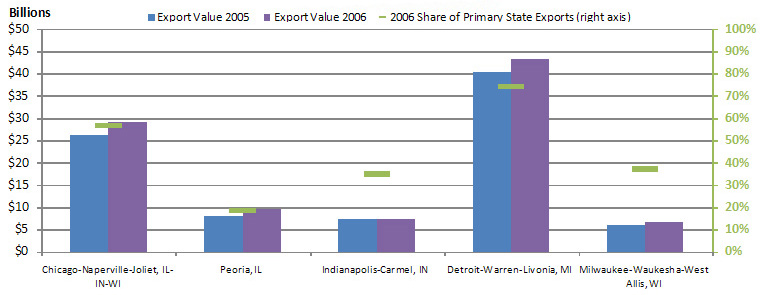
Given the Midwest region’s prowess in durable goods manufacturing, it comes as no surprise that metropolitan areas in the Seventh District originate considerable goods exports. The chart below shows export values for several metropolitan areas. The Detroit area leads with a reported $43.3 billion in exports in 2006, comprising 74 percent of Michigan’s exports abroad (see right axis). Detroit’s automotive trade with Canada remains considerable. Currently, the rising value of the Canadian dollar is pressuring production towards the U.S. side of the Michigan–Ontario corridor.
The Chicago area’s total goods exports approached $30 billion in 2006. In addition to traditional heavy manufacturing and food products, Chicago exports medical supplies and equipment and pharmaceuticals.
1. Export values and shares
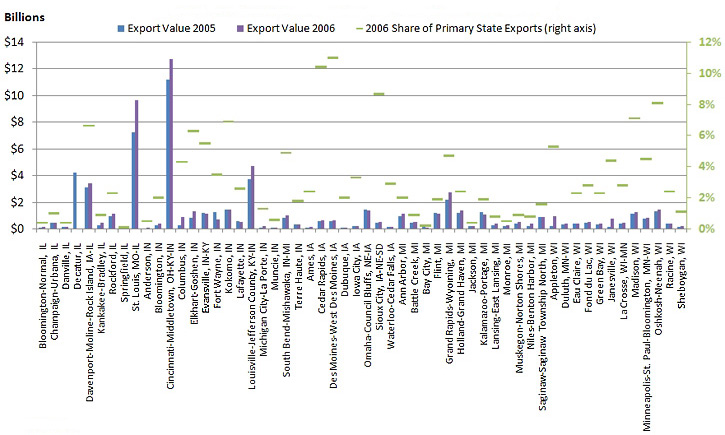
2. Seventh District MSA export values and shares
In order to gauge the relative importance of exports to metropolitan areas, we make use of recent BEA (Bureau of Economic Analysis) estimates of total metropolitan area product. Dividing a metropolitan area’s exports by its gross product yields a rough measure of each region’s income share that is earned by producing goods for export abroad. By this measure, we see in the chart below that Peoria, Illinois, home of construction equipment manufacturer Caterpillar, derives over 50% of its income from producing goods for export. While this is a useful indicator, it does overstate Peoria’s share somewhat because Caterpillar and other Peoria manufacturers assemble final goods using component parts and services from other parts of the Midwest, the nation, and the world. So part of the measured value of Peoria’s exports reflects the embedded value added of goods and services produced elsewhere. For larger regions, such measures tend to be more accurate since the intermediate components are more likely to be produced within the region.
3. 2005 export intensity of identifiable MSAs

Note: Export intensity is calculated as exports over the gross domestic product of the specified area. Identifiable MSAs consist of those exports that could be attributed directly to a metropolitan area.
The next chart shows export intensity for all of the Seventh District metro areas. Most lie above the U.S. average in export intensity. Open markets abroad are an important part of the economic vitality of these communities.
4. 2005 export intensity of identifiable MSAs
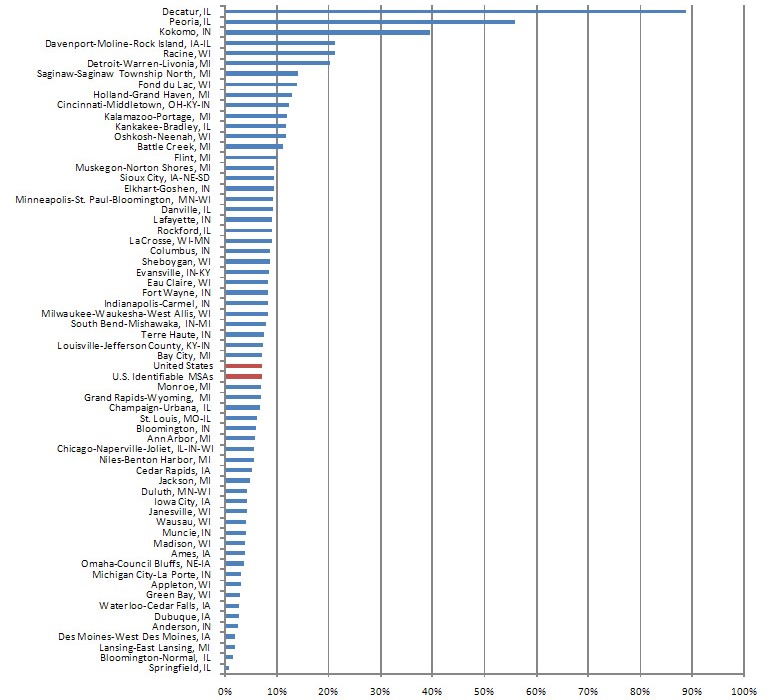
Note: Export intensity is calculated as exports over the gross domestic product of the specified area. Identifiable MSAs consist of those exports that could be attributed directly to a metropolitan area.
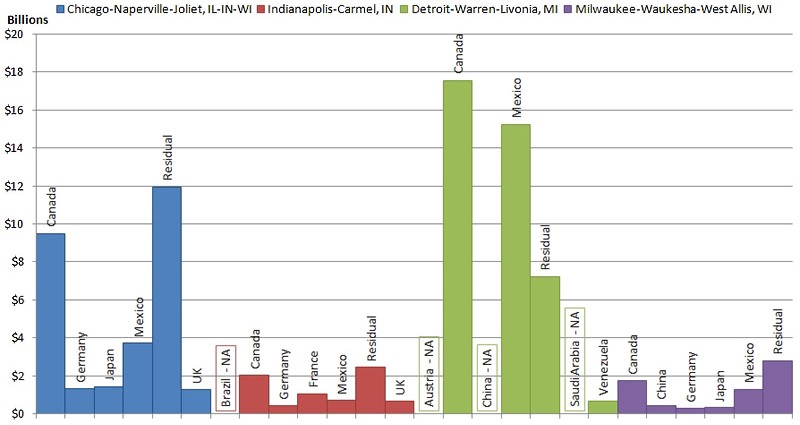
Where do District metro areas export? The ITA provides the destination by both country and general region of the world. Canada and Mexico—our NAFTA partners—predominate as export destinations for metro areas (chart below). Europe also remains important, especially Germany, France, and the U.K. In Asia, Japan figures prominently, with China as the fastest growing export destination.
5. Exports by country
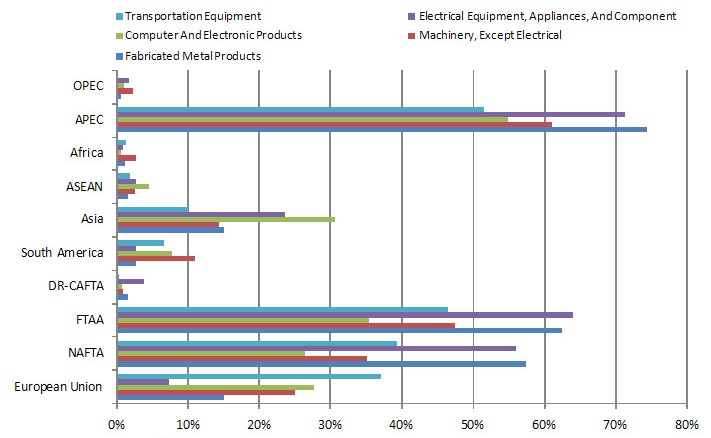
Finally, the ITA data offer a finer breakdown, indicating both the specific industry categories of exported goods and their destination. As one example, the next chart displays export patterns for the Milwaukee metro area. True to its industry structure, the Milwaukee area exports durable goods such as electrical equipment (e.g., medical scanners and electronic controls) and nonelectrical machinery (e.g., small engines and construction equipment). All major regions of the world (and trading blocs) are destinations for Milwaukee exports.
6. Milwaukee exports — share of global exports
The outlook for Midwest exports remains strong. As the 2008 ERP suggests, foreign income growth is likely the strongest impetus to U.S. export growth. As developing nations raise their standards of living, their appetite for manufactured goods rises sharply, as does their demand for food products.
The 2008 ERP also indicates that U.S. exports are very sensitive to income growth abroad. In part, that is because developing countries are investing heavily at home both to produce goods for export and to serve rising domestic demands. For that reason, they purchase capital goods—those that are needed to expand production capacity such as machinery and equipment. Since capital goods are needed to expand production capacity, a slowing economy ratchets down purchases of capital goods and an accelerating economy ratchets up purchases. The U.S. economy specializes in capital goods, such as those produced in Milwaukee and Peoria.
But what generates the income growth in developing countries that, in turn, propels their demand for U.S. exports of capital goods? In part, trade agreements allow developing countries to generate income (from sales abroad) and thereby raise living standards by lowering tariff and nontariff barriers to export sales abroad.
The ERP reports export sales from the U.S. to regions of the world with which the U.S. has recently signed trade agreements. In almost every instance, subsequent export growth to the trade agreement nations well exceeded overall export growth.
Of course, these agreements also make it easier for foreign nations to sell into U.S. markets. In many instances, such foreign competition displaces firms employing domestic workers. Though the overall process of expanding trade is vital to raising living standards both here and abroad, the related labor market upheaval often gives rise to anti-trade sentiment.
Estimates of import sensitivity by individual metropolitan area are problematic. Imports are counted and tracked at the U.S. border and no further. But in a 2003 article, I constructed some rough estimates of import sensitivity by examining a metro area’s industry mix and then weighting a metro area’s industry mix by the degree to which imports had penetrated U.S. markets. I found that large metropolitan areas were not experiencing growth in trade sensitivity to the same degree as smaller and medium-sized metro areas. However, this may be explained by the growing service orientation of large metro areas. Since many of these services do become embedded in the value of manufactured goods, the trade orientation of large metropolitan areas may be understated by my (goods-based) estimates.
Vanessa Haleco-Meyer contributed to this entry.


