Midwest in Recession: Then and Now
Longtime Midwest residents may be befuddled by ongoing comparisons of the current national recession with those of 1974-75 and 1981-82. While the headlines suggest this recession compares, so far, with the deepest recessions of the past 50 years1, we in the Midwest have a somewhat different perspective. For us, the recessions of 1974-75 and 1981-82 were far worse, at least so far. An exception may be made here for Michigan, which has been experiencing a recession of sorts all decade long.
Statistical comparisons of regional recessions with the nation are difficult for a number of reasons. Arguably, the best basis of comparison can be made using payroll employment data which are available monthly from the Bureau of Labor Statistics.2 In the charts that follow, we index job levels in states, the Seventh District (Illinois, Iowa, Indiana, Michigan, and Wisconsin), and the U.S. to a beginning value of 1.0. We begin the time series at the quarter in which employment levels peaked in the state, region, or nation. Since employment peaks may differ between a state or region and the U.S., we sometimes begin comparative series at slightly different dates. For example, employment in the Seventh District last peaked in the second quarter of 2007, but the U.S. peaked in the fourth quarter of 2007. (On the charts, the indexed lines will appear to begin in the same quarter). We use seasonal adjustment to iron out variations in employment that typically occur every year.
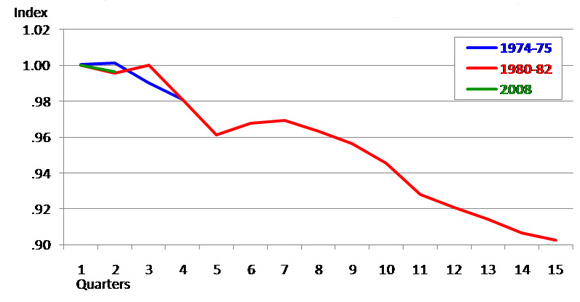
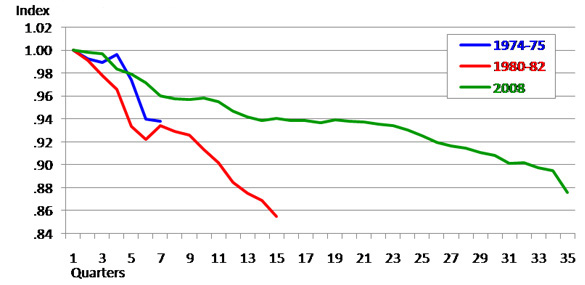
The chart below compares payroll job growth for the Seventh District versus the U.S. during the 1974-75 downturn, the 1980s downturn(s), and the 2008 downturn. The U.S. economy officially recorded two back-to-back recessionary periods in the early 1980s. Since the episodes took place so close together, and since the Midwest experienced virtually no pause between downturns, we index jobs beginning from the previous peak (1980-Q1 for the U.S. and 1979-Q2 for the Seventh District) through to the final trough.
In examining payroll job performance during these recessionary periods, the first thing to note is that payroll employment dropped more rapidly in the 1974-75 recession (blue lines) than in subsequent recessions. Seventh District payroll job levels fell by 4% in the four quarters following their peak in the third quarter of 1974 (before turning upwards). In comparison, and despite the dramatic declines over the past few months, the current recession has experienced a shallower and slower decline from the previous employment peak (green lines).
1. U.S. nonfarm payroll employment (first quarter corresponds to employment peak of the recessionary period)
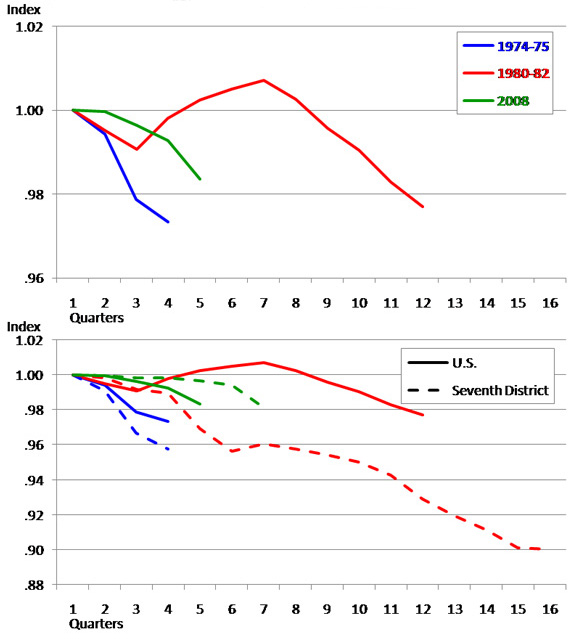
Recent job declines have also been shallower so far than the fairly dramatic declines the Midwest experienced in the 1980s (red lines). After reaching a peak in 1979, payroll jobs in the District fell for four years, reaching bottom in the first quarter of 1983 at 10% below the peak. The U.S. experience of that time was quite different. Following a slight decline in 1980, national employment growth resumed briefly before falling 3% during the 1981-82 recession. Over the entire length of both recessions, the pace of job decline in the Seventh District was more than five times that of the nation.
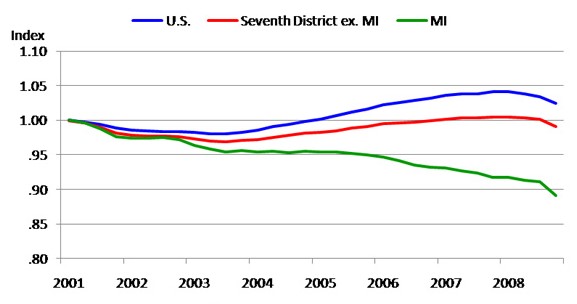
The dismal experience of having no post-recession recovery is one that the state of Michigan is now experiencing. The chart below indexes payroll job decline and growth circa the 2001 recessionary period. From its second quarter peak in year 2000, Michigan’s employment has fallen by over 10% (green line). The remaining states of the Seventh District—Indiana, Illinois, Wisconsin, and Iowa—have fared somewhat better, but in the aggregate the four-state region only recently regained its previous peak. In contrast, national employment had regained its previous peak by the end of 2004.
2. Nonfarm payroll employment
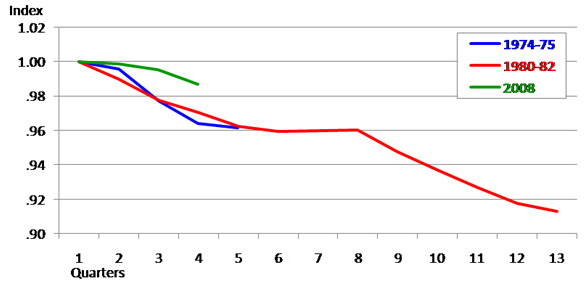
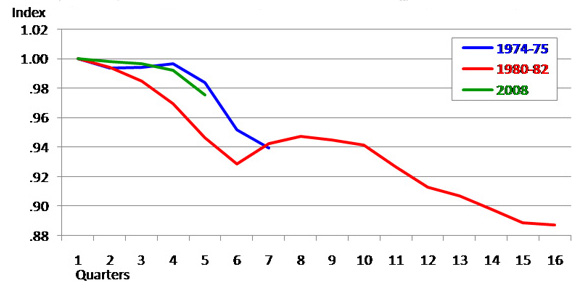
The final charts (below) display the employment experiences of each Seventh District state for the three aforementioned periods. In each state, the 1980s look worse than the current recession. This is even true for Michigan, which underwent a 15% job decline from its peak in the second quarter of 1979 to the fourth quarter of 1982. However, Michigan and its troubled automotive industry enjoyed a big bounce in 1982 when U.S. consumers returned to auto showrooms and began to buy cars at a rapid pace as gasoline prices eased. This time around, Michigan and much of the surrounding Midwest automotive belt hope for a repeat performance. However, Michigan’s current automotive challenges are surely more structural and deeply rooted. It will take more than an upturn in national automotive sales to pull along the state’s employment and income.
3. Illinois nonfarm payroll employment (first quarter corresponds to employment peak of the recessionary period)
4. Indiana nonfarm payroll employment (first quarter corresponds to employment peak of the recessionary period)
5. Iowa nonfarm payroll employment (first quarter corresponds to employment peak of the recessionary period)
6. Michigan nonfarm payroll employment (first quarter corresponds to employment peak of the recessionary period)
7. Wisconsin nonfarm payroll employment (first quarter corresponds to employment peak of the recessionary period)

Footnotes
1 The nation also experienced less serious downturns, during 1969-70, 1990-91, and 2001. Available online.
2 Payroll employment numbers are subject to revision in March of every year. Availble online.


