Migration, Michigan, and Labor Market Adjustment
In part, American households have adjusted to local economic shocks by picking up and moving to regions where job and income opportunities are more abundant. Some of these movements have been broad and steady, such as the shift in population westward from the east over the past two centuries, and the north to south migration during the latter 20th century. Other migrations are more dramatic, such as the migration of African-Americans from agricultural parts of the middle South to northern manufacturing-oriented cities during the 20th century; or the Dust Bowl out-migration to California from parts of the Plains during the 1930s. Other dislocations have been more local, such as those resulting from contractions in coal mining, textile mill, and steel-producing towns in recent decades.
When such migrations take place in response to sharp negative economic shocks, they can be painful and costly both for the households who move and for the communities left behind. Those who migrate are often in desperate circumstances, and so there are high costs associated with loss of friends, family, and knowledge of local living pathways. Shrinking communities do not adjust easily. The least fortunate populations may be left behind to be supported by a tax base that has dwindled. And for those communities with shrinking population, the neighborhood housing and public infrastructures are not easily re-configured to serve smaller populations.
Nonetheless, due to its vast size, common laws, and common language, the United States is often considered to be a place where the ease of spatial mobility facilitates economic adjustments. This is true despite a few institutional impediments, such as non-portable state unemployment insurance systems as well as health insurance tied to workers’ local employers.
Home ownership may be another significant impediment that has grown over time. Since the 1940s, homeownership rates had expanded from 44 percent of households in 1940 to 69 percent by 2005. The sale of a large asset such as a home is typically accompanied by large transaction costs. And today, in the aftermath of the national freefall in home prices, many local housing markets are stagnant as would-be buyers await price stability. Moreover, price declines have left many homeowners “under water,” meaning that the likely sales price of their home would be less than the amount of the mortgage they must pay off at the time of sale. In some instances, homeowners cannot cover such losses from their savings or secure another loan to pay off the mortgage. Consequently, in situations where homeowners do not default and walk away from their obligation, or where households are uprooted due to foreclosure, the soft housing market is likely to slow migration in search of employment.1
According to a recent report from the Census Bureau, the rate of interstate migration from 2007–08 was the lowest since 1948. Comparing migration in the year ending mid-year 2008 versus the previous year, 30 states experienced declining net domestic migration.
Other factors lie behind the falling trend rate of interstate migration. The U.S. population is aging, and older households tend not to move as readily. But the more recent falloff is likely tied to the aforementioned economic developments; migration rates have been found to respond to imbalances in regional economic conditions. Demographer William H. Frey notes that, during the middle years of this decade, the fast-growing metropolitan areas in Florida, Arizona, Nevada and California experienced enormous in-migration spurred by both the house price appreciation and the attendant jobs in construction and related economic sectors. Now, in-migration to such places has cooled and even reversed in some places, as home prices and jobs have declined.
More generally the national slowdown in economic activity may also be impeding inter-state migration. In investigating business cycles over the past 60 years, Raven E. Saks and Abigail Wozniak find that labor migration rates rise with cyclical upturns and fall with downturns, especially for younger working age people. These effects are independent of the degree of differences in inter-state economic conditions, and may reflect the shifting costs of job search and job matching that take place over the business cycle.
Despite such costs, migration remains attractive for some households whose local economies are particularly depressed. For example, in Michigan, the national recession has sharply deepened economic trends that have long been underway. Owing to unprecedented restructuring in its automotive sectors, the state’s labor markets have been weakening all decade long, with a cumulative decline of nonfarm payroll jobs of 17 percent. Its current unemployment rate of 15.2 percent leads all other states.
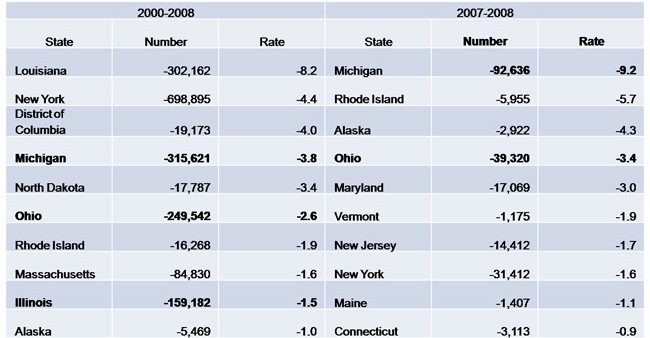
The chart below shows Michigan’s annual rate of net domestic outmigration (in red) juxtaposed against the difference between Michigan’s unemployment rate and the U.S. rate (in blue)2. As Michigan’s labor market has weakened over the decade, the rate of outmigration has accelerated 3. At mid-year 2008, Census figures estimate that the state lost 92,600 in domestic population. Cumulatively, domestic outmigration amounts to an estimated 315,600 over the decade (table below).
Chart 1. Rate comparisons
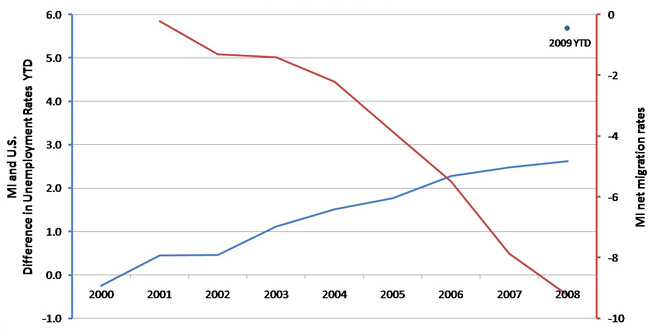
Table 1. Net outmigration rate: Top states
Outmigration is one of several mechanisms by which Michigan workers will adjust to the shocks to their economy and job market, but not the preferred one in most situations because of the adverse impact on households and local communities. National and global economic recovery will help, too, by lifting demand for cars and other Michigan products and services. Other adjustments will involve re-training for emerging local jobs that may come about as new industries and investment opportunities develop in the state.
Note: Thanks to Vanessa Haleco-Meyer for assistance.
Footnotes
1 Some studies find no difference between owners and renters, however.
2 These data report only interstate movements of existing residents. In-migration of foreign population are not included, and these vary greatly by state.
3 Population migration estimates are very uncertain. However, the general patterns and rankings cited and displayed here for Michigan are largely corroborated by alternative estimates that have been made by a state agency in Michigan, as well as by tallies of inward and outward bound shipments reported by residential moving companies.


