Comparing Jobless Recoveries
The term “jobless recovery” was coined in the aftermath of the 1990–91 recession because job growth following the end of that recession was quite slow. Job growth was also slow after the 2001 recession. A similar pattern in job growth has emerged for the most recent recession: At midyear in 2010, the economic recovery is under way, although again job growth is not nearly as robust as desired.
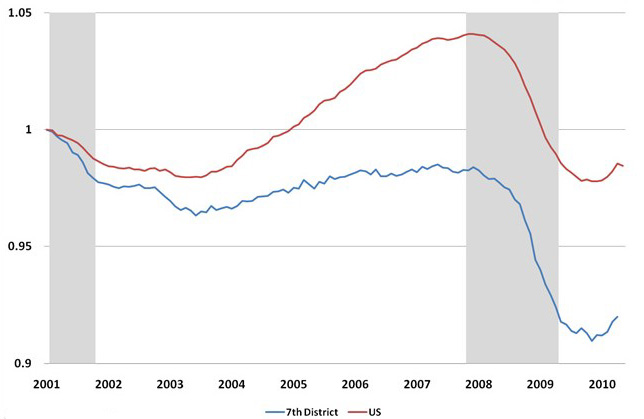
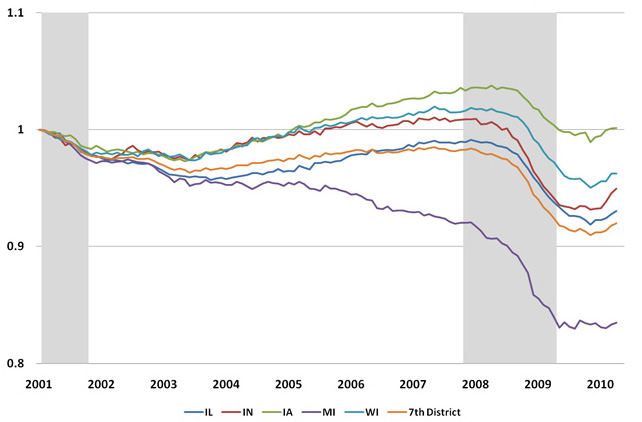
The arbiters who date the beginnings and ends of recessionary periods—i.e., members of the National Bureau of Economic Research’s (NBER) Business Cycle Dating Committee—have not yet formally decided on the end date of the most recent recession. However, the latest recession is widely thought to have ended in May or June of 2009. At that time, U.S. nonfarm payroll employment had declined by approximately 7 million from its previous peak. Yet, as measured on a month-to-month basis, employment continued to decline through December 2009, albeit at a slower pace. The chart below indexes total employment from the U.S. employment peak in 2001 for the nation, as well as for the Seventh District states of Illinois, Indiana, Iowa, Michigan, and Wisconsin.
Figure 1. Nonfarm payroll jobs (index, February 2001=1)

Fiugre 2. Nonfarm payroll jobs (index, February 2001=1)

As the figure above suggests, payroll employment began to turn upward in January of 2010 for the U.S. But to date, job gains in the nation and in the District have been tepid when compared against the peak-to-trough job declines. Accordingly, public opinions on the overall economic recovery have been somewhat negative. Consumer sentiment readings, for example, have largely remained flat since their partial recovery during 2009, when financial market conditions had improved.
In my analysis, I assume that the most recent recession concluded in May 2009, which may not turn out to be the case according to the NBER. Over the period June 2009 through May 2010 (the first 12 months of the recovery overall job growth closely resembled that of the first 12 months following the end of the 2001 recession (December 2001 through November 2002). For the nation, the U.S. lost a net 560,000 jobs from June 2009 through May 2010, versus 562,000 during the first twelve months following the 2001 recession. Similarly, the Seventh District states lost 74,000 jobs over this recent 12-month span, versus 67,000 during the first twelve months after the 2001 recession.
Although the current labor market rebound is proceeding at about the same pace as the 2001–02 experience, it falls well short of expectations. That is because, this time around, the amount of jobs lost that need to be regained through job growth is much larger. As the chart above again illustrates, the recent recession was much greater in both depth and duration. Nationally, from the most recent peak in employment to its trough, over 8 million jobs were lost. Over the course of 2010, the economic recovery has resulted in new jobs totaling a little over 10 percent of that loss. For this reason, indicators of labor market stress—such as the average duration of those who are unemployed and the unemployment rate—remain at elevated levels that have been scarcely seen in many decades.
By comparing individual industry sectors’ job growth over the period June 2009 through May 2010, we can see that the character of this recession’s recovery is quite different from that of the 2001 recession’s recovery. The tables below show industry-specific payroll job gains or losses in the 12 months following the 2001 recession; and for the sake of comparison, they also show these gains and losses in the 12 months following the 2008–09 recession (again, I assume that the most recession concluded in May 2009).
Table 1. Employment gain or loss during the year after the last recession (November 2001-2002) — Thousands of jobs, SA

Table 2. Employment gain or loss during the year after the last recession (May 2009-2010) — Thousands of jobs, SA

Notably, recent job losses in construction evidence the continued weakness in both residential and commercial construction in both the Seventh District and the U.S. As compared with the 12 months following the 2001 recession, the recent construction job losses in the nation continue to unfold at a pace seven times as great (versus three to four times as great in the District). In the U.S. as a whole, 516, 000 construction jobs have been lost from June 2009 through May 2010.
In contrast, the manufacturing sector is faring relatively better, experiencing a net job loss one-fourth as large as the job loss during the aftermath of the 2001 recession. During the current recovery, manufacturers have been furiously rebuilding their inventories after a long period of depletion. As expectations of economic growth were revised upward during 2009, producers realized the need to rebuild inventories in anticipation of sales. In turn, hours worked in manufacturing plants were raised, and net hiring took place, especially as the recovery unfolded.
During the six months ending in May, 2010, net jobs in manufacturing grew (rather than declined) by 109,000 nationally; and they grew by 34,000 across the Seventh District states. In the District, hikes in manufacturing production took place broadly across the regions industries—especially in durable goods — especially in automotive, steel and machinery industries. Growth in exports to other recovering regions of the world, especially countries in Asia and South America, have helped sustain this sector’s hiring.
Unfortunately, job growth in the financial activities sector has thus far not mirrored what has happened in manufacturing. The financial activities sector contributed to net job loss during the first twelve months following the recession in both the nation and in the District, as real estate activity and related lending activities continued to falter. In the post-2001 recovery, employment in this sector grew in both the nation and the District.
The ongoing recovery in professional and business services employment seemingly outperforms what happened following the 2001 recession. However, massive hiring taking place in a single sub-category of professional services, namely, the temporary help category, throws this resurgence into question. Most of the gains taking place represent temporary help that is being taken on by firms who are reluctant to (yet) commit to permanent hires.1
Job gains in both education and health care services are contributing to net job growth during the recent recovery. However, the pace of job growth in both remains slower than in the post-2001 recovery period.
The leisure and hospitality industries continued to add employment during the post-2001 economic recovery, but these sectors are shedding jobs this time around. The depleted wealth of households following the declines in the financial markets and residential real estate markets has raised saving rates, and dampened enthusiasm for leisure and entertainment services.
Finally, state and local government hiring provided a bulwark to the post-2001 recovery period. However, financial stresses in these sectors today are resulting in real budget cuts—including cuts in employment. In the Seventh District, the state-local government sector added 29,000 net jobs in the post-2001 recovery period, but they have already cut 27,000 jobs over the period June 2009 through May 2010. Such cuts are expected to continue as federal recovery assistance funds are depleted—and as states face up to budget realities created by shortfalls in state and local tax revenue.
Footnotes
1 Contract and temporary workers are classified within the business and professional businesses sector, though such workers may be performing work in any sector.


