Job Revisions Downward
Over the past few years, the drop in employment has been steep and painful. A recent reassessment of the job count shows that even steeper declines have taken place than initially thought—both across the U.S. as a whole and in the Seventh Federal Reserve District, which covers all of Iowa and most of Illinois, Indiana, Michigan, and Wisconsin.
The U.S. Bureau of Labor Statistics (BLS) releases much awaited monthly estimates of payroll jobs for the nation. These estimates, which exclude self-employed individuals, are derived from a sample of reporting firms. Once each year, these monthly estimates of payroll employment levels are revised in a major way by the BLS. The BLS revisions are reported during the first quarter of each year to reflect an almost complete count of nonfarm payroll jobs that becomes available for the month of March of the previous year1. In a separate release , state payroll job estimates are similarly revised.
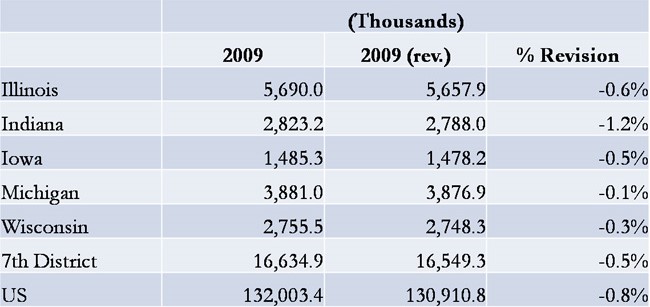
This year’s BLS revisions were unfavorable to both the U.S and to Seventh District states. On an average monthly basis for the year 2009 in its entirety, the revisions indicated further job decline in the U.S., by more than 1 million payroll jobs, or approximately 0.8 percent (table below). All five Seventh District states also reported downward revisions. Only Indiana’s downward revision of 1.2 percent exceeded the nation’s. Revisions for the states of Wisconsin and Michigan were relatively minor.
Table 1. Total payroll jobs
These downward revisions constitute more bad news because the original estimates already indicated rather sharp job declines (chart below). In the chart below, yearly decline is measured by the 12-month percent change from December 2008 to December 2009 (red bars)2. In examining the annual rates of decline before the revisions, payroll job counts for the Seventh District region were off 4.1 percent. Prior to the revisions, the U.S. as a whole showed a net decline of 3.1 percent of total payroll employment over the same period. The revisions to these data widen the U.S.–Seventh District gap, from 1 percentage point to 1.3 percentage points.
Chart 1. December 2008 to December 2009 payroll employment change
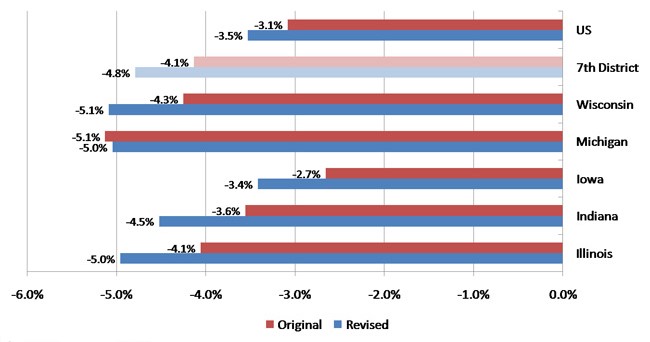
Among individual states, Illinois and Indiana have the sharpest revisions—both at 0.9 percentage points. And the revisions for Wisconsin and Iowa are just behind, at 0.8 percentage points and 0.7 percentage points, respectively. After the revisions, Michigan was actually 0.1 percentage point higher than before—a small bit of good news for a state that lost 840,000 nonfarm payroll jobs since mid-year 2000, an 18 percent decline; by comparison, the U.S. experienced a 1.7 percent decline since that time.
Note: Chenfei Lu and Christian Delgado de Jesús assisted with this essay.
Footnotes
1 These BLS counts are not of workers but of jobs. A worker may hold one or more jobs. Data in the chart are seasonally adjusted.
2 The region reported covers the full state boundaries of those states. As mentioned before, the Seventh Federal Reserve District covers only the parts of Illinois, Indiana, Michigan, and Winsconsin.


