Rebalancing and exports
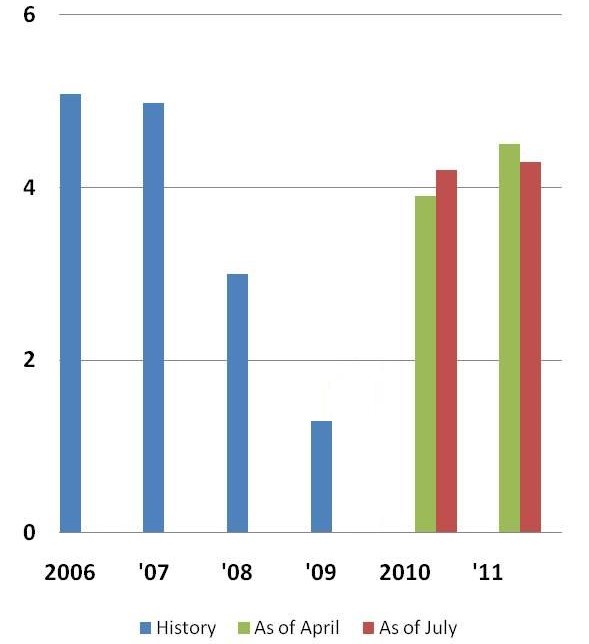
Exports of goods and services have garnered much attention in recent months. For one reason, export growth has been leading the economic recovery in the United States. As several Asian and Latin American economies have begun to recover recently and strongly, they have begun to buy U.S. goods and services. The figure below shows annualized quarterly rates of export growth from the United States. The global recession of 2008–09 resulted in plunging U.S. exports to the rest of the world. However, the economic recovery during 2009–10 has been accompanied by robust export growth and world trade. Though currency swings may have contributed to U.S. export volatility, global swings in overall economic growth were the dominant force behind this volatility. The second figure below illustrates that world economic growth rates plunged by more than half in 2009. The turnaround in global growth was equally sharp, spurring the recovery of U.S. exports abroad. A similar trend can be seen (below) in goods exports from the Seventh District states of Illinois, Indiana, Iowa, Michigan and Wisconsin.
Chart 1. Real exports of goods and services (percent change, billions of chained 2005 dollars, S.A.A.R)
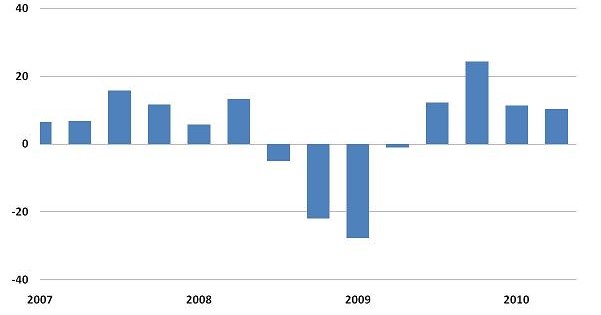
Chart 2. Annual Seventh District exports — Billions of dollars (left) and share of Seventh District GSP (right)
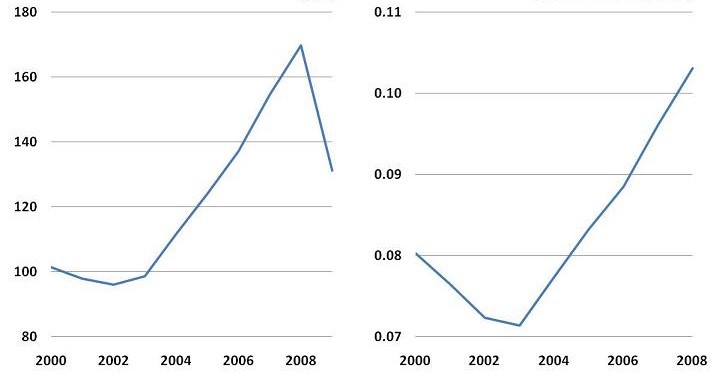
Chart 3. Real world GDP growth (4-quarter percent change)
Looking out over the longer term, many analysts foresee a fundamental reorientation of the U.S. economy toward production and exports—led by a shift in demand by developing nations for U.S. products and services. Over the past few decades, in the United States there has been strong growth in the consumption of goods and services, including imports from overseas, along with low household savings rates. Meanwhile, saving rates in nations such as China and other developing nations have been very high, while their consumption (and imports from the United States) have been relatively low. Given these fundamental misalignments, tomorrow’s realignments may include a U.S. economy that shifts its production capabilities toward serving overseas markets.
Assuming that these developments do materialize, how is the Seventh Federal Reserve District economy positioned to contribute to export growth? As it turns out, states of the Seventh District—Illinois, Indiana, Iowa, Michigan, and Wisconsin—are highly oriented toward goods production destined for overseas markets. In particular, the Seventh District economy is steeped in both manufactured goods and agricultural products that are sold abroad.
Before I illustrate the Seventh District’s export orientation, let me say a prior word about the available data. The U.S. Department of Commerce takes great effort in tracing manufactured exports back to their state of origin. In this way, an exported machine that is produced in Wisconsin, but shipped abroad from Seattle, will not be (mistakenly) attributed to the state of Washington. However, these procedures of tracing the origin of production can be somewhat misleading for raw agricultural exports from the Midwest. Agricultural products tend to be over-allocated to the port of shipment or last storage, rather than to their state of agricultural production. For this reason, the U.S. Department of Agriculture re-estimates the origin of agricultural commodities, assigning U.S. exports abroad back to the home state according to each state’s share of the commodity’s production. For example (and with simplification), total exports of corn from Iowa are estimated from Iowa’s share of U.S. corn production. Such adjustments can be very important for inland states, such as those of the Seventh District.
After making such state-of-origin adjustments for agricultural commodities, the Seventh District’s export orientation becomes more apparent.1 Agricultural exports make up 9.1 percent of the nation’s exports; and they make up 14.4 percent of the District’s exports.
As a share of annual production, or gross state product, the figure below reveals that the Seventh District is marginally more export-oriented overall than the nation. For both the nation and the Seventh District, manufactured goods account for the lion’s share of exports, and this holds true for individual states. Still, Iowa is the exception such that agricultural exports rival manufactured goods exports for that state.
Chart 4. Exports by industry by state (percent of GSP*, 2008)
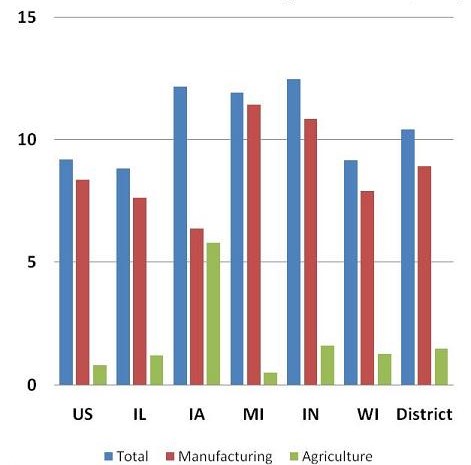
Source: WISER/Haver Analytics, U.S.D.A.
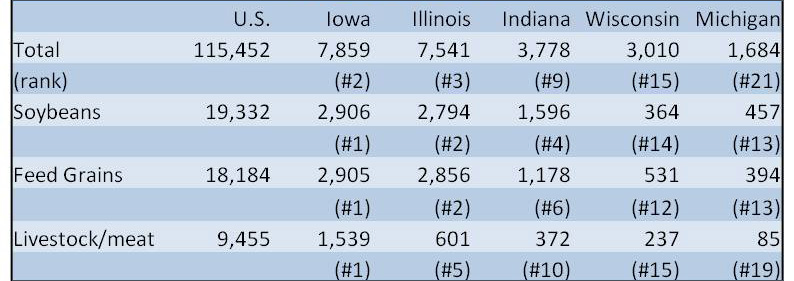
Agricultural exports represent a larger share of output for each Seventh District state, save Michigan, relative to their share for the nation. For fiscal year 2008, the five states of the District accounted for 21 percent of the nation’s agricultural exports.2 All five states were significant contributors. Overall, Iowa and Illinois ranked second and third in the nation—Iowa by virtue of leading the nation in soybean, feed grain, and livestock/meat exports. Illinois’s exports in these same categories also ranked very high, as did Indiana in soybeans and feed grains (table below).
Table 1. U.S. exports by Seventh District states (FY 2008 in $millions)
Agricultural exports from the District have expanded rapidly over the past decade. Continued economic growth in developing nations has led to richer diets in such countries, sharpening the demand for U.S. agricultural products (see table below). Because of the global recession, exports of agricultural products slowed in 2009, but they are now rising once again in 2010 as global economic recovery unfolds.
The Midwest and Seventh District manufacturing sectors are also major exporters. As set out in my previous blog entry, the District produces capital goods, heavy machinery, and transportation equipment needed by developing countries as they build their own economies. (See also the detailed tables at end of this article.) However, the data’s assignment of U.S. manufactured exports to individual states and localities should be viewed as suggestive only, rather than as definitive (with a high degree of accuracy). That is because exported goods are often composed of various components, which may be produced almost anywhere—their value often originates from many places. For example, a heavy truck exported from Wisconsin will contain manufactured parts and materials from other plants or production sites located in other states in the Midwest or in different regions of the country; such components for the truck may even originate from outside the United States. Moreover, the truck’s value is also composed of services such as research and development, design, and headquarters/administrative services—any of which may take place across a wide geography. For these reasons, the export orientation of the broad Seventh District (Midwest) economy, relative to that of any particular state, is the more important point to be taken from these data. Geoff Hewings and his co-authors have demonstrated that Midwest states (and their plants and businesses) trade intensively with one another in producing final output, such as global exports. Accordingly, we can be fairly sure that many of the manufactured exports from states in the region are made up of “value added” originating somewhere in the broader multistate region, if not the specific state to which its entire value is assigned.
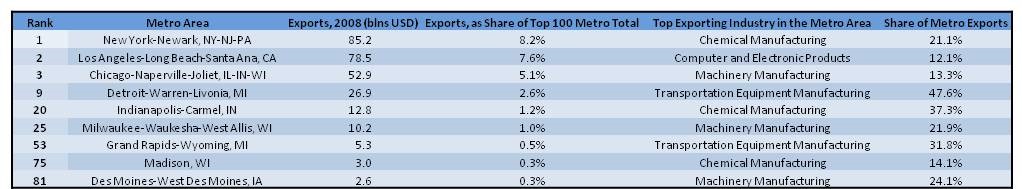
The same point holds true for recent estimates that attribute exports to metropolitan areas. A current Brookings Institution study reports that ”metropolitan areas produce 84 percent of the nation’s exports, making them the points of leverage for scaling up trade with the wider world. The 100 largest metropolitan areas alone account for over 64 percent of the nation’s exports, including 75 percent of its service exports.” For Seventh District metropolitan areas, the table below extracts data from that report. According to these measures, four of the District’s metropolitan areas rank within the top 25 nationally: Chicago, Detroit, Indianapolis, and Milwaukee.
The ultimate destination of exports by metropolitan area is also reported (by the International Trade Administration). For example, in 2008, Canada remained Chicago’s and Indianapolis’s top export destination, but the number two and three destinations differed. For Indianapolis, France and Germany claimed the number two and three spots; for the Chicago area, Mexico and India claimed the next two spots.
Table 2. Exports by metro area
As the nation moves beyond the profound economic disruptions of the past few years, it seems likely that the emergent economy will differ in important ways. Throughout the past decade, the Seventh District’s economic production has been shifting toward goods destined for overseas markets. Currently, the District’s export orientation in manufactured goods is at least on par with that of the nation—and even more so with respect to agricultural production. An accelerated shift in the United States toward producing goods for overseas markets would likely have a large impact on much of the Seventh District’s economic base. In addition to its agricultural prowess, the District’s manufacturers produce important capital goods that are in high demand as world trade and developing economies expand.
Table 3. 7th District exports by industry categories, states — 2009, level of exports ($millions)
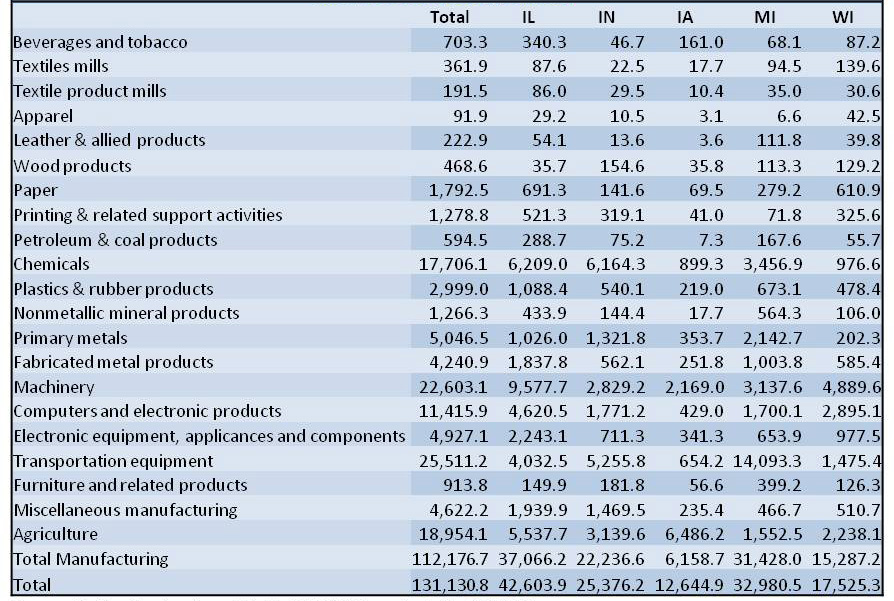
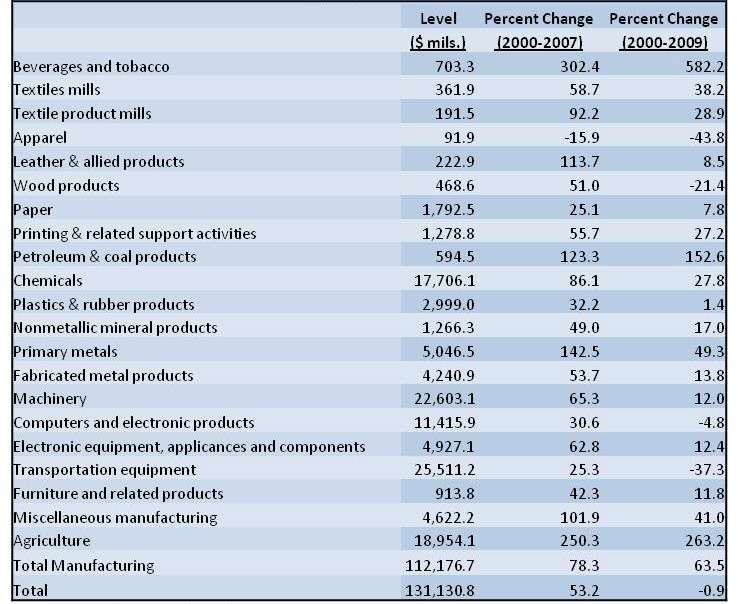
Table 4. Seventh District exports by industry categories — 2009, origins of exports
Footnotes
1 We also adjust manufactured exports using the U.S. Department of Agriculture’s agricultural estimates. Many food products, such as milled grain and oils, are otherwise counted as manufactured.
2 Chicago Fed Research Department staff estimates.


