State population growth: What does it tell us about the states in the Seventh Federal Reserve District?
The degree to which a state’s population has grown can tell us a lot about that state’s economic conditions and prospects. Many U.S. households move very far to find a better quality of life. They seek not only more sunshine and recreational amenities, but also higher income and wages, more employment opportunities, and better housing affordability. Local public leaders and businesses care deeply about population growth. Lately, such concerns focus on possible loss of highly educated “knowledge workers,” who help drive local economic growth. More generally, a decline in population in a local area can create difficult problems in public infrastructure. If a state’s population shrinks unexpectedly, many public services and facilities, such as roadways and water and electricity infrastructure, are not easily reduced in scope or size. And if current population estimates hold up through the end of 2010, national political representation is likely to shift. In particular, the Seventh Federal Reserve District states of Michigan, Illinois, and Iowa could each lose one seat in the House of Representatives.
The U.S. Census Bureau recently released its state population estimates through mid-2009, with a breakdown of population change. The Seventh District comprises all of Iowa and most of Illinois, Indiana, Michigan, and Wisconsin; of these five states, Michigan alone is estimated to have experienced a decline in population between July 1, 2008, and July 1, 2009.1 This marks the fourth year in a row, beginning with 2006, that Michigan has had that distinction. Michigan also lags every state in the nation in cumulative growth since 2005. Michigan has cumulatively lost 121,000 people over the period 2005–09.
Table 1. Population change
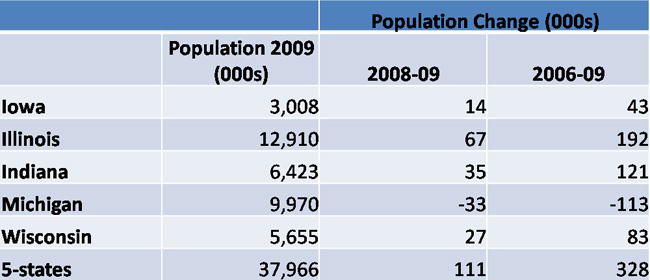
The “natural increase” in population, namely, births minus deaths, is typically the largest component of year-to-year population change. But the states’ different migration trends can tell us the most about their relative attractiveness. A state’s “net domestic migration” measures how many people come in from other states to live there versus how many residents leave for other states. In the table below, it’s clear that all five Seventh District states experienced domestic out-migration in 2009. This has been their typical experience over the past decade. Only Indiana experienced any years of positive domestic net migration during the decade (over the period 2006–08).
Table 2. Net migration
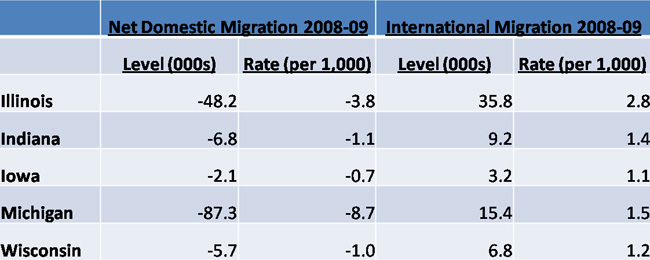
Converting net domestic migration to a rate of migration (per 1,000 residents) helps us to scale these figures relative to the size of each state. Here, Michigan’s rate of domestic out-migration easily outweighs the other states’, though Illinois’s is also quite high. For 2009, Illinois’s rate of domestic net-migration, at -3.8 residents per thousand ranked 46th in the nation; Michigan ranked 50th.
Illinois and Michigan differ greatly in the degree to which net foreign in-migration offsets domestic out-migration. Illinois’s net gain of 36,000 individuals through foreign in-migration in 2008–09 offset virtually three-fourths of the state’s domestic out-migration. In contrast, for example, Michigan’s net foreign in-migration offset only 15 percent of the state’s domestic out-migration. According to demographer William Frey, states having important “gateway” cities for immigrants, such as Chicago, are especially advantaged in this regard.
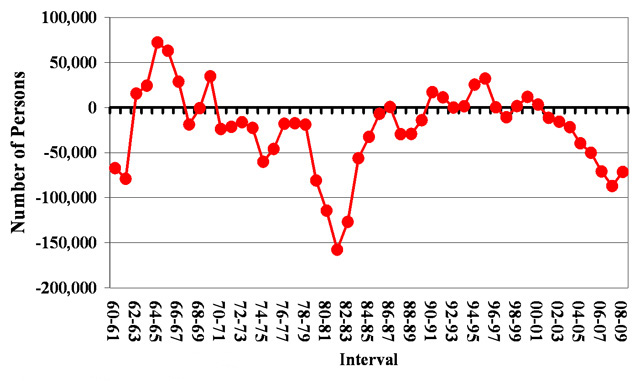
Surprisingly, even though Michigan’s economy has foundered over the past decade, the state’s pace of domestic out-migration held steady rather than climbed in 2009. Michigan’s state demographer, Kenneth Darga, has carefully documented the state’s demographic trends over many years, including net migration back to 1961. As seen below, net out-migration during the early years of the 1980s easily outpaced those of recent years. By way of possible explanation, in comparison to today, there were more states back then having labor market opportunities that unemployed Michiganders found attractive, compelling them to move away. Recall that some energy-producing states, such as Texas and Louisiana, were then faring well; and other states were benefiting from surging national defense expenditures and a technology boom in personal computers and related equipment and software.
Chart 1. Total net migration: Michigan, 1960-2009
Other explanations have been offered. Demographer Frey and others note that the overall U.S. domestic migration rate has been declining; it is currently at its lowest point since such statistics have been reported, back in the late 1940s. Americans are less likely to move far away from their current homes for economic opportunities out of state, as both average age and homeownership rates have climbed. Michigan—with 76 percent of its households being homeowners—does have among the nation’s highest rates of homeownership. At the same time, because of its flagging economy, the share of Michigan homes whose current market value exceeds the size of the mortgage debt on the property is also among the highest. In contemplating a move to another state in search of employment, some of these Michigan households may find themselves too cash-constrained to finance job searches outside the state. That is, even if they managed to sell their homes and move away, they would likely need to pay off the remaining balances to their homes’ existing mortgages.
Footnotes
1 Among all 50 states, only Michigan, Maine, and Rhode Island lost population year over year over this time period.


