Chicago’s Center Leads the Way?
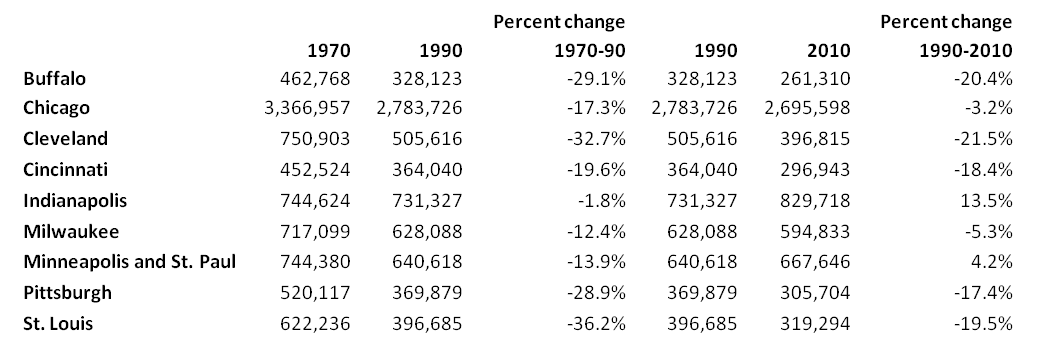
As central cities go in the Midwest, the city of Chicago is often held up as exceptionally successful, having experienced something of an economic renaissance since 1990. Much like other Midwest central cities, Chicago suffered acutely from population and manufacturing decline accompanied by sharp suburbanization during the 1970s and 1980s. The city’s population declined 10.7 percent during the 1970s and another 7.4 percent during the 1980s, which amounted to a population loss of 583,000 over the two decades. But a population turnaround unfolded in the 1990s when Chicago enjoyed a population gain of 4.0 percent—the first such gain since the 1950s. The trend proved to be short-lived, however, as the recent decade 2000-10 took back 6.9 percent of Chicago’s population.
Table 1. Population in central cities
Despite such mixed success, Chicago does stand out somewhat among large metropolitan areas in the Midwest region, boasting several elements of marked improvement since 1990. For one, the city has attracted a population of educated, mostly young, working adults. Owing to in-migration, the city’s 25-34 year old population now has a higher four-year college attainment rate than the suburbs. Residential neighborhoods in the city (and the downtown itself) have especially shifted toward young and college educated households, who have invested heavily in housing and housing rehab. In the process, Chicago’s manufacturing orientation has transformed to service jobs in the business services, finance, education, and health care sectors.
One indication of Chicago’s strengthening core can be seen by comparing the central city’s unemployment rate with that of its surrounding suburban area. Typically, owing to the tendencies of the urban poor to reside in some central city neighborhoods, average central city unemployment tends to exceed suburban averages in large U.S. metropolitan areas. As seen below, this also holds true for the Chicago area.
However, the unemployment rate of the city of Chicago has been converging with that of the greater metropolitan area since 1990 (below). In the early 1990s, the city’s unemployment rate exceeded the metropolitan area’s by over 2 percentage points. By the end of last decade, the gap had narrowed below a single percentage point.
Chart 1. Chicago city unemployment rate minus metropolitan area (12-month moving average)
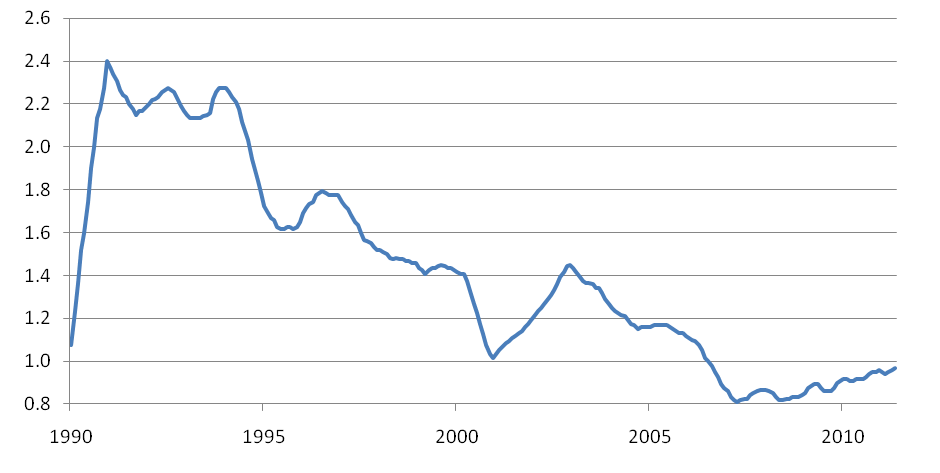
Unemployment rates are measured for survey respondents according to where they live, not where they work. Accordingly, given the gains in educational attainment among those who live in the city, it is not so surprising to also find improvements in unemployment rates.
But what about the city of Chicago as a place to work? Has Chicago’s central city been providing increased employment opportunities? Data on payroll employment and wage income are available by zip code area, though the coverage excludes government workers and several smaller industry categories.
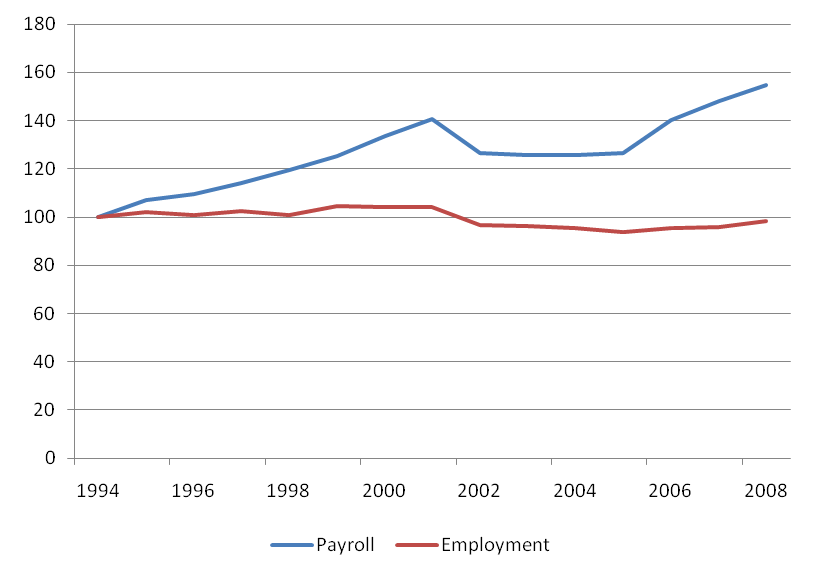
The chart below indexes payroll employment in the entire city from 1994 to 2008 (red line).1 While job counts have been flat within the city boundaries, income generated by available jobs indicates steep earnings gains, possibly reflecting a more highly skilled or at least more highly compensated job composition. Price-adjusted average payroll earnings per employed worker have climbed very steeply since 1994–by over 50 percent by 2008! (blue line).
Chart 2. Chicago payroll employment
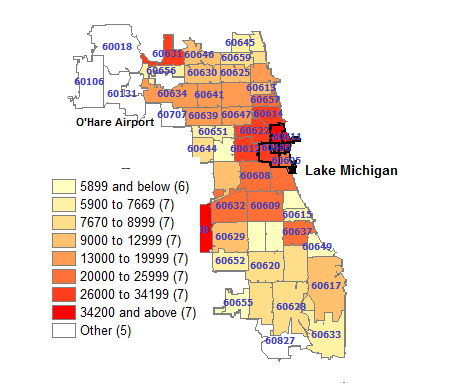
On further inspection, as it turns out, gains in both payroll employment and in payroll earnings have been confined to Chicago’s central area while, on average, both jobs and payroll have declined over the same period in the outlying city area. The charts below contrast the central area with the outlying city neighborhoods; the map that follows provides employment detail by zip code area within the city of Chicago. Aside from strength at the core, job growth is evident on the Northwest side as one nears O’Hare Airport.
Chart 3. Chicago's central area
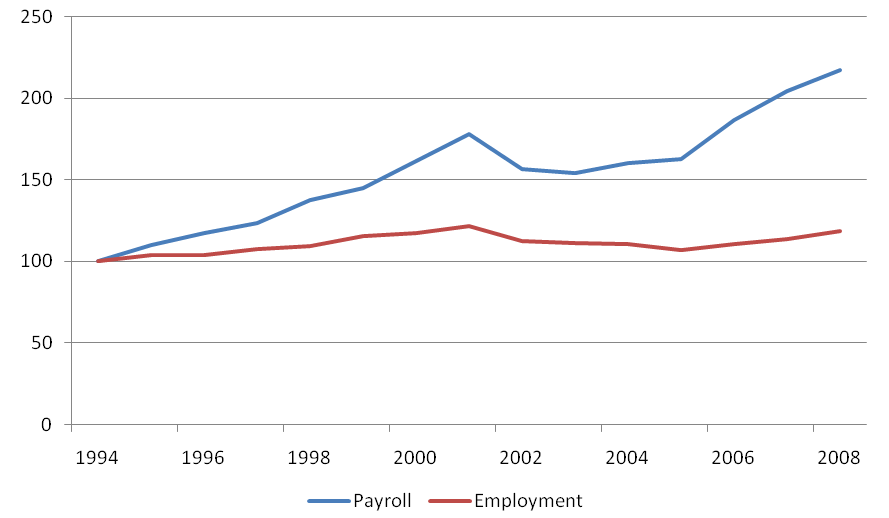
Chart 4. Areas outside of Chicago's central area
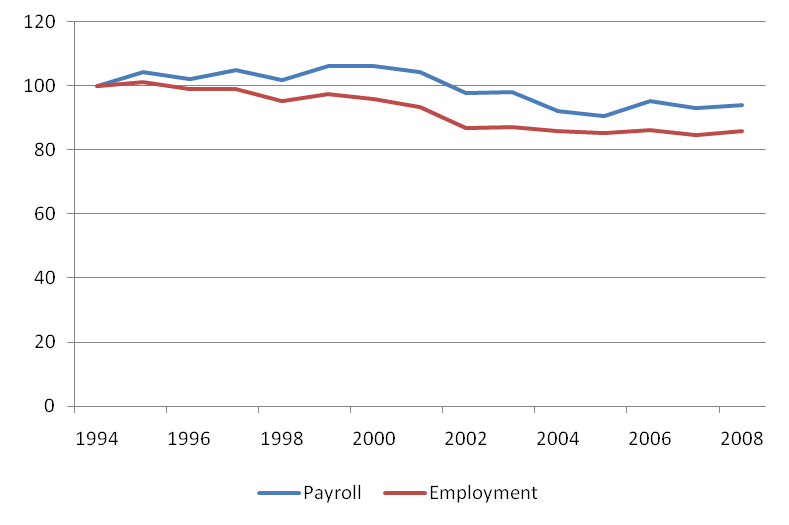
Chart 5. Payroll jobs by zip code
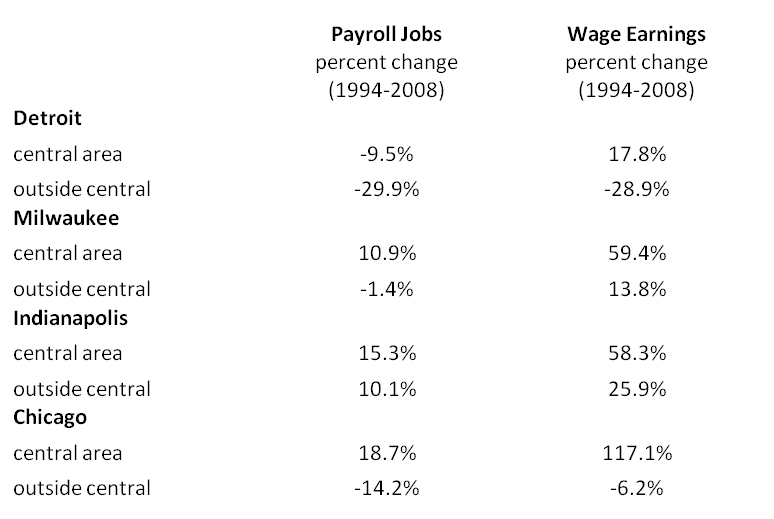
In examining the four large central cities of the Seventh District, the central areas of the other three—Detroit, Milwaukee, and Indianapolis–have also generally outperformed their outlying city neighborhoods as both job and income-generating domiciles. However, in the case of central city Detroit, outperformance has still meant a 9.5 percent job decline over the period. The Milwaukee and Indianapolis central areas have performed better in this regard, though they have underperformed Chicago.
Table 2
Source: County Business Patterns.
Central areas of large Midwest metropolitan areas continue to hold promise in contributing to the redevelopment of their broader city and metropolitan area economies. Led by Chicago, the central areas have been generating significantly more earnings from a moderately growing payroll job base.
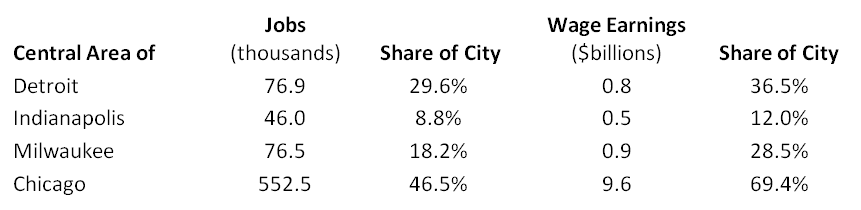
Table 3. Payroll jobs and first quarter income in central area 2008
Note: Thanks to Wenfei Du and Norman Wang for assistance.
Footnotes
1 Source: U.S. Department of Commerce, Bureau of the Census, County Business Patterns.


