Understanding the Seventh District and U.S. Economies with Purchasing Managers’ Surveys
Purchasing managers’ surveys—often referred to as purchasing managers’ index (PMI) reports—provide timely information about the economy. In these monthly surveys, manufacturers are asked about their own purchases and their company’s supply chain. More specifically, manufacturing purchasing managers are asked about the directional heading of their businesses’ key indicators, such as new orders, prices, inventory levels, employment, and delivery time. In constructing the PMI, a survey response of “up” is given a value of 1; an answer of “no change” is worth 0.5; and a reply of “down” is worth 0. Once all the surveys have been taken into account, an index value greater than 50 equates to expansion of the manufacturing sector, a value of 50 means there was no change, and anything less than 50 is associated with a contraction in manufacturing. The further a reading is from 50, the more significant the increase or decrease in manufacturing.
Purchasing managers’ surveys cover manufacturing activity from a variety of geographic areas. Among such surveys, the U.S. and Chicago Institute for Supply Management (ISM) Reports on Manufacturing—released at or near the beginning of each month—are viewed as leading indicators of economic activity. It’s natural for PMI reports to be considered leading economic indicators both because the data are timely and because many manufacturing indicators are generally regarded as leading economic indicators. Manufacturing activity often leads the overall economy because of the durable nature of many of the sector’s goods. Inventories can be costly to hold, so that an unexpected buildup of inventories can prompt companies to halt production activity to bring inventories back into line with sales. Consumers, too, may slow their pace of purchases of durable goods like cars and appliances in response to a dimming outlook for income or jobs; when their incomes become impaired, households do not want to be caught with such durable goods, which can be difficult to convert into cash.
PMIs are especially telling in the Seventh Federal Reserve District where manufacturing is more important to economic growth as compared with the U.S. as a whole. For example, 13% of all Midwest nonfarm payroll employment is classified as manufacturing in the year to date. Nationally, manufacturing only accounts for 8.9% of total nonfarm payroll employment. The Midwest derives 11.2% of its personal income earned from manufacturing as opposed to a 7.2% share for the U.S. Arguably, the strongest sector since the start of the U.S. economic recovery in July 2009 has been manufacturing. And because of the stronger manufacturing presence in the Seventh District, we have benefitted from the recovery more than other states and regions. The individual PMI reports throughout the Seventh District support this assertion.
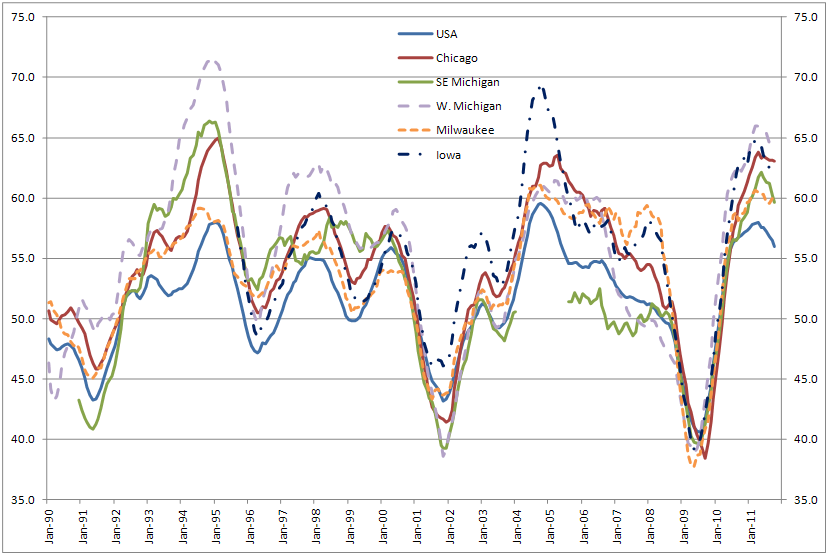
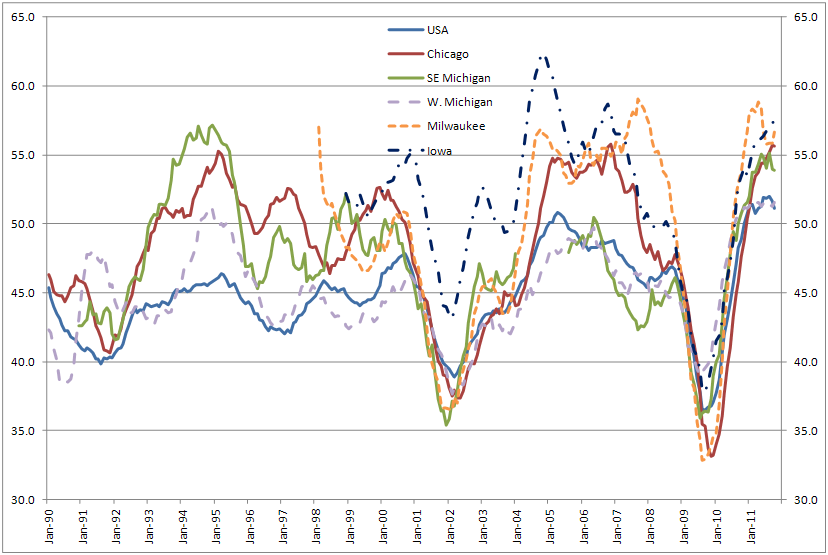
Chart 1 below shows the U.S. and Seventh District PMI reports—which are compiled for Chicago, southeastern Michigan (Metro Detroit), western Michigan (Grand Rapids, Kalamazoo, Holland), Milwaukee area, and Iowa. The chart constructs a 12-month moving average for each PMI report to resolve seasonal adjustment issues. The data go back to 1990, with the earliest PMI data found for Iowa as of 19941. As indicated, the PMI readings generally peaked at the end of 2004 or the start of 2005. From 2005 until the start of the recession in December 2007, manufacturing continued to expand throughout the Seventh District, but at a slower rate; the lone exception was southeastern Michigan, which was impacted by the early stages of auto industry restructuring. Once the recession began, the deceleration in manufacturing activity intensified and became widespread, with PMI readings within the U.S. and the Seventh District falling below 50 during the onset of the financial crisis in the second half of 2008.
According to the National Bureau of Economic Research, the Great Recession ended in June 2009. Looking at Chart 1, the 12-month moving averages of the PMIs bottomed out at or around June 2009. The Chicago economic area noticeably lagged the U.S. and the other Seventh District indexes by a couple of months. Since then, PMI readings have rebounded well above 50, indicating a strengthening manufacturing sector. This is especially so in the Seventh District where PMI readings are at least 4 points higher than the U.S. PMI number.
1. U.S. and Seventh District PMIs: Total
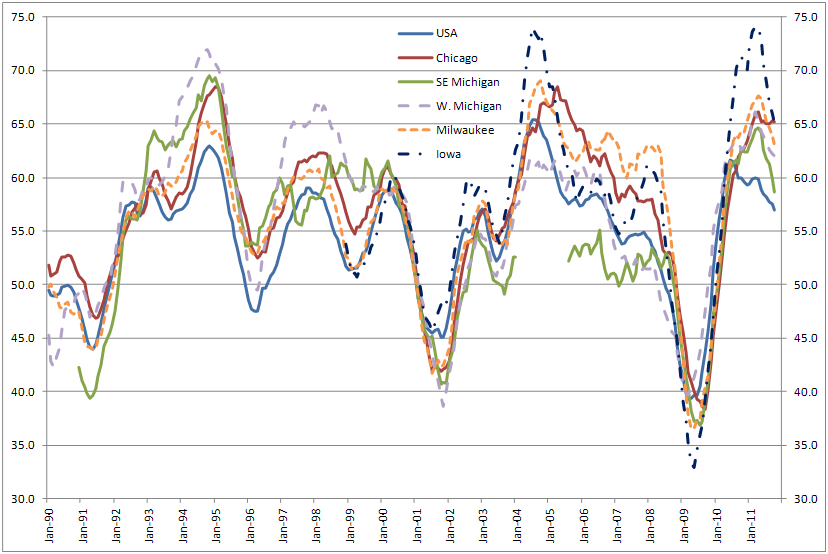
In isolating the “new orders” component of the PMI surveys below in Chart 2, one tends to see more accentuated swings in manufacturing business cycles. As indicated by survey responses on new orders, the most dramatic dip and ensuing rebound occurring during the most recent recession and its aftermath took place in Iowa, with readings approaching 75 during the recovery phase. All Seventh District PMI new order readings are currently above the U.S. number, indicating that the pace of manufacturing expansion is stronger here relative to the rest of the nation. Additionally, the ongoing rebound in light vehicle sales and business spending on equipment and software bode well for the Seventh District, since there’s a higher concentration of those industries present in the Midwest.
2. U.S. and Seventh District PMIs: New Orders
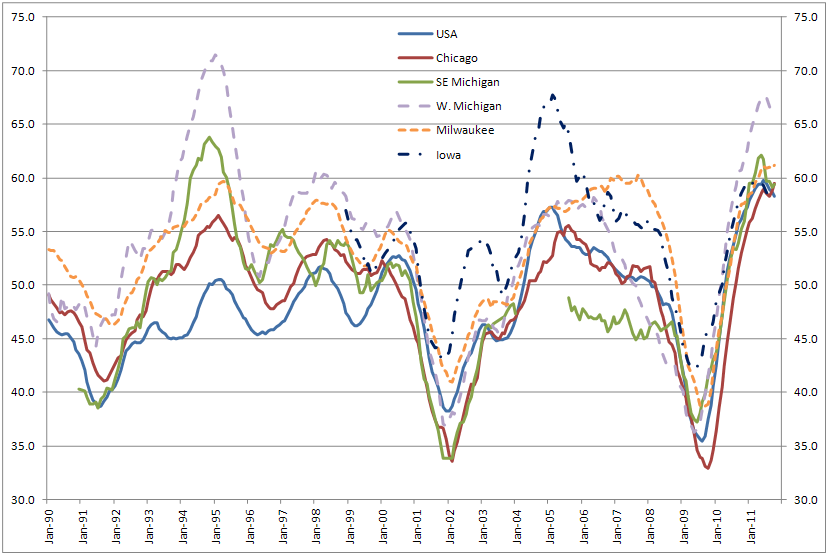
Movements in manufacturing activity are often accompanied by swings in the sector’s employment and income. As of October of this year, manufacturing employment is up 2.4% in the Midwest over last year—higher than national employment growth in manufacturing, which was 1.9% October-over-October. A specific employment component of the PMI is reported. PMIs indicate that the pace of employment expansion has been substantial, with PMI readings of around 60 or above. At the sub-regional level, a rapid pace of hiring has been taking place, especially in western Michigan. A striking feature of Chart 3 below is that southeastern Michigan’s manufacturing sector experienced nine years of job losses because of the protracted contraction in the domestic auto industry before beginning to add jobs in 2010.
The rebound in manufacturing employment has contributed to the Seventh District’s unemployment rate falling faster from its peak than the U.S. unemployment rate. The Seventh District unemployment rate is currently 9.3%, down from its peak of 11%, and just above the current U.S. unemployment of 9%.
3. U.S. and Seventh District PMIs: Employment
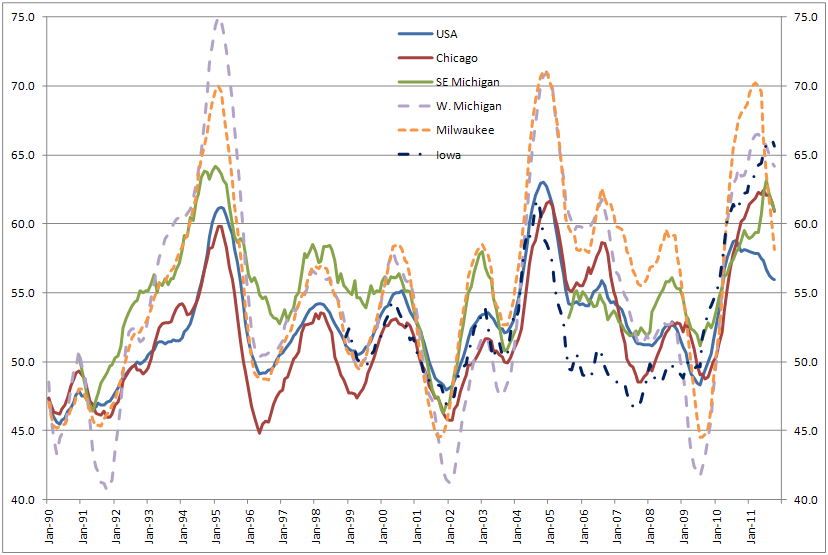
When looking at the “supplier deliveries” component of PMI surveys below in Chart 4, a reading above 50 indicates a slowing in the delivery of supplies to (other) manufacturers2. Delivery times have recently increased as longer lead times have developed for commodities, especially those coming from areas in Asia affected by last spring’s Japanese earthquake and tsunami, as well as the recent flooding in Thailand. Since the incidence of delays in obtaining materials from suppliers has increased, the supplier delivery number is currently higher than at the beginning of 2011. Longer lead times bring into question the supply chain’s ability to respond to a robust increase in consumer demand that would require a significant increase in capacity utilization.
4. U.S. and Seventh District PMIs: Supplier Deliveries
During the economic recovery, inventory levels rebounded strongly throughout the Seventh District, as Chart 5 displays. But the pace of adding to inventories has now slowed, along with the overall pace of economic growth. As the economy accelerated early in 2011 according to the initial gross domestic product (GDP) reports, so did inventories in order to satisfy consumer demand. But as economic growth has slowed to a modest pace at best, with early 2011 growth being revised downward, inventory levels have become leaner, reflecting some of the uncertainty and lack of confidence present among consumers as they assess their household budgetary situations and prospects. Inventories are currently lighter on the retail side this holiday season in anticipation of a modest increase in the pace of sales relative to last year.
5. U.S. and Seventh District PMIs: Inventories
In looking over the PMI reports from various Seventh District locations, one notes that the current readings indicate a manufacturing sector that continues to expand at a faster pace relative to the U.S. as a whole. As the national economy recovers from the Great Recession, the Seventh District economy is rebounding—in some respects ahead of the national economy—largely because of the region’s high concentration in manufacturing production of durable goods. If the current PMI trends hold, one could realistically expect that economic growth in the Seventh District will rival, if not exceed, the nation’s economic growth in the remainder of 2011 and into 2012.
Footnotes
1 In addition, the earliest southeastern Michigan report was found in January 1990, but there’s a break in the data during 2004 when responsibility for the report switched over from the National Association of Purchasing Management and Comerica Bank to the Institute for Supply Management.
2 Prior to May 2011, a supplier deliveries index above 50 percent in the Milwaukee PMI indicated faster deliveries, and below 50 percent indicated slower deliveries. Milwaukee’s supply delivery index number in Chart 4 has been adjusted to reflect the other supplier delivery indexes by subtracting the index number from 100 prior to their change in methodology.


