What’s Behind the Seventh District Resurgence?
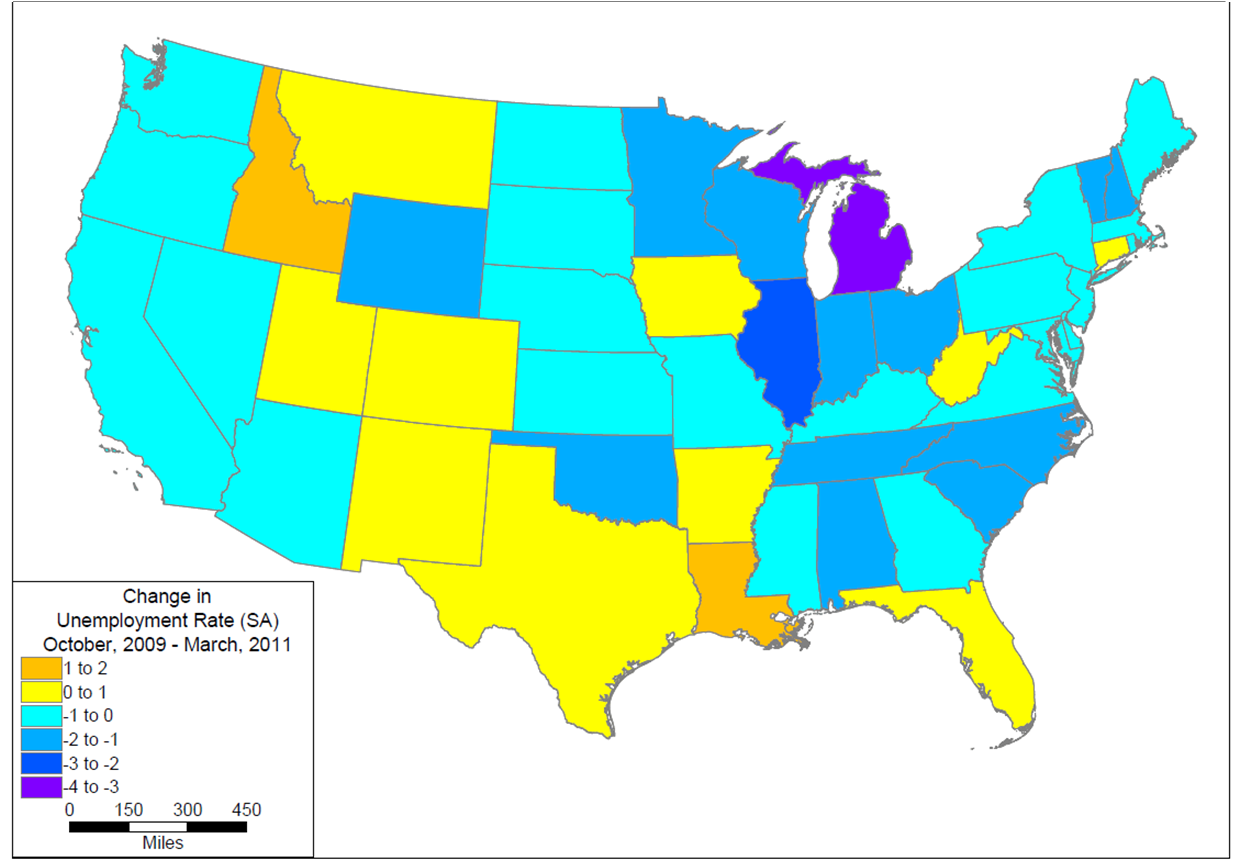
Fame and fortune can be fleeting, but over the past year the Seventh District has been leading other U.S. regions in the pace of economic recovery. It is not so much that economic conditions are better here. Rather, it is that the pace of improvement has been quicker. As the map below illustrates, unemployment rates have fallen most rapidly in Michigan, followed by Illinois, and in quick succession by Indiana and Wisconsin.
Map 1. Change in unemployment rate
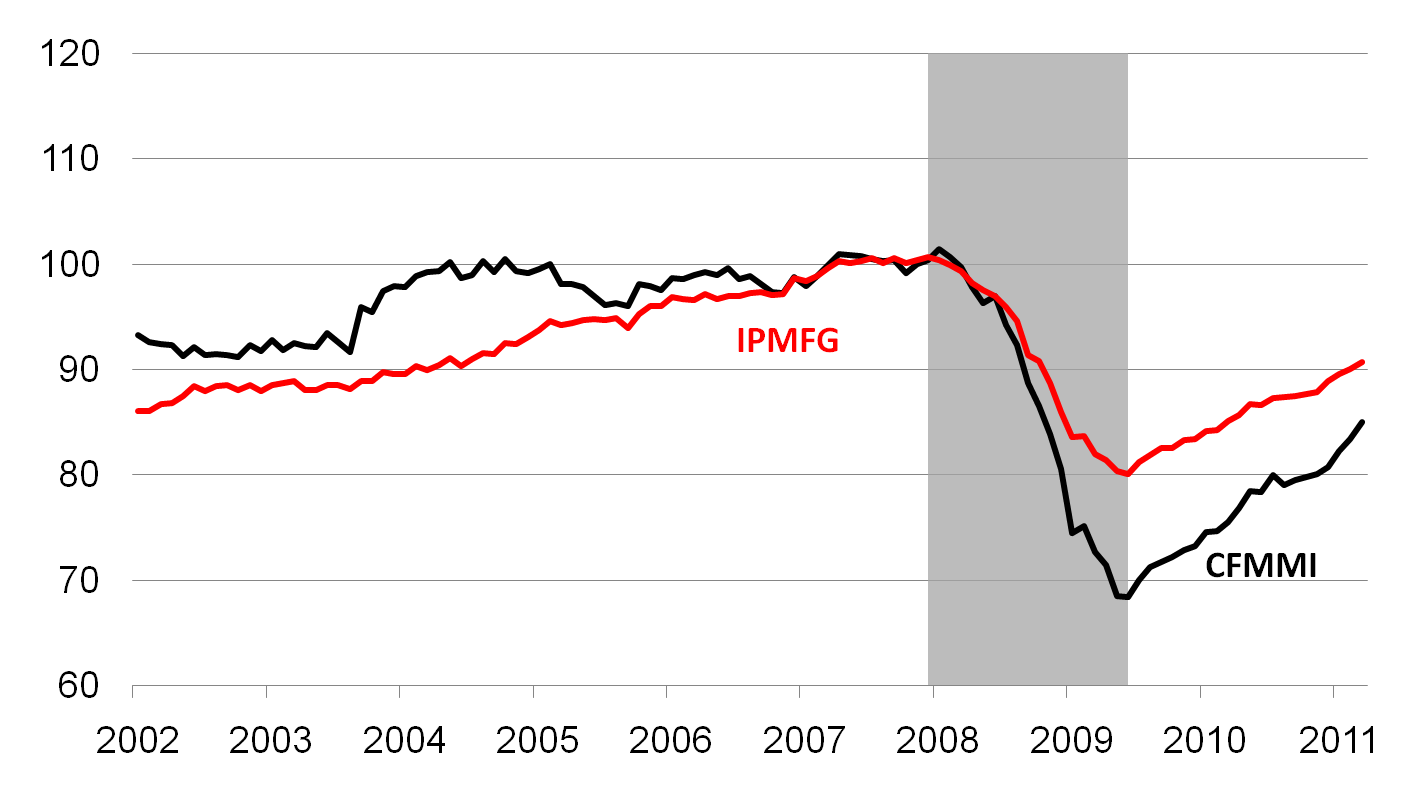
The rebounding District economy is being pulled along by its two hallmark goods industries—agriculture and, especially, manufacturing. The manufacturing output recovery has far exceeded overall output growth in both the nation and the District. Since the District’s manufacturing concentration exceeds that of the nation, this unbalanced recovery has exerted an outsized effect on the District economy. Moreover, output gains in the Seventh District have outpaced those in the U.S. manufacturing sector overall. The chart below compares U.S. industrial production to its regional counterpart, the Chicago Fed Midwest Manufacturing Index. From their respective troughs in mid 2009, the IPMFG has gained 14.2 percent and the CFMMI has gained 24.2 percent. Jobs in the manufacturing sector have also been rebounding from deep lows. From the first quarter of 2010 to the first quarter of 2011, the District states of Michigan, Wisconsin, and Indiana, in that order, have led all other states in net job growth in the sector.
Chart 1. Manufacturing production through March 2011 (index, 2002=100)
The fact that the District’s manufacturing has outpaced that of the nation during the expansionary period is not surprising, since the District’s industry composition is highly concentrated in the most cyclically sensitive sectors, such as automotive, primary metals, and basic machinery. Prominent automotive companies GM and Chrysler underwent bankruptcy-like events during the recent recession, in which their production activity dropped severely. Afterward, during their rebirth, these companies have ramped up rapidly to rebuild depleted inventories.
More generally, the process of rebuilding inventories has spurred manufacturing production activity. Inventory-rebuilding is somewhat typical during economic recoveries. At the low point of this past recession, as businesses began to raise their forecasts of national economic growth, they began to rebuild their inventories in earnest in order to meet anticipated product demand for both consumer products and business equipment. Since the trough of the recession in mid 2009, inventory rebuilding has contributed an average .93 percentage points to the growth rate of U.S. GDP. This contribution from inventory rebuilding amounts to one-third of total realized GDP growth from mid 2009 through the first quarter of 2011.
Realized sales of manufactured goods have also benefited District manufacturers of both business equipment and consumer durable goods. The annual pace of U.S. sales of business fixed investment in “equipment and software” have averaged over 14.1 percent so far during the economic recovery. Prominent District producers in this category include makers of farm, mining, and construction machinery, medical equipment, and electrical machinery such as engines and turbines.
Among consumer goods manufacturers that are highly concentrated in the District, the automotive assembly and parts makers are experiencing rapid growth in sales. From annual sales of 10.4 million light vehicles in 2009, the annualized pace of vehicle sales have averaged over 13 million over the first four months of this year. In response, light vehicle production in the U.S. climbed almost 73 percent from the first quarter of 2009 to the first quarter of 2011.
Chart 2. U.S. Light vehicle S.A.A.R.
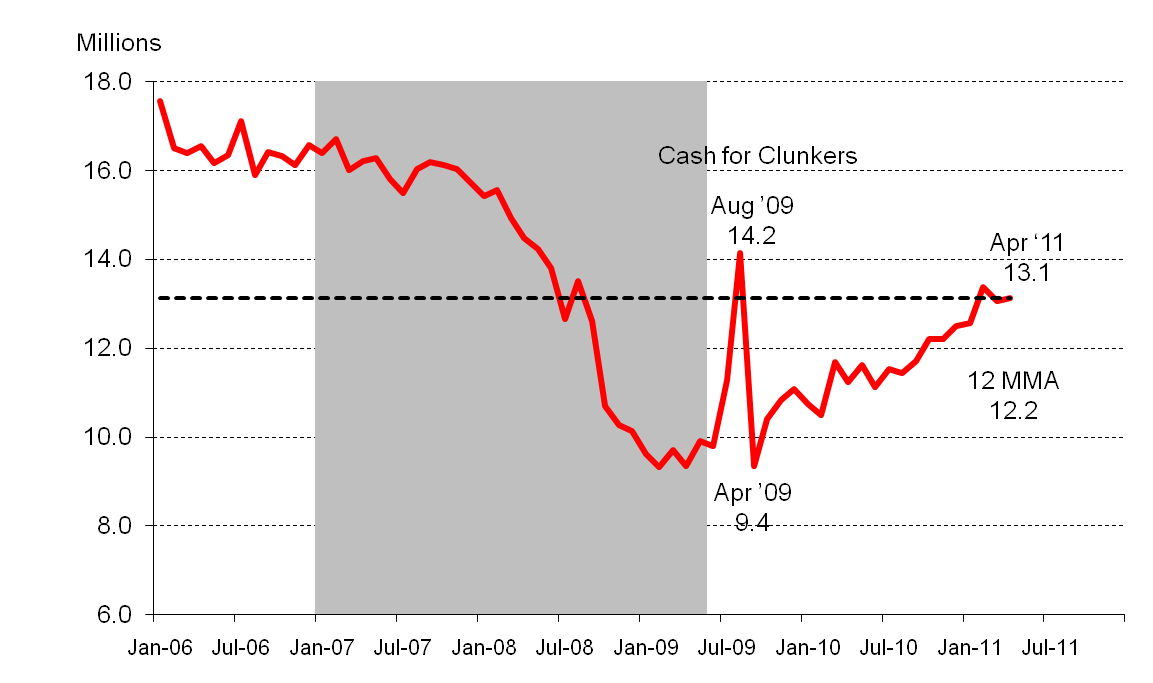
Analysts see more room for growth in domestic light vehicle production and sales. The scrappage rate of the “automotive fleet”– vehicles now on the road– has been running very low so that, according to Detroit Branch Business Economist Paul Traub, the average age of the automotive fleet has been rising since 2000. As the existing fleet wears out, demand for new vehicles will grow. In addition, the age and quality-adjusted price of used cars is running high in comparison to prices of new vehicles due to both the slow pace of new vehicle sales since 2008 and the 2009 “Cash for Clunkers” program, which took used cars off the road.
A revival in U.S. exports abroad is a third leg that underpins the manufacturing resurgence in the District. U.S. exports abroad grew strongly from 2004 to 2007 as world GDP growth averaged 5.0 percent per year. 1 However, during 2008 and 2009, world trade fell dramatically due to the global financial crisis and evaporating availability of credit to finance imports and exports. According to a recent article by Senior Economist Meredith Crowley, “ ….in April 2009, the world economy appeared to be in a free fall. Global trade in goods and services had fallen 15.8 percent over the final two quarters of 2008 and first quarter of 2009. This world trade collapse had been the largest three-quarter decline of the past 40 years.”
Led by economic recovery—principally in Asia and Latin America—world growth and trade recovered sharply in 2010 and into this year, supporting a recovery in U.S. exports. Over the seven quarters of the U.S. economic recovery since mid 2009, export growth has contributed an average 1.25 percentage points to annual output growth.
Exports of manufactured goods have also rebounded in the District. The District exports capital goods, heavy machinery, and medical and transportation equipment needed by developing countries as they build their own economies. The District’s overall export orientation in manufacturing is very similar to the nation’s, and it has recovered similarly as well. The five District states experienced 48 percent growth in manufactured exports from the first quarter of 2009 through the first quarter of 2011 versus 38 percent for the U.S. Barring any unforeseen stumbles to the expected and continued pace of world economic growth, exports should continue to support economic expansion in both the District and the nation.
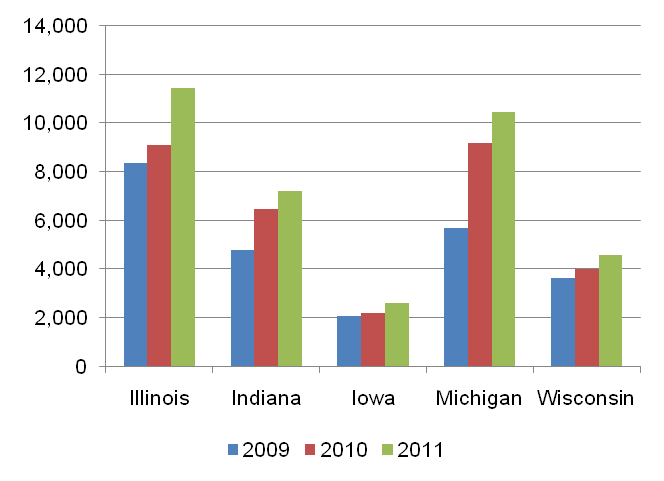
Table 1. Exports in the first quarter ($millions)
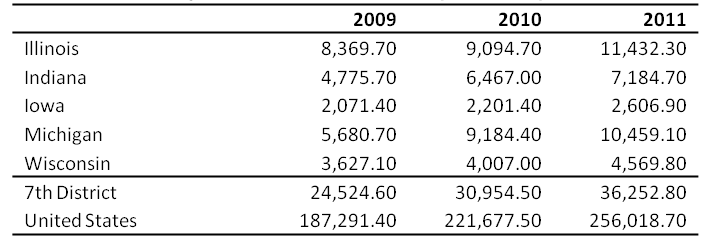
Chart 3. Exports in the first quarter ($millions)
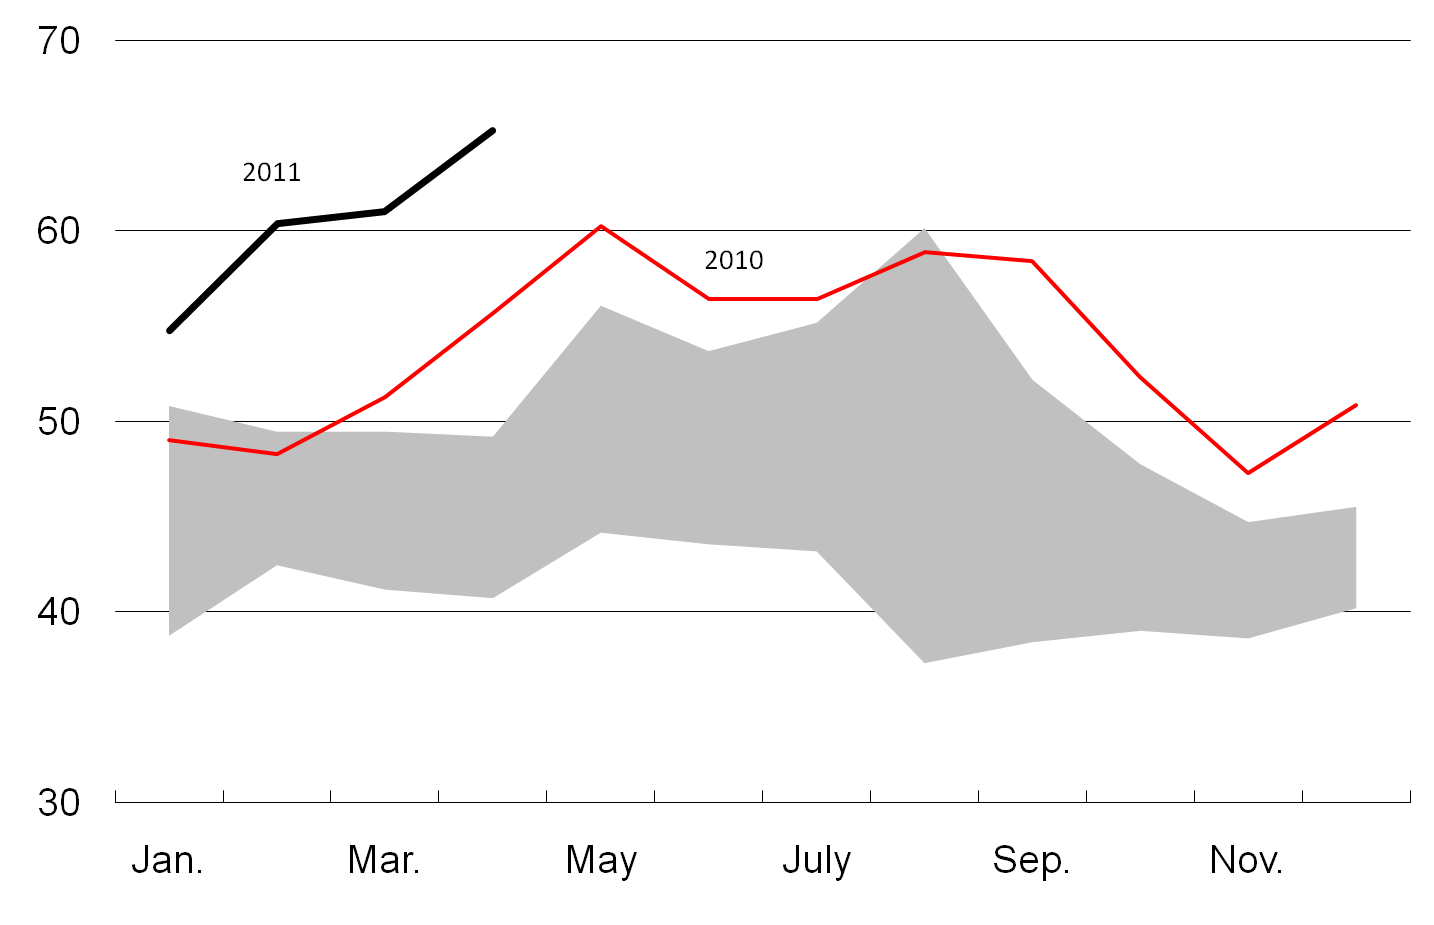
The District’s primary agricultural sectors have also contributed mightily to economic recovery. So far in 2011, both corn and soybean prices are trading well above 2010 and well above their previous 5-year ranges. Milk and hog prices are also trading at prices above their previous averages (below).
Chart 4. Corn prices (dollars per bushel)
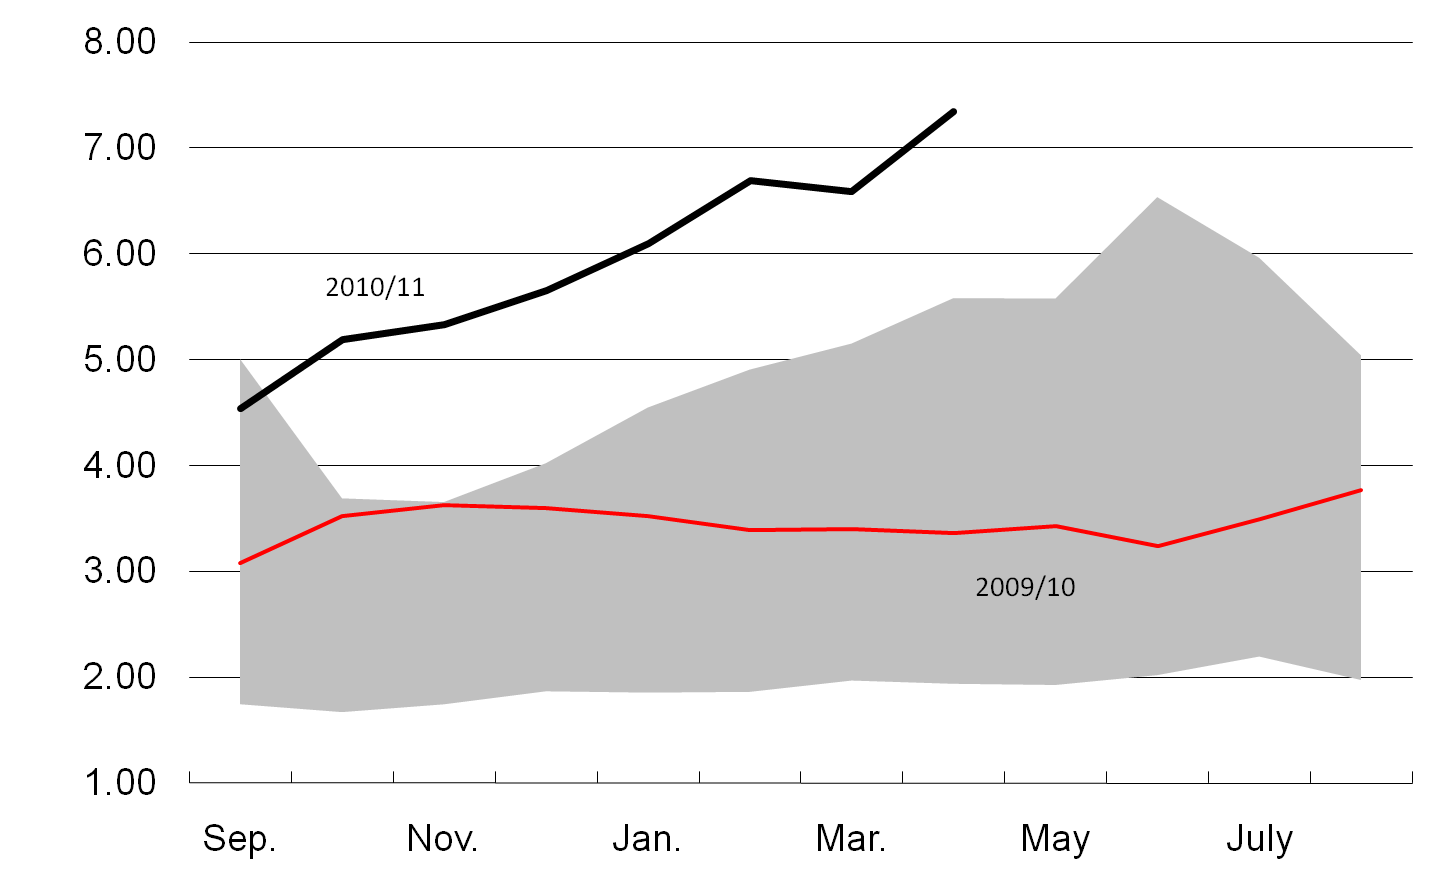
Chart 5. Soybean prices (dollars per bushel)
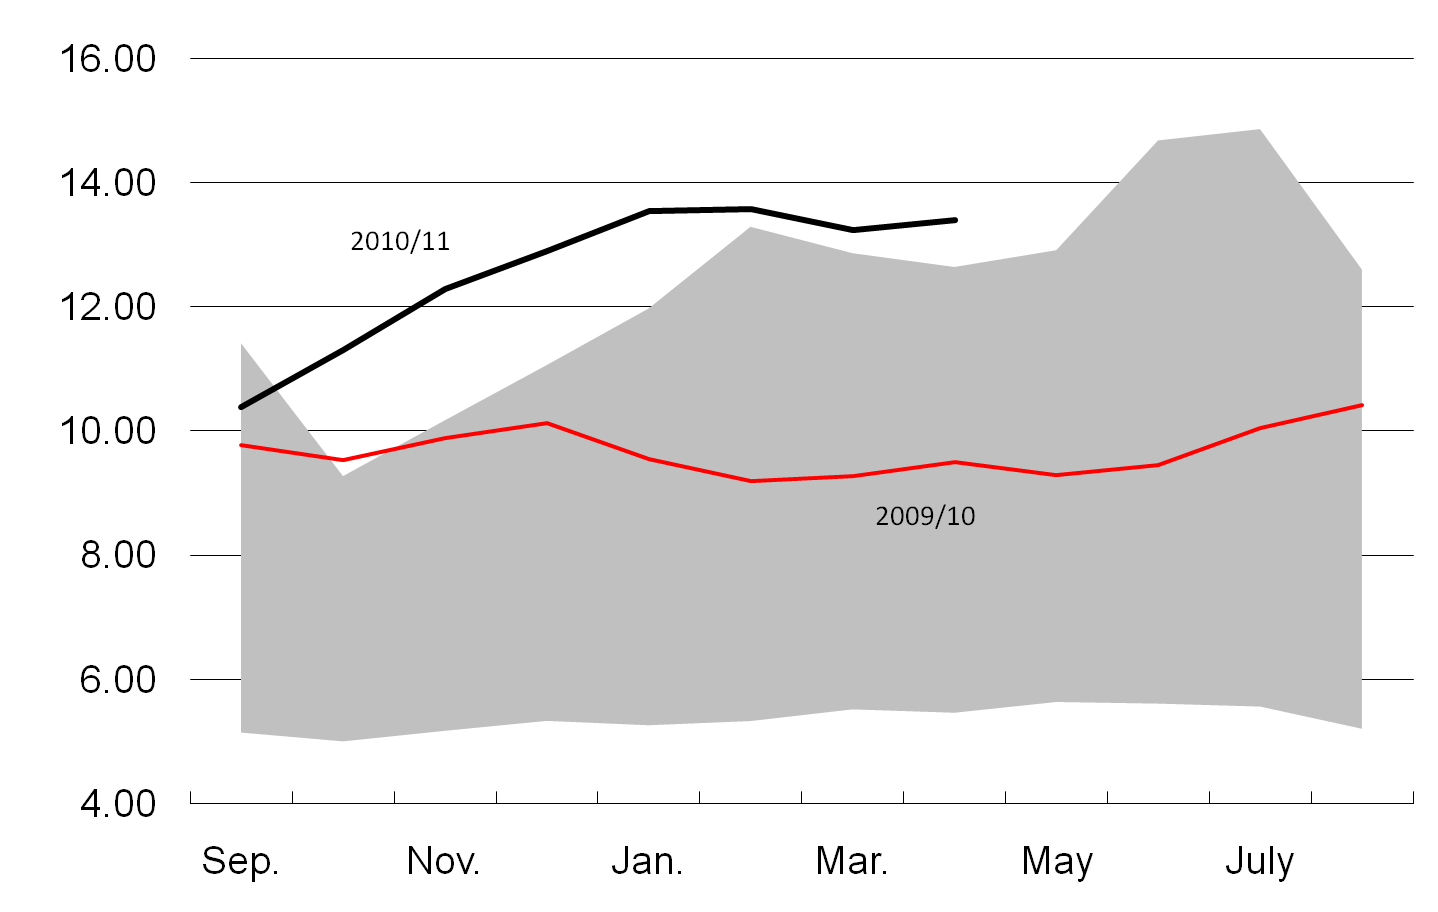
Chart 6. Milk prices (dollars per cwt.)
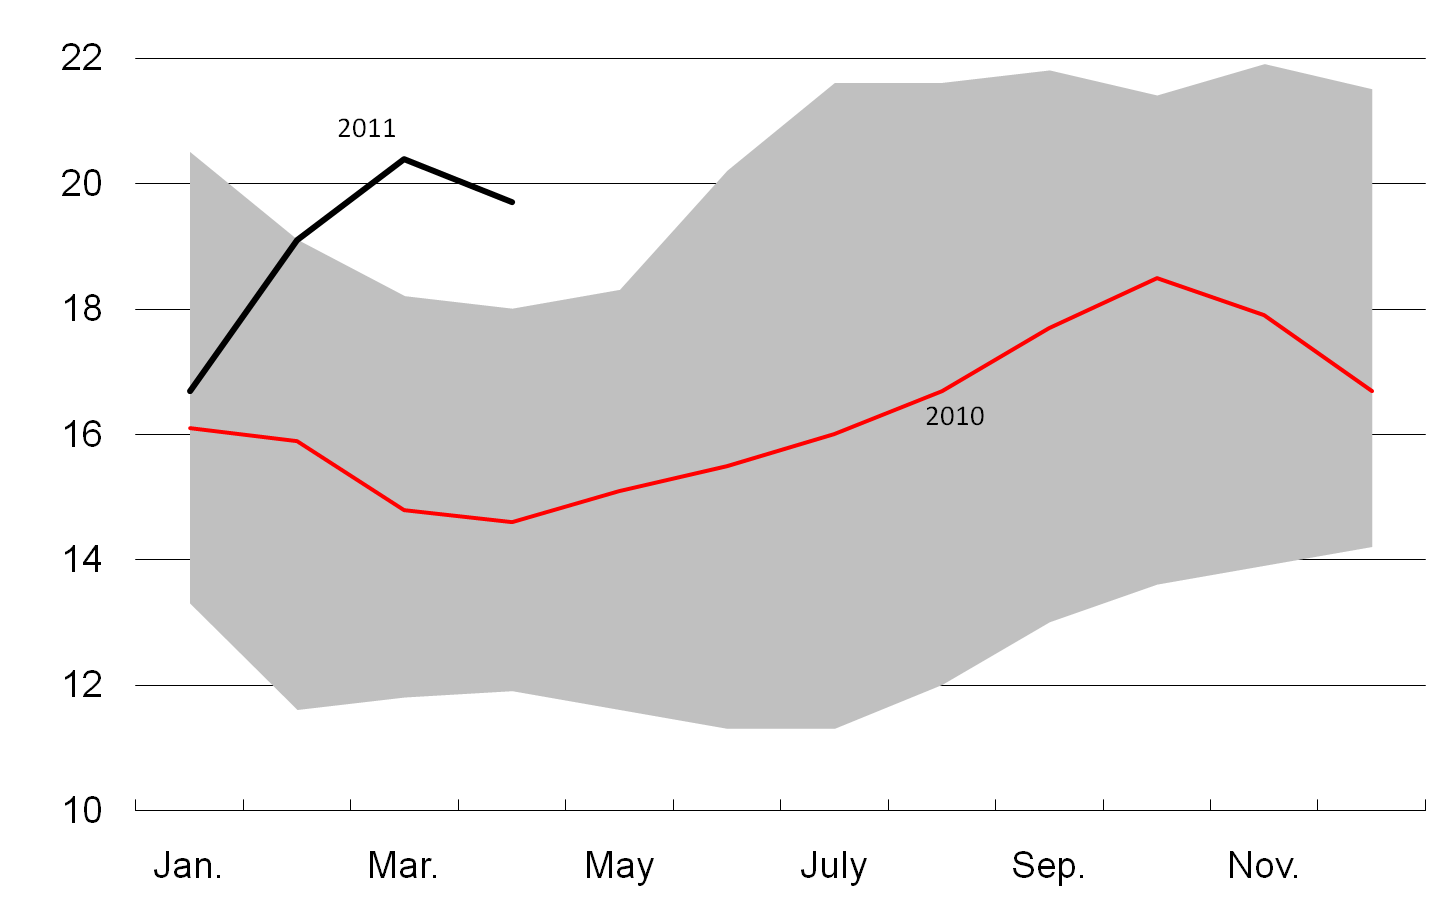
Chart 7. Hog prices (dollars per cwt.)
Production of both corn and soybeans has climbed over the decade, especially corn. Corn usage in meeting production mandates of ethanol fuels has especially spurred both the volume of corn planting and its price. Exports of soybeans and related products have responded to rising global demand, especially in Asia. These developments have acted to lift farm-related incomes and jobs, as well as purchases of farm equipment and traded prices of farmland. As reported by Dave Oppedahl in the AgLetter “At 16 percent, the year-over-year increase in farmland values in the first quarter of 2011 for the Seventh Federal Reserve District was the largest since 2007 and was last surpsassed in 1979.” As also reported, domestic sales of harvesting equipment and large tractors have shown strong gains over the past two years.
One dark cloud has been the cold and wet spring of 2011, which has delayed planting, thereby threatening this year’s crop yields and production.
Table 2. Unemployment rates
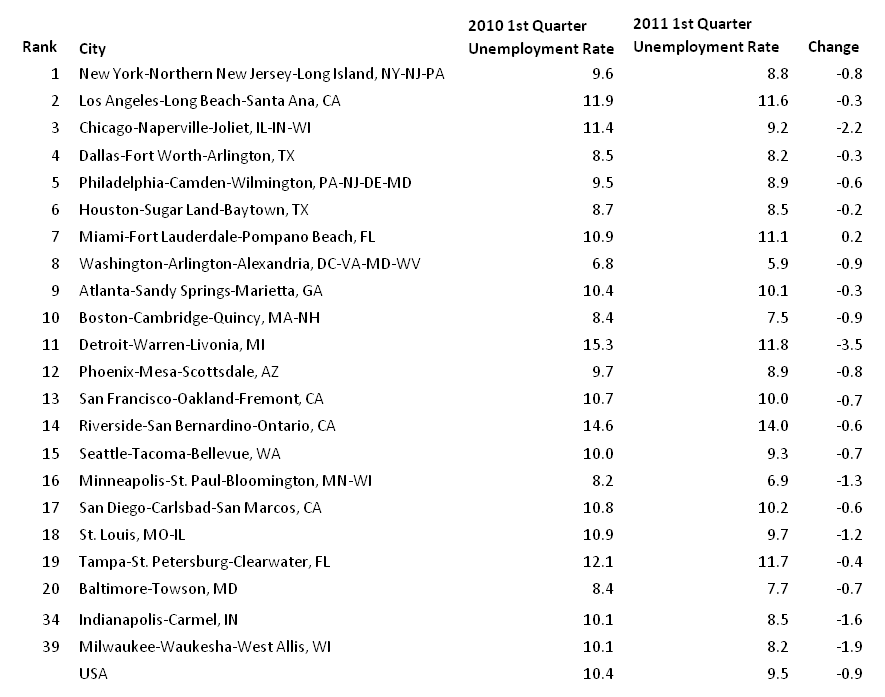
While it is clear that goods-producing sectors are driving the District’s economic gains, it is also significant that labor market improvement are concurrently taking place in service-oriented metropolitan areas. Much like other large MSAs, Chicago’s employment composition is not highly concentrated in goods-producing sectors—at least not directly. However, among the 20 most populous MSAs, Chicago’s unemployment rate declines have been among the most precipitous, declining 2.2 percentage points year over year versus .9 percent for the nation (below). Here, the surrounding region’s goods-producing activity has apparently lifted Chicago area business and professional services employment, as well as its leisure and hospitality sectors. Similarly, service-oriented Indianapolis experienced declining unemployment rates of 1.6 percentage points. Meanwhile, those Seventh District metropolitan areas that serve as both financial-service hubs for their surrounding regions and as manufacturing centers in their own right also saw significant unemployment rate declines. The Detroit MSA recorded a 3.5 percentage point decline; Indianapolis MSA a 1.6 percent decline, and the Milwaukee MSA, a 1.9 percentage point decline.
What’s ahead for the Seventh District economy? Much, but not all, of the recent resurgence derives from transitory causes. In particular, the marked U.S. growth rebound from the deep recession to a modest expansion has lifted inventory building of durable goods. But as inventory accumulation returns to normal, this element of growth in demand will ease off. In a similar vein, the return to robust world economic growth is expected to continue, but not accelerate. Accordingly, manufacturing exports will continue to grow, though perhaps at a more subdued pace. Similarly, domestic U.S. demand for manufactured goods and capital equipment is expected to continue but not to greatly accelerate. However, domestic demand for light vehicles to replace the aging U.S. fleet is thought to hold promise for expansion.
The current period of strong prices for farm commodities is being watched with caution by market participants. As developing countries supplement their diets with U.S. farm products, export demand will continue to support farm prices. However, farm commodity prices are also notoriously volatile as they are buffeted by climate events related to surprise crop failures or successes round the world.
Footnotes
1 IMF, April 2011.


