Global Services and Midwest Prospects
Many have highlighted the importance of increasing foreign purchases of goods produced in the United States as a path to economic growth. In 2009, President Obama called for a doubling of U.S. exports of goods and services within five years, accompanied by the announcement of a National Export Initiative. So far, this goal remains reachable. Since the economic recovery began in mid-2009, U.S. exports have grown at a robust annualized average of 9.1 percent.
The economic recovery and accompanying export growth have been good news for the Midwest. As an important goods producer of both exported manufactured and agricultural products, the region has benefited from enhanced income and economic activity.
But goods are not the only possible exports from the United States. In a series of papers and a recent book, economist J. Bradford Jensen asserts that we should be emphasizing services rather than manufactured goods in assessing and promoting the nation’s export prospects. Further, the United States is particularly suited to export knowledge and skill-intensive services, much as it does manufactured goods of that nature. These would include business and professional services, such as accounting, software, management, public relations, advertising, R&D (research and development), construction, architecture, design, and specialized financial services.
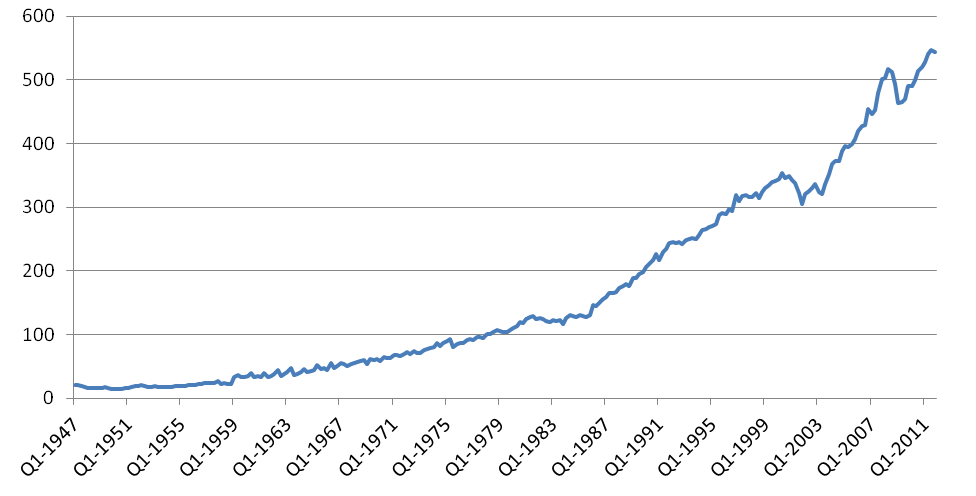
As shown in the charts, the services share of U.S. exports has been growing—from 19.6 percent in 1980 to 29.3 percent in 2011. And the value of services exports has increased dramatically in the past several decades.
Chart 1. U.S. service exports as a share of total exports (4-quarter moving average)
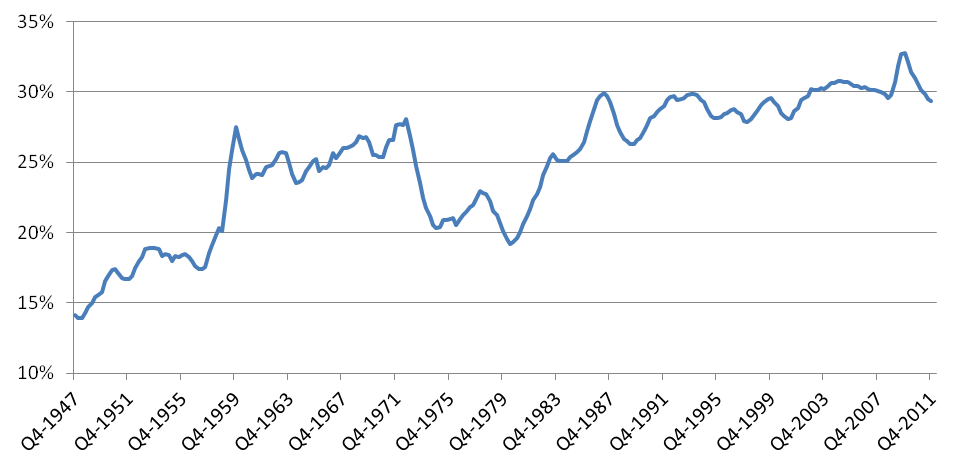
Chart 2. U.S. service exports in billions of 2005 dollars
Source: U.S. Bureau of Economic Analysis.
The extent of data available for specific segments of the services sector has been improving, but it remains inferior to the level of coverage for goods exports. The table illustrates the growth of the specific services exports that are reported by the U.S. Bureau of Economic Analysis.
Table 1. Service export growth
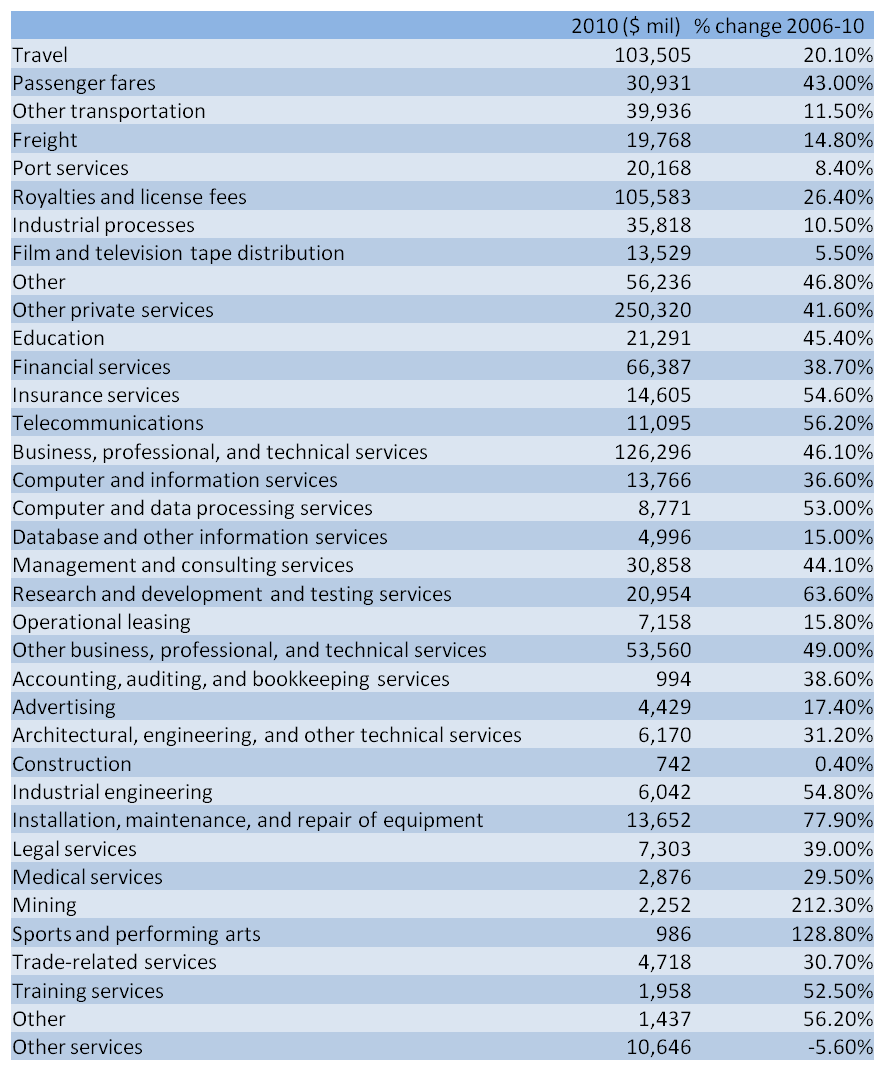
As shown here, many service exports have been growing very rapidly. For this reason, analysts like Jensen find the trends encouraging. The prospects for further export growth in these sectors seem bright, because the U.S. has tended to specialize in manufacturing industries that are also skill intensive, such as capital goods machinery and aerospace. As many developing countries continue to grow, they are likely to need just such skill-intensive services. Because many of these services segments need employees who are highly skilled, further expansion of their U.S. operations to serve growing global markets would create more high-paying jobs and income in the U.S.
Still, it is far from a foregone conclusion that robust export growth will materialize. That is largely because receiving countries have placed many restrictions on services imports, including cumbersome occupational standards and licensing, procurement favoritism by home governments, and limited or inadequate protections on intellectual property, such as patents and invention. As cited by this year’s Council of Economic Advisers, a recent study1 estimated that “the aggregate level of discrimination against services imports in important emerging markets such as China, India, and Indonesia is equivalent to a tariff on these imports of more than 60 percent.” Accordingly, the further opening of global trade in the services arena will require much more international negotiation and agreement.
If services exports do grow markedly in years to come, does the Midwest region have a stake in this growth? If so, it is most likely to be found in the region’s large urban economies. Typically, large city economies have come to specialize in business and professional services. For instance, the Chicago area has been celebrated as a “global city,” in part because of its strong position and linkages in business and professional services, its corporate headquarters of multinational companies, and its world-leading risk contract exchanges and clearing operations.
The still dominant position of Chicago in exchange-traded derivative products is easy to document. Per figures cited by World Business Chicago, for example, Chicago exchanges including the CME and Chicago Board Options Exchange, account for 16 percent of the exchange-traded derivatives activity that takes place around the world.
However, more generally, details on globally traded services are hard to come by. Since data on services exports by individual city are sparse, some researchers have taken an indirect approach to appraising the position of cities in global commercial services. For example, Peter J. Taylor and Robert E. Lang construct city-by-city indexes of global connectivity among the most prominent offices of multinational firms in key services sectors. These service sectors include accounting, advertising, banking/finance, insurance, law, and management consulting. City rankings are constructed by accumulating the size of offices of these prominent firms (if any) in each city. In “Global Network Connectivity,” Chicago is ranks seventh behind Singapore, Tokyo, Paris, Hong Kong, New York, and London. Detroit ranks 85th; and Indianapolis 114th.
In another study, J. Bradford Jensen and Lori Kletzer examine the extent to which specific service industry employment is more concentrated than total employment across metropolitan areas. The notion here is that if, for example, the Chicago area employs more per people (as a share of work force) than the national average, the city’s economy is likely exporting these services. That is, Chicago employs a disproportionate share of workers in financial services not because Chicago area residents consume more financial services, but rather because they work for firms that export financial services to other parts of the nation or the world.
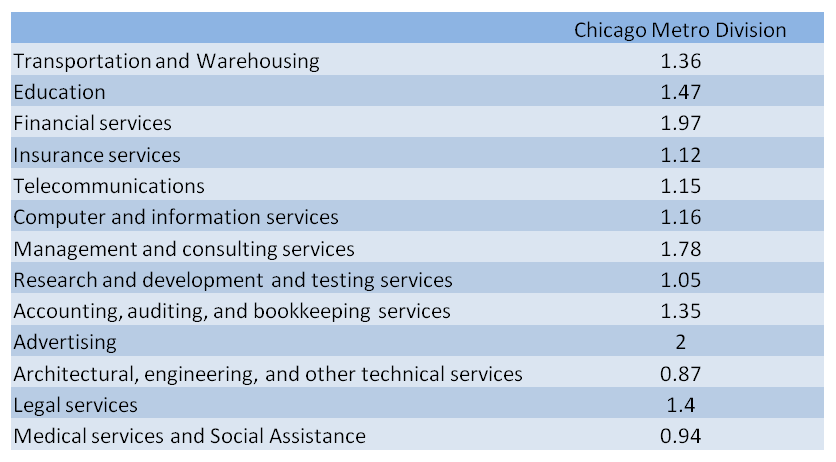
Taking a similar approach, we constructed local area indexes of employment concentration for those service sectors that are reported by the BEA to be internationally traded. The next chart identifies major metropolitan areas of the Seventh District by their employment concentration in these industries. An index value greater than one indicates an employment concentration that exceeds the U.S. average. For example, an index value of 1.20 indicates that the city contains 20 percent more of employment in a particular industry than the U.S. average. In turn, the implication is that those index values greater than one suggest the extent that the metropolitan area exports the service to its surrounding region or elsewhere, nationally or internationally.
Employment data for the core Chicago area are reported with the greatest detail.2 We see that Chicago continues to be a city with many highly skilled industries, such as management consulting, education, and financial services, as well as its more traditional industries, freight transportation and warehousing.
Table 2. Chicago employment data
Such industry detail is not available for other large metropolitan areas in the Seventh District. However, the following table, with data from aggregated employment categories, shows that these MSAs are also highly concentrated in exportable services.
Table 3. Aggregated employment categories

Source: U.S. Bureau of Labor Statistics/Haver Analytics.
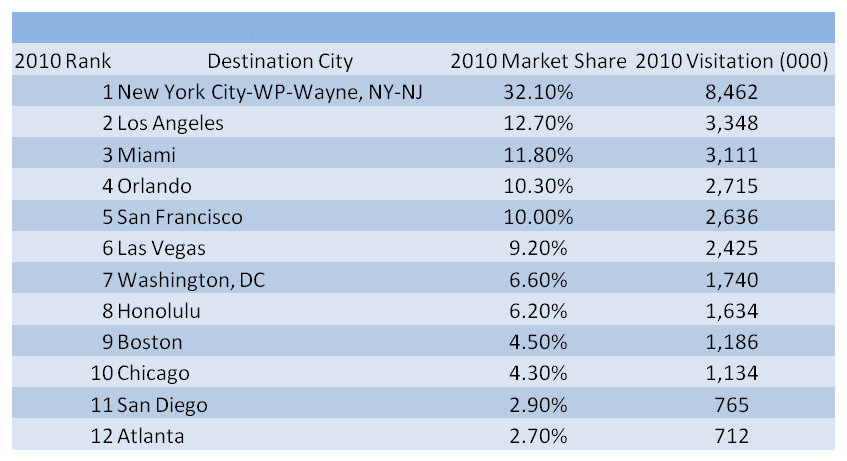
However, such data give us little detail about which particular services are actually exported abroad rather than sold to neighboring cities, states or regions of the U.S. Accordingly, rather than employment concentration by industry, alternative data sources can give us better insights. Tourism is a case in point. During the course of their visits, foreigners spend on travel and local goods and services, which in turn give rise to domestic jobs and income. The table below ranks cities by their international visitors. As seen, visits are highly skewed toward New York City and a handful of other large MSAs. Chicago ranks 10th in 2001 by the number of visitors from abroad, with 4.3 percent of total visits. Still, this is roughly proportional to the Chicago area’s share of national population.
Table 4. Overseas visitors to select U.S. cities: 2009-2010
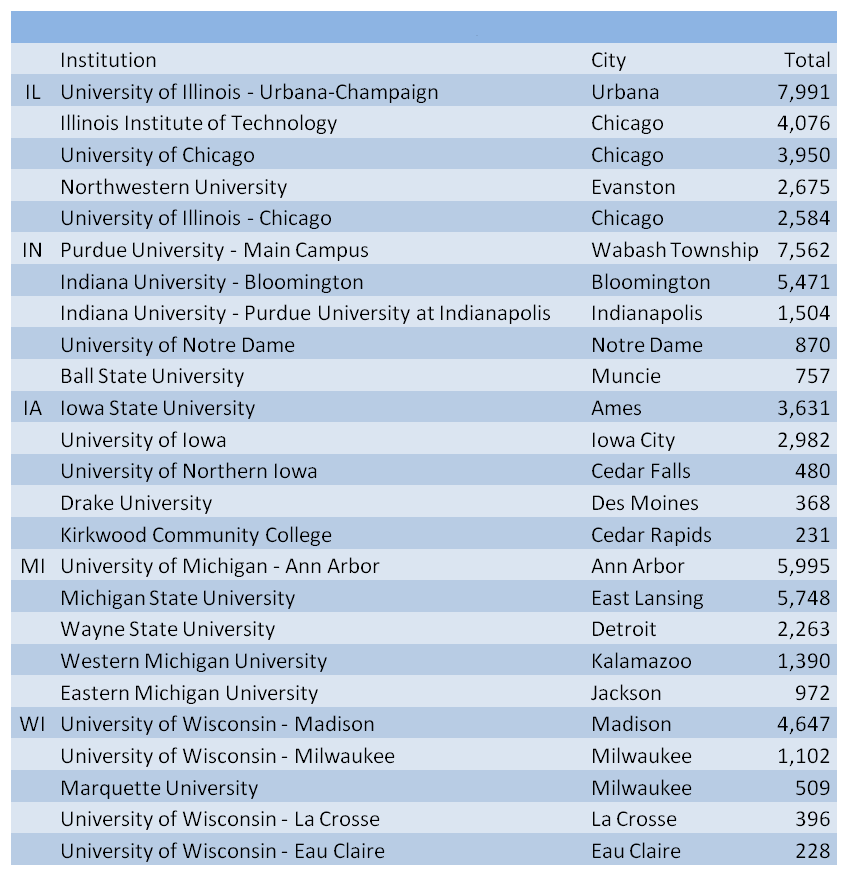
U.S. colleges and universities are a leading service sector on the world stage. In turn, students studying here from abroad generate income for domestic workers and households. Per below, all five District states rank highly in hosting international students. Such students give rise to local income in tuition payments, as well as in local living costs for themselves and sometimes for their family members. In examining the largest individual institutions, we see that these benefits accrue not just to the District’s large metropolitan areas, but also to a number of smaller cities.
Table 5. Number of international students
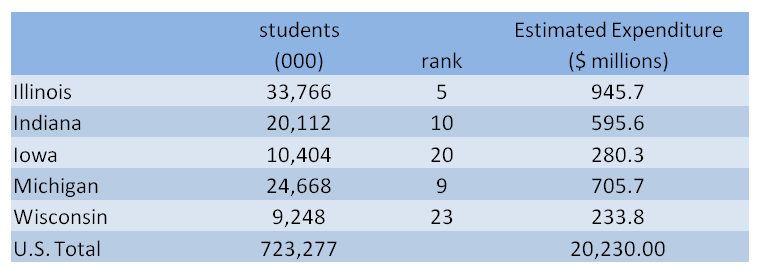
Table 6. Students by institution
In conclusion, the Midwest has long known of its global linkages through exports of manufactured goods and foodstuffs. Perhaps one day the region’s exports of services will challenge the importance of its traded goods. With this possibility in mind, the region will want a voice in U.S. negotiations of global agreements that open up services to trade and protect U.S. services exports from unreasonable obstacles abroad. Closer to home, service-oriented cities of the Midwest will continue re-shape their infrastructure and public services to complement emerging services trade.
Note: Thank you to Norman Wang for assistance.
Footnotes
1 Hufbauer, Gary, Jeffrey Schott, and Woan Foong Wong, 2010. Figuring Out the Doha Round, Washington D.C., Peterson Institute for International Economics.
2 These data are for the Chicago metropolitan division of the Chicago MSA.


