Natural gas and the Seventh District
U.S. energy markets are undergoing significant upheaval because of the surging domestic production of natural gas and accompanying falling prices for this commodity. Enhanced production of natural gas has come about because of technological gains in gas extraction—namely, enhanced techniques for the fracturing of shale deposits and horizontal drilling. One of the main motivations for exploring domestic soil for more natural gas is the climbing prices of petroleum products that the U.S continues to import to a significant degree. If environmental concerns associated with extracting shale deposits can be resolved, natural gas offers an abundant, widely available, and secure energy source in the lower 48 states.
As seen below, wholesale natural gas prices have fallen considerably in recent months. For gas purchased on the spot market (where transactions for gas needed within a matter of days, rather than months, are completed), prices have fallen by over one-half. Unfortunately, though such spot market prices are telling, they do not reflect the ultimate prices paid by end-users. That is because much of the natural gas product is purchased on long-term contracts, whereby the prices do not yet reflect recent production capabilities and output. Equally important, it takes much infrastructure, especially pipeline and storage, to bring the product to the location where it can be productively used. And so, depending on the location of use, and the type of user, natural gas prices vary to a great degree.
1. Natural gas spot prices (Henry Hub)
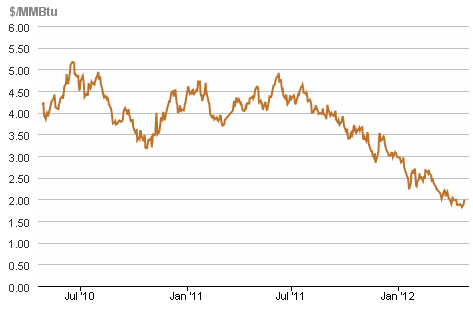
For example, falling prices for natural gas have not helped much in the transportation sector, since existing infrastructure does not (yet) allow much natural gas to replace gasoline and other fuels. However, in other sectors of the U.S. economy, the use of natural gas is much more important. Overall, natural gas accounts for 25% of total U.S. energy use (though petroleum fuels and products are about one-third higher than that).1
Fuel use is changing somewhat, however. Much of the nation’s electric power generating industry burns natural gas in its processes. As a result of the favorable price movements for natural gas, electric power generation has been recently moving away from coal to natural gas. Year-to-date in 2012, for example, purchases of coal by the electric industry have fallen by 4.5%, while purchases of natural gas have risen by 28%.2 The switch to natural gas has helped moderate electricity price hikes to end-users over the past two years. More specifically, electricity price containment has been most apparent among industrial users whose overhead and delivery costs for power have not been so prominent.3
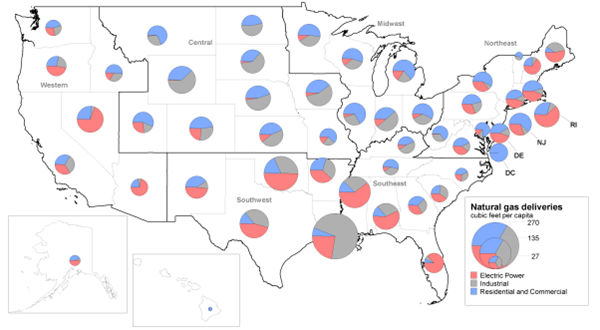
States and regions will be affected differently by swings in fuel prices for a variety of reasons—for instance, their differing economic structures, as well as the particular options of fuels and facilities that their electric utilities and power producers have chosen historically. To illustrate the effects of such differences, the U.S. Energy Information Administration (EIA) produced the map below. The size of the circle denotes the per capita natural gas usage across all uses in each individual state. It is not surprising to find that per capita use of natural gas is very large in those states where it is produced, such as Texas, Louisiana, and Oklahoma. Using natural gas near the point of production saves on the costs of transporting this fuel. And so, for example, since natural gas is used as feedstock in many chemical industries, these facilities have been sited in South Central states to high degree. Moreover, as “shale gas” is increasingly being extracted in several northern climes, certain industries in the plastics and chemicals sectors have begun to follow.
In the same figure, the divisions within each circle show the uses of natural gas within the state—for the generation of electric power, for industrial purposes, or for residential and commercial uses. The last category is principally for space heating of residences and other buildings. Though coal remains the principal fuel for electric power generation, natural gas for this particular purpose figures large in some states of the Far West, South, and Northeast. In the Midwest, natural gas tends to be used for heating residences and other buildings and for industrial purposes. Virtually all states in the lower 48 use natural gas in one or major sectors. States of the Seventh District are no exception, so that favorable developments in the production and delivery of the fuel will be especially helpful in the region’s industrial, residential, and commercial sectors. While District states do not tend to use gas in electric power generation to the same extent as the U.S., even here the District would tend to benefit from falling prices. To the degree that coal and natural gas fuels compete in national markets, falling gas prices and enhanced usage will tend to dampen price pressures on coal as well.
Chart 2. United states natural gas deliveries per capita by state and sector, 2010
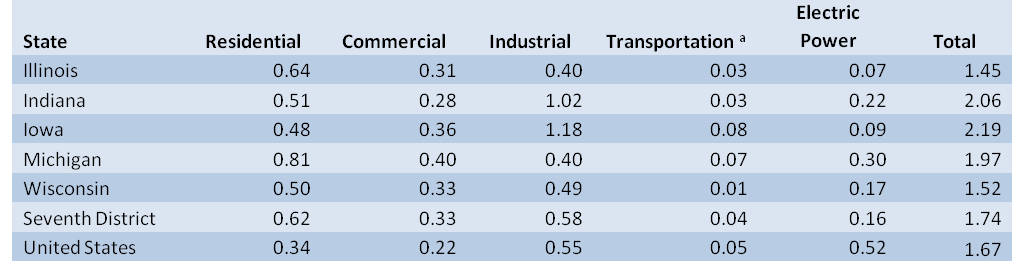
Data from the EIA’s State Price and Expenditure Database offers a finer breakdown of natural gas usage in the Seventh Federal Reserve District, which comprises all of Iowa and most of Illinois, Indiana, Michigan, and Wisconsin. In the table below, natural gas consumption in 2010 is normalized by the size of each state’s gross economic output (GSP). Overall, one can see that the Seventh District economy depends on natural gas to a modestly greater extent than the national average per dollar of GSP. The residential and industrial sectors are the largest natural-gas-consuming sectors in the Seventh District.
In residential and commercial sectors, each state of the Seventh District tends to use natural gas more intensively than the U.S. In contrast, relative to the nation, Seventh District states tend to use other fuels for generating electricity—coal in Wisconsin, Indiana, Michigan, and Iowa and nuclear power in Illinois. On average, the Seventh District’s industrial use of natural gas is on par with the nation’s, though with notable state-by-state differences. For instance, Iowa and Indiana are heavy users of natural gas in their industrial processes.
Table 1. Natural gas consumption GSP ratio, thousands BTU/dollar
Footnotes
1 These data are drawn from the Consumer Price Index for all urban consumers nationally. Motor fuel prices represent prices for unleaded regular gasoline. Home heating fuel price reflects piped gas to residences.
2 These values are reported as measured in physical units. See U.S. Department of Energy, U.S. Energy Information Administration (EIA), 2012, Electric Power Monthly, Table ES2.A.
3 U.S. Department of Energy, U.S. Energy Information Administration (EIA)., 2012, Electric Power Monthly, Table 5.3.


