Recent Energy Price Movements in the Midwest
Households in the region and nationwide have been affected by rising motor fuel prices in recent months; this follows an earlier spike that took place in 2007–08. Such price spikes ordinarily pinch household incomes and spending on non-fuel items. However, at the same time, natural gas prices have been trending downward, thereby providing some relief to household budgets. This is especially true in the Midwest, where most homes are heated with natural gas that is piped in by utility companies. So, to what extent has the favorable trend in natural gas prices been offsetting the unfavorable trend in motor fuel prices?
The chart below displays prices paid by household consumers for both types of fuel1. Prices for both natural gas and gasoline have typically moved in tandem. In many instances, this is because the two fuels are substitutes in several important markets and uses. For example, if either petroleum products or natural gas can be used in applications such as heating industrial boilers or homes, the price of one could not easily fall out of line with the other. If it started to do so, consumers would switch to the cheaper product, thereby raising its price.
1. Residential price index for utility (piped) gas service for motor fuel — SA, 12-month moving average, 1982-84=100
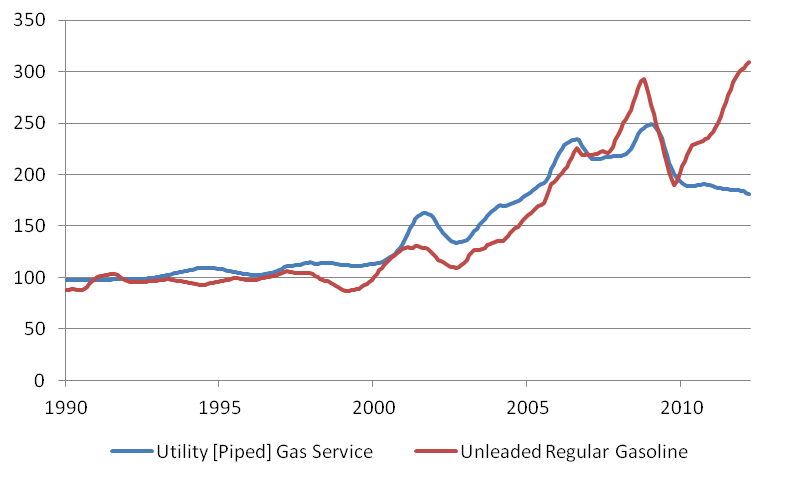
However, in the near term, limits on infrastructure for either transporting fuel or using it can allow fuel prices to diverge. Beginning in 2009, petroleum prices began to climb, largely reflecting its scarcity on world markets. And so, motor fuel prices are up sharply “at the pump.” On the other hand, domestic natural gas tends to be more of a locally traded commodity with little ready adaptability for use in highway transportation. In addition, technological developments in on-shore natural gas production have meant that the available supply has been climbing rapidly. On-shore producers of natural gas have used a combination of hydraulic fracturing of gas trapped in shale rock formations, along with horizontal drilling techniques, to greatly expand U.S. natural gas production since 2005. As a result, natural gas prices “at the wellhead” have fallen to near-record lows in recent months. For instance, the spot market price at a well-known trading point called the “Henry Hub”2 has fallen to close to $2 per thousand cubic feet, far below its average of $5 since 2008.
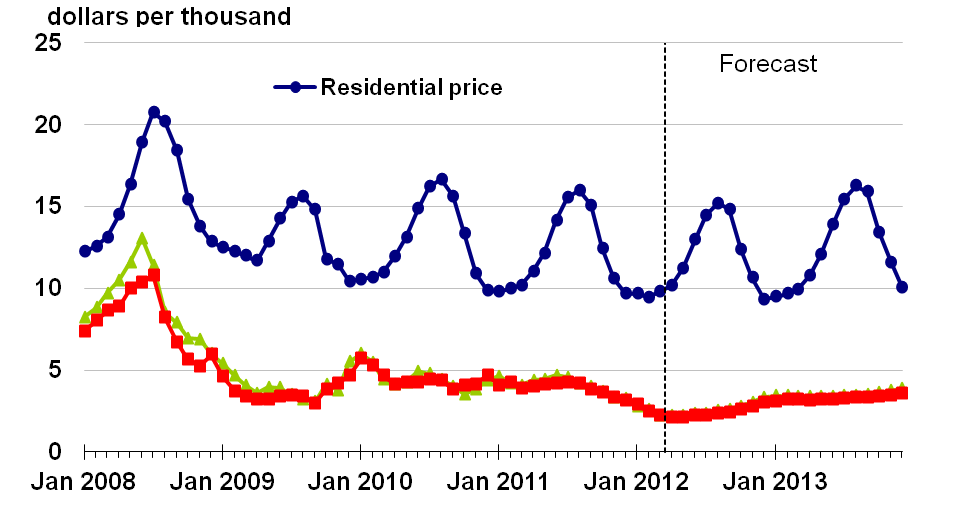
However, natural gas prices for home uses have not fallen nearly so steeply. That is because the price of home heating fuel reflects much more than the fuel price; it also reflects a sizable infrastructure of pipelines (and underground storage systems) that are necessary to deliver the fuel to far-flung residences. For all of 2011, the estimated price of natural gas delivered to residences averaged $10.80 per thousand cubic feet, which was well over 2.5 times the wellhead price.3
2. U.S. natural gas prices
Falling prices for natural gas have been very welcome news to Midwest households, who have seen their home utility bills for natural gas edge downwards in recent years. In addition, due to abnormally mild temperatures this past winter, lower consumption of home heating fuel also helped to ease pressures on household budgets. Midwestern households rely on natural gas more than the national average, especially for home heating purposes. As of 2009, an estimated 72 percent of the region’s households received piped gas at their homes versus 57 percent for the rest of the U.S.4
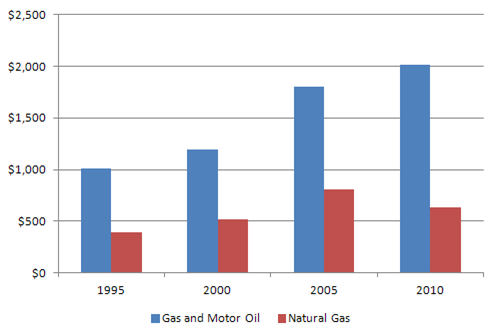
However, average annual expenses for home heating do not approach annual expenses for motor fuel—even for midwesterners. At 2010 prices, for example, we estimate motor fuel expenditures to have been 3.2 times average expenses for residential natural gas in the broad Midwest region.5 For this reason, the declines in residential gas prices since 2010 have not offset the rises in motor fuel. Yet, the boom in domestic production of natural gas, and its moderating effect on natural gas prices at the wellhead, have acted as a stablizing influence on household incomes in the region.
3. Fuel expenditure per Midwest household
Footnotes
1 These data are drawn from the Consumer Price Index for all urban consumers nationally. Motor fuel prices represent prices for unleaded regular gasoline. Home heating fuel price reflects piped gas to residences.
2 The Henry Hub is the pricing point for natural gas futures contracts traded on the New York Mercantile Exchange.
4 Estimates derived from U.S. Dept. of Energy, Energy Information Administration (EIA), Fuel Use Survey, table HC1.9. Of those receiving piped gas, over 90 percent use it as their primary space-heating fuel. Due to continued production expansion of shale gas, the Energy Information Administration forecasts continued stable to falling home heating fuel prices in the years ahead.
5 Per household, the 2010 figures average $2,019 for annual motor fuel and motor oil expenditures, $634 for residential heating. Residential energy expenditures (principally for home heat) are from EIA, State Price and Expenditure Database. Residential motor fuel prices, households, and consumption are from U.S. Department of Labor, Bureau of Labor Statistics, Consumer Expenditure Survey. The Midwest geography is here defined as the states of OH, MI, IN, WI, IL, MN, IA, MO, NE, ND, SD, and KS.


