What does real gross state product tell us about Seventh District economic growth?
Real gross state product (GSP) is the state analogue of real gross domestic product (GDP), which measures national economic activity.1 That is, real GSP is the most comprehensive measure of state economic activity. Although the release of other state economic indicators like employment figures are timelier, they exclude developments such as productivity enhancements and the application of capital and machinery to manufacturing processes that make real GSP a more complete measure of economic activity. Real GSP is also preferred because its values are adjusted for inflation, making comparison across time more informative.2
Additionally, real GSP is informative in describing how much value a particular industry adds to a state’s economy. For example, in 2011, 12.8% of Michigan’s nonfarm payroll employees worked in manufacturing, while this industry constituted 16.6% of Michigan’s economic activity. In contrast, 15.7% of Michigan’s nonfarm payroll employees worked in the government sector, which only constituted 11.2% of Michigan’s economic activity.
Recent GSP growth and revisions
Initial estimates of GSP are later revised on an annual schedule as new data and information become available. Table 1 details the real GSP growth revisions. In the most recent release, significant revisions were made to the data going back to 2008.
Table 1. Real GSP growth revisions

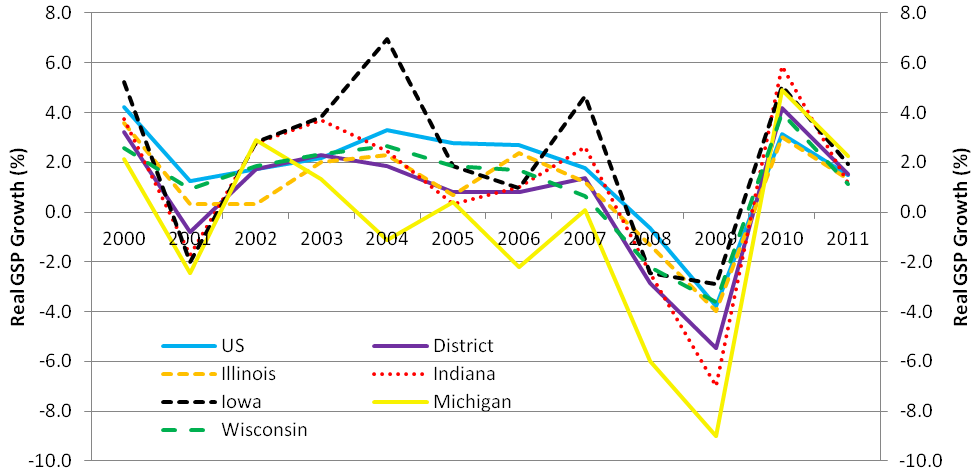
Chart 1 (below) shows the currently available time series of real GSP growth for each of the five states in the Seventh Federal Reserve District. The Seventh District and U.S. economies grew at a rate of 1.5% in 2011, slower than in 2010. Seventh District economic growth was revised upward in 2010 from 2.8% to 4.2%, and U.S. economic growth was revised from 2.6% to 3.1%.3 The data also revealed the Great Recession was more severe than previously thought for the U.S. and the Seventh District. When averaging economic growth in 2008 and 2009, the U.S. economy grew at a rate of –2.2%, revised from –1.4%. The Seventh District underwent a more significant revision for the same period, with average annual growth reported now as –4.2% versus the –2.6% value reported the previous year.
Chart 1. Real GSP growth

Among the Seventh District states, Michigan’s economy grew at the fastest rate in 2011, increasing at a pace of 2.3%. Michigan’s growth rate in 2011 ranked sixth among all 50 states, and it was ranked in the top ten in both 2010 and 2011—a welcome change from its last place ranking in 2008 and 2009. The other Seventh District states all grew at rates faster than 1%: Iowa, 1.9% (12th among all states); Illinois, 1.3% (20th); Indiana, 1.1%, (25th); and Wisconsin, 1.1% (26th).
Explaining Seventh District GSP growth
Durable goods manufacturing was the largest contributor to growth for each Seventh District state, leading the manufacturing rebound seen nationally. Because of the way state economic data are collected, subsector data won’t be available until later this year. However, some inferences can be gathered from the 2010 data as to the origination of manufacturing’s strength. The majority of Indiana’s and Michigan’s manufacturing expansion stems from the rebound in light vehicle production and sales. Motor vehicle, body, trailer, and parts manufacturing contributed 6.21 and 5.01 percentage points to Indiana’s and Michigan’s economic growth in 2010, respectively The auto industry’s significant role in Indiana’s and Michigan’s economic expansion supports Thomas Klier and James Rubenstein’s writing that the industry is concentrating further in Automotive Alley, which is along north–south Highways I-65 and I-75 between the Great Lakes and the Gulf of Mexico.
Other Seventh District states contain strong nonautomotive durable goods manufacturing subsectors. Illinois’s and Iowa’s strongest growth contributions in 2010 were from machinery manufacturing, specifically heavy agriculture and capital equipment. Wisconsin’s post-recession durable goods manufacturing growth has come from fabricated metal, computer and electronic products manufacturing, and machinery manufacturing.
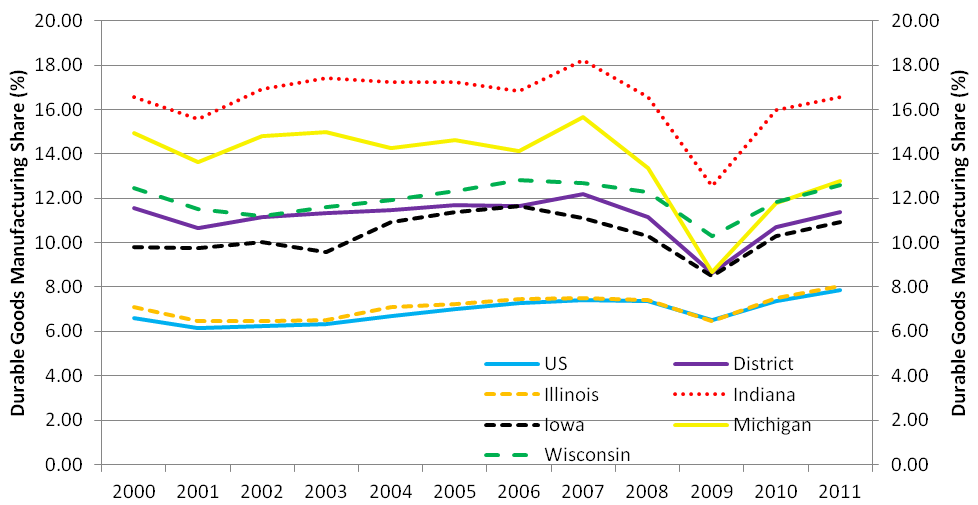
With the exception of Illinois, the share of Seventh District economic activity due to durable goods manufacturing is considerably larger relative to its share of overall U.S. economic activity. Chart 2 shows that as a percentage of total economic activity, durable goods manufacturing is at or near pre-recession levels for each Seventh District state. This affirms the assertion that durable goods manufacturing has rebounded quite well since the end of the recession. However, it may also indicate the approaching conclusion of the rebound and flatter growth in durable goods manufacturing going forward.
Chart 2. Durable goods manufacturing as a share of economic activity

Most of the major sectors within the Seventh District grew at rates in 2011 slower than those reported for 2010; the exceptions were construction, information, professional and technical services, and management. The construction sector experienced growth in Illinois, Iowa, and Michigan and hence made a positive contribution to Seventh District economic growth for the first time since 2000.
Growth in wholesale trade could at least partially be traced back to the growth seen in manufacturing and retail trade, whose share of Seventh District economic activity is currently above 1998 levels. Retail trade’s increased influence suggests two things. Consumers may be feeling the positive effects of the manufacturing sector’s robustness in the Seventh District economy and consequently spending more. However, with overall growth flattening out and retail trade now making up its largest share of Seventh District economic activity in 14 years, it is unclear whether retail trade expansion is now slowing or on the verge of slowing.
The sectors that had the largest negative impact on Seventh District growth were financial activities and government. After rebounding in 2010, finance and insurance slightly decreased in 2011; real estate and other financial activities were still searching for a bottom, continuing to decrease albeit at a slower rate in 2011 than in 2010. The government sector contracted for the second straight year, with the decline picking up in 2011, reflecting the continued cutbacks taking place in state and local government employment. Relative to the nation, the Seventh District experienced faster rates of decline for the finance and insurance sector and government sector.
In response to the region’s broad economic growth, real per capita income in 2011 increased in each Seventh District state at solid rates. Moreover, in 2011, real per capita income growth in each Seventh District state was higher compared with national real per capita income growth. Michigan saw the most rapid real per capita income growth at 2.3%, which ranked fourth among all 50 states. It was Michigan’s first annual increase in real per capita income since 2007. The other Seventh District states’ growth rates for 2011 were as follows: Iowa, 1.5% (eighth among all states); Illinois, 1.1% (12th); Wisconsin, 0.8% (18th); and Indiana, 0.7% (20th). Real per capita income growth accelerated in Michigan, Illinois, and Iowa, but decelerated in Wisconsin and Indiana. In terms of real per capita income levels, only Illinois’ is higher than that of the U.S.
Forecasting GSP growth
While GSP is a comprehensive measure of state economic activity, the frequency of its being reported can be a limiting feature. Because it is constructed from many disparate data sources, it is an annual measure rather than a quarterly one. Similarly, because some of its underlying components are available only with long lags, GSP continues to be revised for years following its initial release. For example, GSP for 2011 was released this past June, but it will be revised again next year.
Because of the long lag and volatility present in the revisions, the Federal Reserve Bank of Chicago has begun to forecast real GSP growth for the Seventh District states using other key economic indicators. Table 2 compares the Federal Reserve Bank of Chicago’s predicted values for 2011 real GSP growth and the actual values in the U.S. Bureau of Economic Analysis’s latest report. The Chicago Fed forecasts are based largely on the Midwest Economy Index (MEI), which is a district-wide measure of nonfarm business activity that relies on monthly and quarterly indicators of employment, unemployment, per capita personal income, home and retail sales, and production.
Table 2. Predicted vs. actual real GSP growth

Before taking into account the BEA’s recent GSP revisions, the Chicago Fed forecasts for Seventh District state GSP growth in 2011 were nearly on the mark for Illinois and Michigan but about 1 percentage point above the reported values for Indiana and Wisconsin and below by about that same amount for Iowa. Iowa’s sizable agricultural economy and its strong economic performance in 2011 largely explained the forecast error. When the Chicago Fed forecasts are compared with the BEA’s recently revised GSP data, there is clearly an improvement in fit for every state but Michigan. This is because the Chicago Fed forecast for Michigan’s GSP growth incorporates a substantial degree of mean reversion based on its past growth patterns, which have not been very robust. The fact that Michigan’s actual GSP growth remains a Seventh District and national standout is thus a remarkable turn of fortune.
Conclusion
The Seventh District continues to enjoy a rebound in manufacturing, especially in durable goods manufacturing. Increased demand for light vehicles, capital equipment, software, and other advanced, value-added manufacturing goods continues to bode well for the Seventh District (relative to other Federal Reserve Districts). Seventh District economic growth will gain extra support once the financial activities and government sectors start strengthening and the construction sector’s rebound becomes sustained, further boosting consumer spending. The Federal Reserve Bank of Chicago’s forecast of real GSP growth for the first quarter of 2012 will be released in conjunction with the release of the May MEI on June 29, 2012.
Footnotes
1 Real GSP is calculated as the sum of incomes earned by labor and capital and the costs incurred in the production of goods and services, which includes workers’ compensation, corporate profits, and business taxes that count as business expenses. Real GDP is measured by summing all final expenditures, while real GSP uses an income-based approach, creating a statistical discrepancy between the two data sets.
2 Real GSP data, or real GDP by state data, are prepared in chained (2005) dollars. National chain-type price indexes are applied to nominal GDP by state values. Real GDP by state doesn’t capture geographical differences in the prices of goods and services that are produced and sold locally.
3 U.S. real GDP growth in chart 1 is the sum of real GSP growth of each state deflated by a national price measure.


