Will America’s Boom in Energy Production Give Manufacturing a Boost?
Falling prices for natural gas have encouraged those who believe that manufacturing activity will rebound in the years ahead. While abundant supplies and dampened prices for natural gas are certainly positive developments for U.S.1 manufacturing, the impacts may be modest in sum. Energy materials and fuel costs are important to many types of manufacturing processes and industries, but such factors are not always commanding considerations in manufacturing production and siting decisions. Additionally, while the outlook for domestic energy production looks robust, the outlook for large price declines may be limited because of the competing uses for natural gas, both at home and abroad.
The domestic recovery of fossil fuels—especially that of natural gas—has been on the rise in recent years. Since the middle of the previous decade, technological breakthroughs in natural gas recovery have boosted natural gas production and supplies. These enhanced recovery techniques include horizontal drilling through shale rock in search of gas deposits, accompanied by pressurized fracturing of shale rock, which releases gas (and energy liquids) for recovery. Accordingly, natural gas production from shale deposits has expanded rapidly, increasing its share of overall U.S. gas production to 23% in 2010 from less than 7% in 2007. One long-term forecast concludes that this trend will continue—more specifically, under the assumption that current laws and regulations will stay the same over the projection, shale gas production is predicted to rise “from 5.0 trillion cubic feet per year in 2010 (23 percent of total U.S. dry gas production) to 13.6 trillion cubic feet per year in 2035 (49 percent of total U.S. dry gas production).” As a result of this additional fossil fuel recovery, it is projected that overall domestic gas production will expand by 30% on an annual basis by the year 2035.
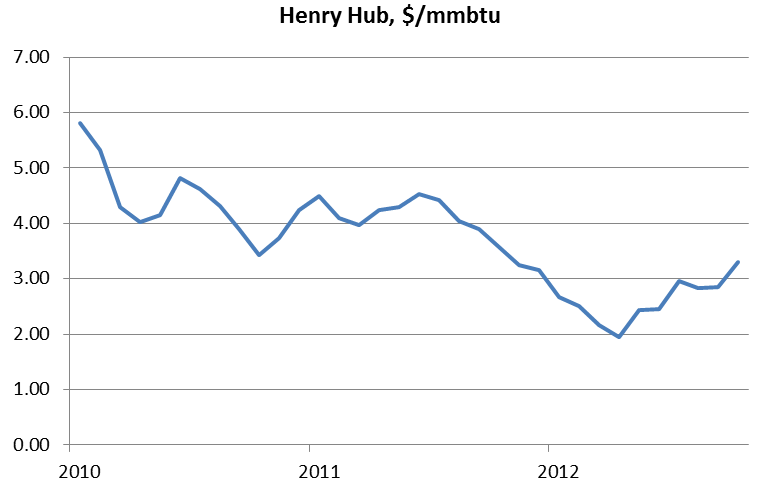
So far, expanded production of natural gas has translated into falling prices. Earlier this year, prices for natural gas on the spot market (i.e., the cash market, in which this commodity is traded for immediate delivery) plummeted following a period of extensive exploration and recovery activity.2 From the late fall of 2009 to the spring of 2012, the spot price for natural gas per million British thermal units) fell from $6 to $2 (see the chart below). Since that time, drilling and recovery activity have been curtailed in response to plummeting prices, so that prices have recovered to some extent. The firming of prices has also been bolstered by the greater use of natural gas (instead of coal) in generating electric power.
Chart 1. Spot market price for natural gas
Whether or not enhanced natural gas production will translate into lower domestic prices for industrial users over the long haul will depend on several factors. For one, as just mentioned, natural gas can be substituted for competing fuels in other sectors. Currently, for example, natural gas is being substituted for coal in the electric generating industry. Competing demands such as these may tend to buoy the price of natural gas, even as overall supplies are increasing.
The transportation sector is the largest fuel-consuming sector in the United States (outside of the electric power generating sector), and it is almost wholly dependent on gasoline derived from petroleum. In the event that a larger percentage of cars and trucks were modified so that they could use natural gas, the competing demand for this fuel might also sustain upward pressure on its price. Currently, natural-gas-powered vehicles consume a small fraction of the transportation sector’s overall fuel use. The service fleets of vehicles that are maintained by commercial businesses and governments account for most of the natural gas consumption within the transportation sector. However, the technology to adapt vehicles for natural gas consumption is well developed.3 The major impediment to broader modification of vehicles so that they are powered by natural gas is the additional infrastructure required to transport natural gas from wells and pipelines to commercial filling stations across the country.
The ultimate impact of rising domestic production of natural gas on our manufacturing may also be affected by international demand for natural gas. A set of complex dynamics will affect whether the nation imports or exports (on net) natural gas. To date, the United States has been a net importer of natural gas from neighboring countries. However, in the event that domestic production continues to grow rapidly, market conditions may one day encourage U.S. producers to export the product. If so, the price of U.S.-produced natural gas would then become more in line with global energy market prices.4 To the extent this were to happen, the use of natural gas as a domestic input to manufacturing would be discouraged by the higher prices that could be commanded in international markets.5
Even if we assume that natural gas prices remain depressed here, we may still ask if the fuel is an important part of the cost structure for manufacturing. If natural gas turns out not to be a major factor in this cost structure, then the choices in the siting of manufacturing plants that favor the United States would be somewhat limited.
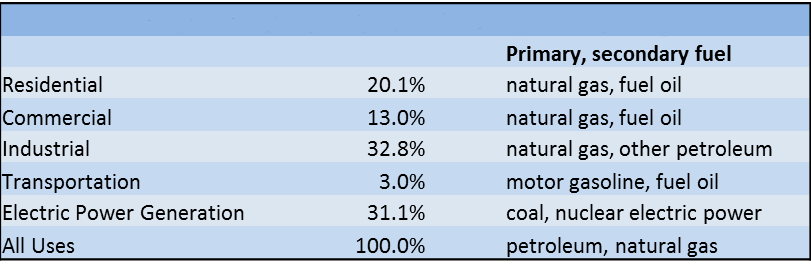
Undoubtedly, industrial processes (including those of the manufacturing sector) consume large quantities of natural gas and other fuels. For 2011, industrial uses accounted for one-third of overall U.S. natural gas consumption; and the industrial sector counted natural gas as its single largest fuel source, just ahead of petroleum (see below).
Table 1. U.S. natural gas use, by sector (and major fuels), 2010
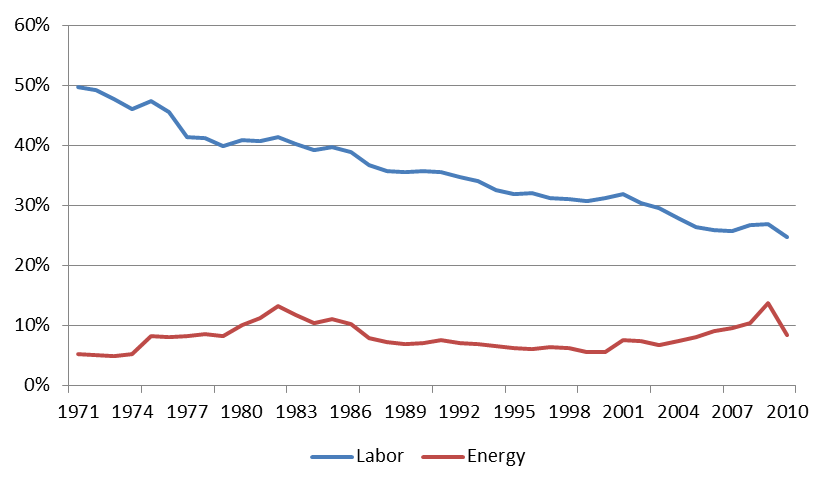
However, as a share of industrial production costs, energy inputs are a somewhat modest component at the present time.6 The chart below illustrates the energy content of overall U.S. manufacturing as measured against output (i.e., “value added”). The manufacturing sector’s overall consumption of all energy-type products—including electricity, energy product feedstock, and natural gas—amounts to close to 8% of value added in 2010. (Natural gas alone makes up a smaller share, nearly 3%.) In contrast, labor costs makes up almost 26% of value added in 2010.7
Chart 2. U.S. manufacturing energy and labor expenditures as percent of total value added
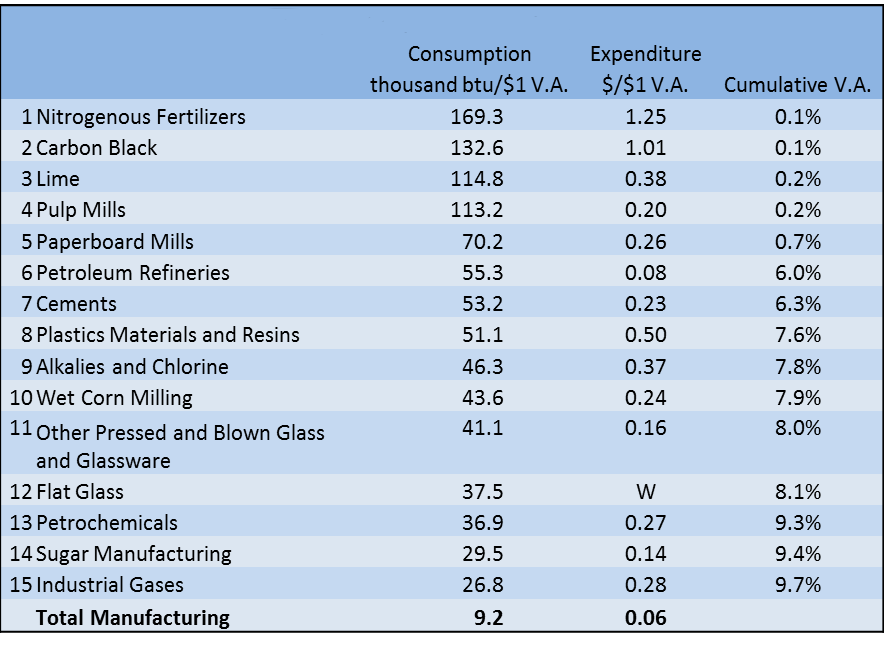
Though energy costs do not make up, on average, a large share of the overall value added of the U.S. manufacturing sector as a whole, this is not the case for certain manufacturing subsectors. The first table below ranks U.S. manufacturing subsectors from highest to lowest according to non-electricity fuel intensity from all sources. The highest ranking industry subsector, nitrogenous fertilizer, is a huge user of energy material, most of it being natural gas (see second table below). The nitrogenous fertilizer industry spends 125% of value added on non-electricity fuel products and 117% of value added alone on natural gas—principally as a feedstock into the production of fertilizer. However, many of these energy intensive subsectors are small and do not make up large shares of overall U.S. manufacturing production at the present time. All told, for example, the top 15 most fuel-intensive industries account for less than 10% of total U.S. value added in manufacturing. The top 15 natural-gas-consuming industries account for less than 4% of total U.S. manufacturing production.
Table 2. Top fuel intensive industries
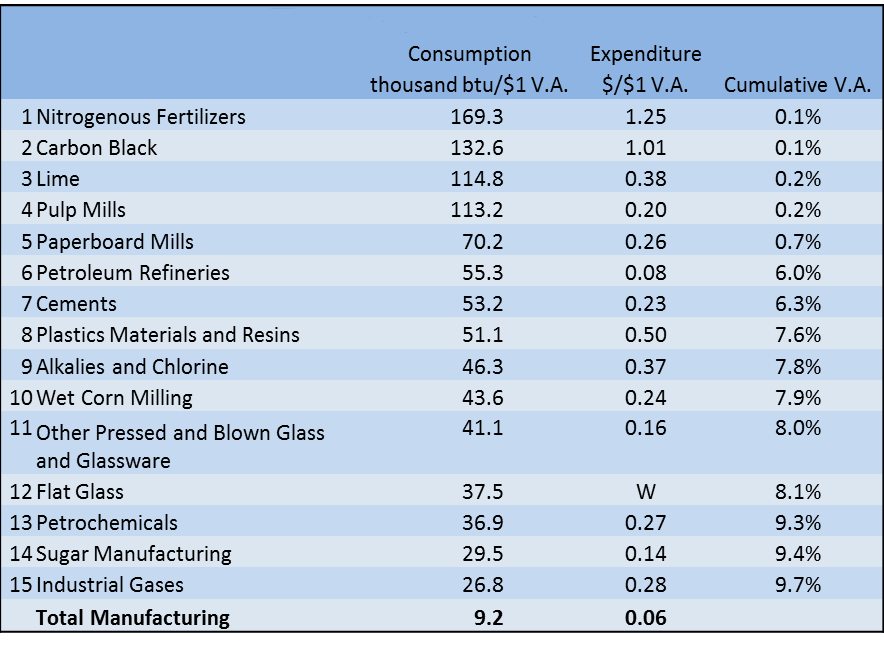
Note: Both consumption and expenditure exclude purchases of electricity.
Table 3. Top natural gas intensive industries
Despite this modest share of energy-intensive industries in overall U.S. manufacturing, low energy costs (and the greater availability of energy) in certain states do tend to attract the most energy-intensive industries. The table below ranks those states having the most energy-intensive mix of industries as measured by the consumption of fuel product per dollar of manufacturing (second column). Energy-producing states tend to dominate the list because energy products are abundant there and because fuel prices are lower closer to the point of production (on account of the lower transportation costs). In contrast, although much more overall manufacturing activity is located in the Seventh Federal Reserve District relative to the nation (last column), the District’s industry mix tends to be less intensive in average fuel use.
Table 4. Fuel use in overall manufacturing by state
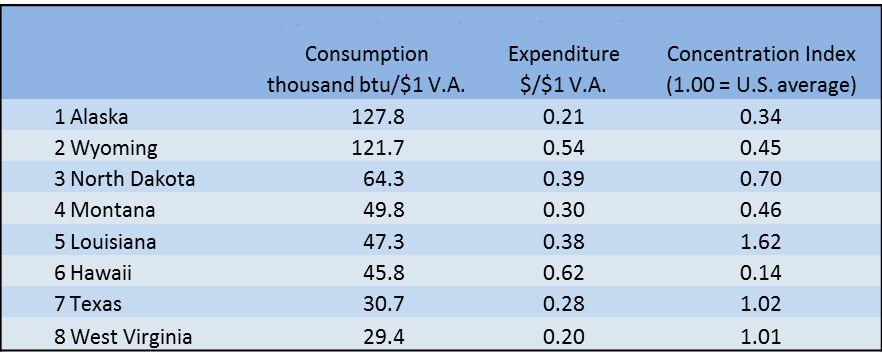
Table 5. 7th District

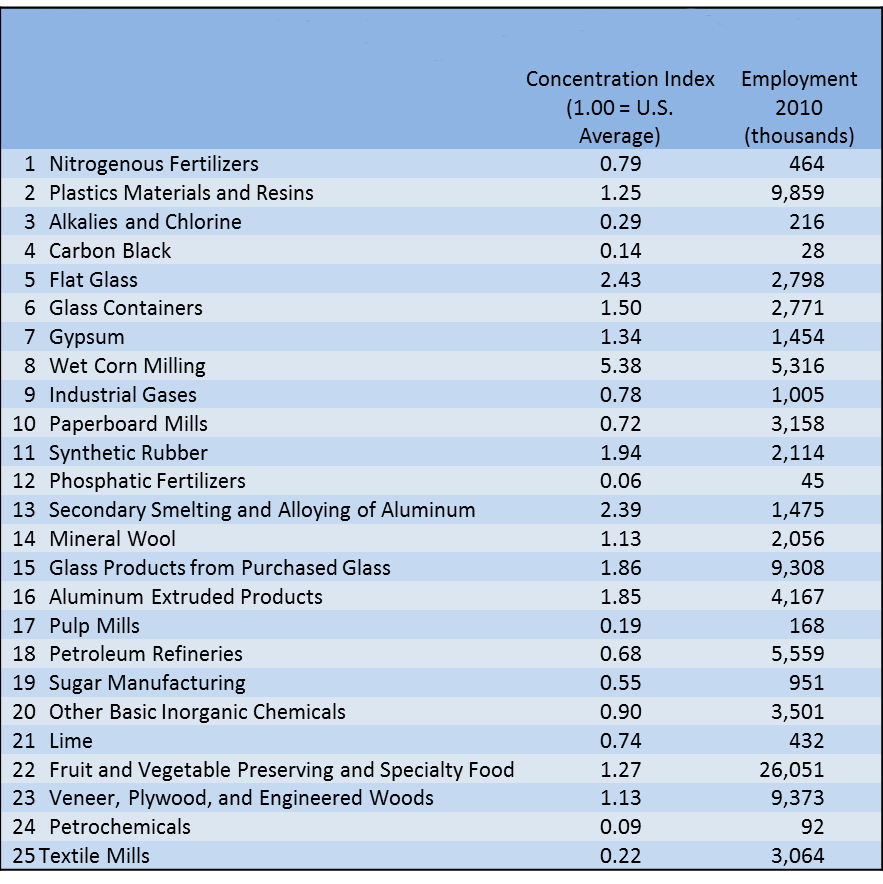
The table below specifies the employment concentration of the nation’s 25 most natural-gas-intensive industries. Many of these industries have tended to locate in the Seventh District, and they may choose do so to a greater extent in the future should natural gas become cheap and abundant here.8
Table 6. Employment concentration of nation's most gas intensive industries in Seventh District (relative to U.S.)
The boom in natural gas production in the U.S. will undoubtedly encourage some manufacturing activity. However, under several scenarios, the benefits of abundant natural gas are likely to be spread broadly across the U.S. and Midwest economies rather than being concentrated in the manufacturing sector alone. In particular, natural gas usage will likely make inroads into many sectors, such as electric power generation and transportation. In this way, the (lower) price effects, should they come about, will also be distributed across many sectors. If so, these competing demands will tend to limit the potential price decline of natural gas and the associated upside in manufacturing activity. Similarly, the possibilities for exporting natural gas will tend to buoy its price for domestic purposes, including those for the industrial sector (dampening its increased level of activity).
Note: Thanks to Norman Wang for excellent research assistance, and to Han Choi for editorial work.
Footnotes
1 See, for example, “Europe Fears U.S. Energy Gap,” Financial Times.
2 Note that most natural gas is not sold on the spot market; rather, it tends to be sold under longer-term contracts. Accordingly, these prices do not generally reflect the average prices paid for natural gas consumed.
3 See Conference on “Energy Use in the U.S. Trucking Sector,” Resources for the Future.
4 The U.S. Department of Energy’s baseline forecast expects that because of the expansion of natural gas production, the United States will eventually become a net exporter of natural gas by early in the next decade. Longer-term projections by the U.S. Energy Information Administration (EIA) predict that real prices will remain largely flat over the next ten years.
5 However, high transportation and production costs of domestic natural gas for export would mean that its price would remain somewhat lower for domestic use. And again, there are large infrastructure investments to be made to achieve capacity to export natural gas/a>
6 This qualification may be an important assumption. Presumably, if energy costs fell very dramatically, the industry mix of manufacturing in the United States would shift, perhaps decidedly, toward those types of products and processes that heavily consume energy.
7 Note also that the energy efficiency of U.S. manufacturing (blue line) has been increasing over time. Here, we take a broad view of energy intensity—i.e., including all fuels rather than natural gas alone—because fuel substitution may be widely feasible in many production processes.
8 For a current map of the location of both feasible shale rock formations, along with “current plays” in producing natural gas, see here.


