Is Something Ailing the Illinois Economy?
As the US economic recovery approaches the five-year mark, a look back shows that it has been far from a smooth and upward ride. Since the end of the Great Recession, the economy has grown at a generally disappointing pace with fits and starts due to repeated setbacks. Many parts of the U.S. economy are still working their way through the effects of the financial crisis that accompanied the recession. For instance, the labor market has been healing quite slowly. And many households and businesses are still repairing their balance sheets after having suffered steep losses in asset values. Also, the overhang in housing inventory has been slow to clear. Meanwhile, global economic recovery has faltered several times—first, in Europe and, most recently, in East Asia.
As the U.S. economy began to recover in mid-2009, Illinois and other states in the Great Lakes region bounced back at a quick pace, albeit from a very low point. The Great Lakes region’s strong industrial orientation—that is, its heavy involvement in durable goods production—translated into a steep economic recovery as the nation’s businesses sought to rebuild their depleted inventories of capital goods and equipment while households similarly began to replace automobiles and other consumer durable goods. Moreover, since the global recovery was quite strong back then, exports of machinery and foodstuffs from the Great Lakes region also contributed to the economic climb. However, the Great Lakes region’s pace of growth began to decelerate two years into the recovery. The aforementioned growth impetus of inventory rebuilding and exports abroad eased. Among the major sectors, only the automotive industry continued to grow quickly.
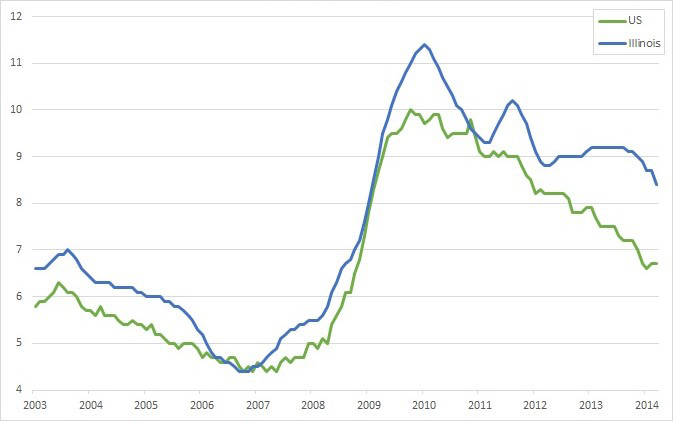
Following the Great Recession, Illinois began to recover and even gain ground on the nation, but its economic performance began to alarm many observers in 2011. As seen below, Illinois’s unemployment rate fell quickly in 2010 and into early 2011. However, the state’s unemployment rate then failed to show much improvement, even as the nation’s unemployment rate continued to fall more.
Chart 1. Unemployment rates: US and Illinois (seasonally adjusted)
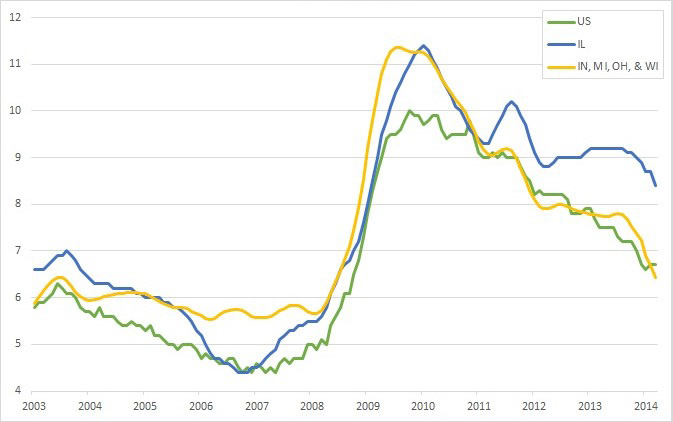
It could be that Illinois’s deviation from the national trend in unemployment is related to the economic performance of the broader Great Lakes region. The Illinois economy is highly integrated with the other industrial states of the Great Lakes region—Wisconsin, Indiana, Michigan, and Ohio. Accordingly, the Illinois economy regularly rises and falls along with the economies of these states. If Illinois’s performance differs from its neighbors, it would be a cause for concern—and the degree of concern would be higher as Illinois fell further behind its neighbors. As the chart below suggests, the aggregate unemployment rate of the Great Lakes states (less Illinois), has continued to decline since 2011; Illinois progress has been much less. In what follows, I discuss possible sources of the deviation, including Illinois tax structure and Illinois industrial structure. In addition, I examine an alternative measure of labor market performance, namely the growth in payroll jobs.
Chart 2. Unemployment rates: US, Illinois and Great Lakes states (seasonally adjusted)
Illinois’s seemingly poor economic performance compared with that of its neighboring states has sparked a policy debate as to whether the state’s recent hikes in statewide income taxes may be deterring investment and hiring in the state. Beginning in January 2011, the state’s personal income tax rates were hiked from 3.0 percent to 5.0 percent for the period 2011–14; they are scheduled to go down to 3.75% for the period 2015–23 and then to 3.25% from 2024 onward. (Similar hikes were enacted to the state’s corporate income tax—also with a schedule of phasing out the higher rates). These tax hikes were enacted to help the state pay down a rising stack of short-term debt for operating expenditures and to make progress on a much larger amount of unfunded public employee obligations (such as pensions). To date, the state’s finances have improved only modestly with respect to both short-term debt obligations and its longer-term pension-related debt. For this reason, some observers believe that Illinois tax rates will not be allowed to (fully) phase out as planned.
Are tax rate hikes discouraging hiring and investment in Illinois? It may come as no surprise that the effects of state and local tax differences on state economic growth are far from a settled science. Among the difficulties for settling the debate are that states seldom allow their business climates to get very far out of line with those of their neighbors, thereby making it difficult to find the growth effects of tax differences. However, in the case of Illinois, there is ample cause for concern. The state and its local governments face the possibility of having to pay down very large debt obligations—on the order of $100 billion or more—for employees covered by statewide pension systems. Moreover, the City of Chicago and other overlapping units of local government within the city’s limits face similar amounts of liabilities when measured on a per capita basis, while other Illinois local governments also carry very large unfunded liabilities. As discussed previously, depending on how fast these liabilities are amortized, they could give rise to tax rate differences between Illinois and neighboring states that are very sizable.
In a recent analysis of Illinois’s economic performance since the beginning of the hike in its income tax rates, Andrew Crosby and David Merriman examine several labor market measures of performance of the state versus the rest of the Midwest region.1 Similar to the charts above, the authors note that the unemployment rates diverge in a striking fashion right around the time that Illinois hiked its income tax rates. However, given the high variability of unemployment rate measurement at the state level, the authors think it best to consider other measurements. In examining payroll job growth, they show that growth in payroll employment displays a far less prominent deviation between Illinois and the rest of the Midwest region. In addition, the timing of the growth difference between Illinois and its neighbors does not develop until 2013—two years beyond the income tax hike.
While there is some evidence, then, that Illinois’s fiscal problems are weighing down its recovery, such problems are more of a long term concern. Illinois’s slow recovery may have more to do with its industrial structure. To further the analysis, I draw on data from the U.S. Bureau of Labor Statistics that are called the Quarterly Census of Employment and Wages (QCEW). These data are reported for states and the nation from the comprehensive reporting of those firms and establishments that are covered by the Federal-State Unemployment Insurance Program. One clear advantage of using such data is that specific industry employment data are reported by firms and establishments, which allows us to investigate the possible effects of differences in industry mix. On the downside, the data are compiled and released with a time lag of one half year or more.
The chart of the QCEW data for Illinois versus the four remaining Great Lakes states (Indiana, Michigan, Ohio, and Wisconsin) are shown below. Illinois’s employment outperformed the remaining states of the Great Lakes region in the years prior to the recession and during the recession. As a matter of interpretation, I would argue that Illinois’s relative superior performance prior to the recession likely reflected Michigan’s collapsing auto industry employment from 2003 onward, along with the unsustainable residential property construction boom that took place in the Chicago area prior to the onset of the recession in December, 2007. Illinois also outperformed the region during the recession, and this is somewhat typical. Illinois is the domicile of highly compensated professional and business service workers who are not as readily laid off during economic downturns.
Chart 3. Covered Employment: Illinois and other Great Lakes states (percent change year-over-year)
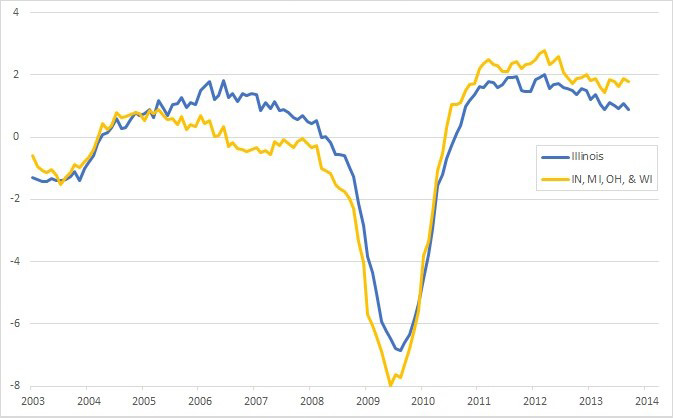
However, the period following the recession—from mid-2009 onward—contrasts mildly but unfavorably from the previous periods. After the recession, the Great Lakes region’s employment recovers faster than Illinois’s in each year. This trend is again somewhat consistent with the possible pernicious effects of the 2011 tax hike. While Illinois’s employment performance lagged in the year prior to the tax hike, which seems counterintuitive, it is possible that firms began curtailing investment and hiring prior to the tax hike itself in anticipation of an inferior climate in which to do business.
That said, it is notable that, as opposed to the unemployment rate gap that was observed, the payroll job growth difference seen here is small.2 More importantly, there are alternative possible causes for Illinois’s lagging payroll job growth. In particular, Illinois’s mix of industries, while similar in some respects to those of other Great Lakes states, differs as well. It is possible that the small differences in job growth between Illinois and its neighbors are due to its somewhat different industry mix rather from disinvestment and a reluctance to hire in the state.
To investigate further, I compiled the QCEW data covering the five Great Lakes states from third quarter of 2007 to the third quarter of 2013, with detailed counts of jobs for each of 88 private sector industries. In the table below, the first row displays the actual job growth in Illinois for three two-year periods, as well as the entire period 2007:Q3–2013:Q3. During 2007:Q3–2009:Q3, Illinois experienced a net loss of 377,000 private sector payroll jobs, and gained back all but 158,000 by the third quarter of 2013.
Table 1
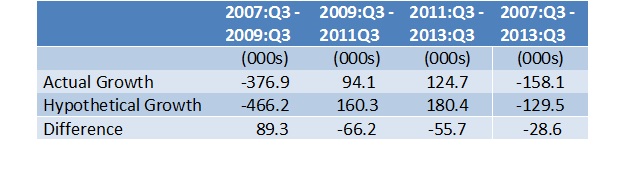
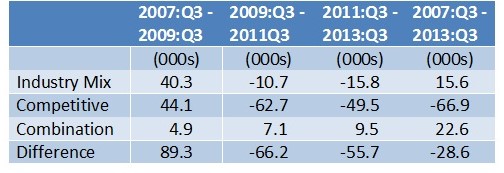
As an analytic exercise, I further ask how the Illinois economy would have fared 1) if it had the same industry composition as the four other Great Lakes states combined and 2) if its industries had the same job growth rates as those in the other states. The second row of the table reports the results of this exercise (based on the two hypothetical scenarios, as well as an interaction of the two); the final row is the difference in hypothetical growth from actual growth. As shown above, Illinois hypothetically outpaced the region by 89,300 jobs in the 2007:Q3–2009:Q3 period by having a different industry mix and employment growth performance, but it gave back those jobs (and more) in the four years afterward.
To examine the results of this exercise in a different way, I decompose the differences in actual and hypothetical job growth in the table below. The first component shows the effects of maintaining Illinois’s actual industry-by-industry rates of employment growth but then hypothetically imposing the Great Lakes mix of industries. In the first row of the table below, one can see that during 2007:Q3–2009:Q3, Illinois’s industry mix was favorable to that of the remaining Great Lakes region, because it accounted for a 40,300 hypothetical gain in jobs. Seemingly, there are noteworthy differences in Illinois’s mix of industries from its neighbors’ that account for some of the year-to-year performance differences that we observe.3 For the subsequent two periods of the recovery, the mix of industries in Illinois (below) shows a hypothetical employment loss of 11,000 (from 2009 – 2011), and a further loss of 16,000 (2011 – 2013).
What are some of the industry mix differences that are notable between Illinois and other Great Lakes states? The large professional and financial services employment base in the Chicago area has already been noted. Further, in relation to other states, Illinois is now much more services oriented overall rather than goods producing. Manufacturing’s share of employment for 2013 clocks in at 11.4 percent of private sector payroll jobs in Illinois, versus 16.4 percent for the other four states. (See the appendix below for a more detailed illustration of Illinois employment base versus the GL region).
The schism in manufacturing employment share between Illinois and the Great Lakes region is wholly attributable to the Chicago area. As of 2013, the Chicago MSA employment base recorded only a 9.5 percent share in manufacturing, while the remainder of Illinois recorded 15.9 in manufacturing. From a geographic perspective, these differences may also explain part of the overall performance difference between Illinois and the remaining Great Lakes states. As the graphic below suggests, annual payroll employment growth in the Chicago MSA has kept pace with the remainder of the Great Lakes region while Illinois (non-Chicago) has fallen behind since 2011.
Chart 4. Nonfarm payroll: Great Lakes states, Chicago and downstate (three-month moving average percent change year-over-year)
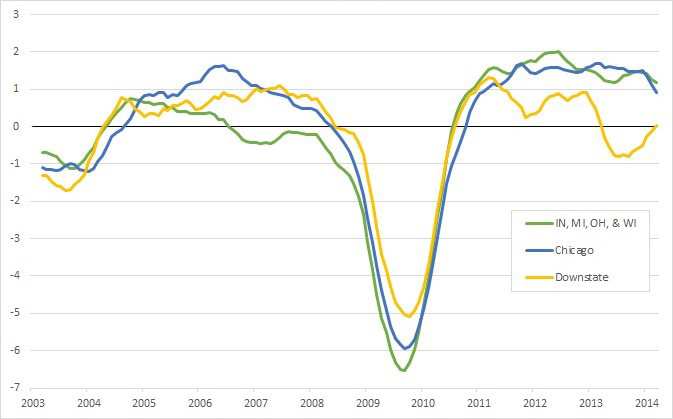
And within manufacturing, Illinois tends to lean more toward food processing and farm, construction, mining machinery relative to the other Great Lakes states. In contrast, while there are important auto assembly operations in the Bloomington–Normal and Rockford areas of Illinois, as well as important links to the automotive supply chain throughout the state, Illinois’s ties to the automotive industry are much less prominent than those of Michigan, Indiana, and Ohio.
Despite such industry differences between Illinois and the other Great Lakes states, an extension of the analysis suggests that the state’s competitive job performance did not kept pace during the recovery. For the same time periods, a second hypothetical component shows the effect of holding Illinois’s actual industry mix constant, but imposing the average job growth rates of the same industries from the neighboring Great Lakes states (second row below). Here, because the industries that make up Illinois’s mix tended to grow more rapidly (decline more slowly) than they did in the Great Lakes region, the state hypothetically gained another 44,100 during the 2007–09 period, but subtracted 63,000 and 50,000 jobs in the subsequent periods. (The final component is the interaction of two hypothetical effects).
Table 2
As measured by labor market indicators, then, the Illinois economy has not fared as well as neighboring states during the economic recovery that began in mid-2009. Measurements of the state’s unemployment rate show Illinois in the least favorable light. In contrast, other labor market indicators, such as payroll employment growth, suggest that the state’s underperformance is much more mild. Nonetheless, even payroll employment trends suggest that Illinois is underperforming when examined on an industry-by-industry basis. Accordingly, recent changes in public policies that influence the investment climate, such as tax rate hikes, cannot be ruled out entirely,though such policy effects are unlikely to be exerting such a large and immediate effect.
In looking for alternative or contributing explanations, the state’s particular mix of industries is likely contributing to underperformance. For example, the state’s high concentration in construction and mining machinery stands out, as does its lower concentration in automotive as compared to Great Lakes states located to the east. The downstate Illinois economy is highly concentrated in manufacturing, and downstate areas have seen slower payroll employment growth than the Chicago area. And so, Illinois’s performance may yet converge with its neighbors as the automotive boom settles down, and as global economic recovery revives exports of machinery and equipment.
In considering other structural causes, the Chicago area experienced super-normal growth prior to the recession due to excessive home-building and related activities. Accordingly, part of Chicago’s recent performance may derive from a slow healing of residential real estate and related activity following the boom period.4
Appendix 1: More on Illinois employment base as compared to the remaining Great Lakes region
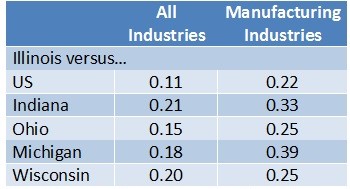
The table below constructs an “industry dissimilarity index” between Illinois and other Great Lakes states (using the QCEW database as above) for the year 2013. Illinois is dissimilar to Indiana, Michigan, and Wisconsin, more or less, to the same degree when all industries are accounted for. However, Illinois is more dissimilar to Indiana and Michigan—the two most auto-intensive states in the region—and less dissimilar to Wisconsin in the case when the index is constructed to account for manufacturing industries alone.
Table 3
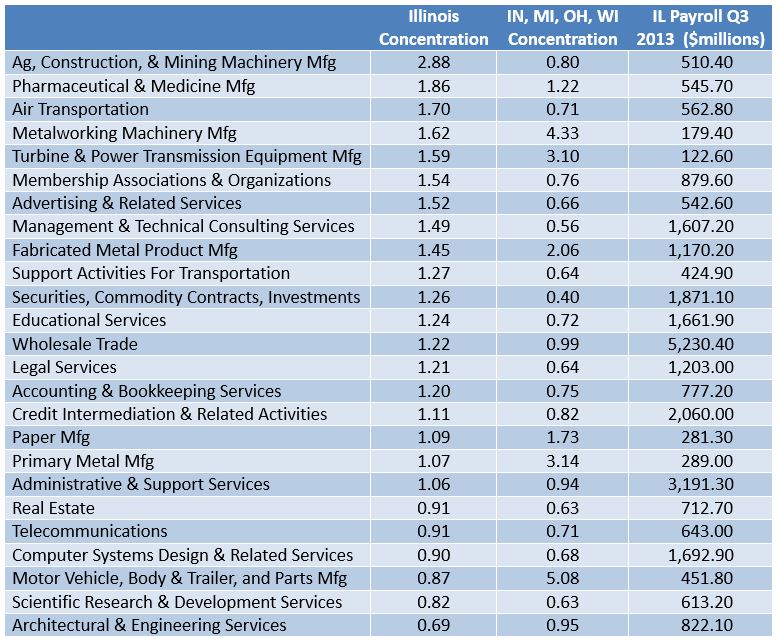
Appendix 2: Selected Illinois industries comparison (index based on wages)
Here, the indexes of concentration shown in columns two and three relate Illinois and the four remaining Great Lakes states to the nation. An index value of one indicates parity with the nation, for example, while an index value of two indicates that industry wages in Illinois (or the Great Lakes region) are twice the national average. For example, the first row indicates that Illinois payroll wages in the Agriculture, Construction, and Mining Machinery sector lies at 2.88 times the national average while, in the four remaining Great Lakes states, the sector’s payroll lies at less than the national average—80 percent.
Table 4
Thank you to Wenfei Du and Thom Walstrum for assistance.
Footnotes
1 The authors use the U.S. Census definition of Midwest, which comprises Illinois, Indiana, Iowa, Kansas, Michigan, Minnesota, Missouri, Nebraska, North Dakota, Ohio, South Dakota, and Wisconsin.
2 Some observers have questioned the veracity of Illinois’ high unemployment rates for the post-2011 period to date, citing concerns about measurement error and possible changes in survey methodology. However, some corroboration of the reported unemployment rates is offered by reported first-time claims for unemployment insurance. Over the period from 2011 to date, the annual average of Illinois claims as a share of the national total increased from 3.6 percent to 4.1 percent. At the same time, the Wisconsin share fell from 3.4 to under 3.2, while Ohio, Indiana, and Michigan also fell. Similarly, these same data on UI claims within Illinois corroborate local area unemployment patterns within the state. That is, over the two initial years the recovery, the Chicago area unemployment rate gave ground to the remainder of the state; while gaining ground during the latter half of the recovery
3 See the appendix table at end for examples of some of the large industry employment sectors that differ between Illinois and the remainder of the Great Lakes region
4 As measured by permits filed to construct residential units, the Chicago MSA recovery has been weaker than other large MSAs in the region including Detroit, Des Moines, and Indianapolis


