Trends in Education and Income in Chicago
Harvard economist Edward Glaeser shows that education is one of the strongest predictors of urban economic growth. This is particularly the case for older cities like Chicago. One of the reasons for this is that a higher density of college-educated workers is associated with higher levels of worker productivity.
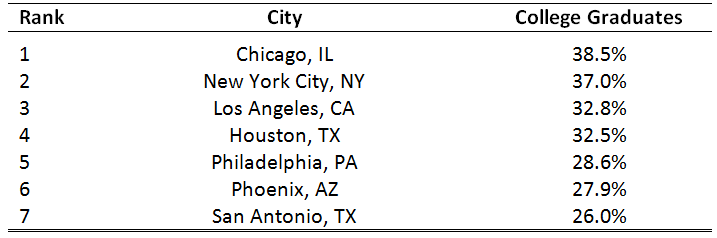
There is very good news for Chicago. Recent data for 2016 from the United States Census Bureau’s American Community Survey shows that the city of Chicago now has the highest percentage of college graduates of the seven largest cities in the United States (see Table 1). Almost 2 out of 5 adults twenty-five and older in Chicago have at least a bachelor’s degree. Chicago beats New York City, Los Angeles, San Antonio, Houston, Phoenix, and Philadelphia. Of the ten largest cities, only San Diego and San Jose have higher levels of educational attainment as measured by the percentage of adults with at least a bachelor’s degree.
1. College graduates of the population 25+, seven largest cities, 2016
If the sample is limited to non-Hispanic whites, Chicago even beats San Diego and San Jose, the home of Silicon Valley. For this population, over 3 in 5 have a college degree in Chicago. In some community areas in Chicago like Lincoln Park, Lakeview, and the Loop, about 4 out of 5 have a college degree.
One of the reasons for Chicago’s success in this arena is that the city of Chicago is an attractive place to live and work for college graduates, especially young grads. Over half of the young college graduates in the Chicago metropolitan area live in the city of Chicago. This is up from about forty percent in 1990.
Another reason is that migrants to Chicago are more likely to have a college degree. Last year about 3 of 4 migrants to Chicago from other states and from abroad had a college degree. Ten years ago only about 1 in 2 migrants to Chicago had a college degree. It is particularly noteworthy that in 2016 seventy-three percent of foreign migrants to Chicago had a college degree.
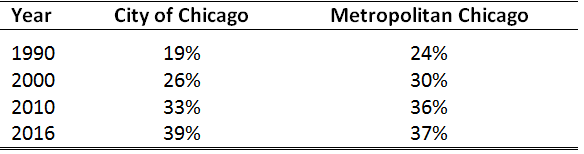
If one goes back in time, Census data indicates that adults in the city of Chicago were significantly less educated than their suburban counterparts. This is no longer the case. The percentage with a college degree in Chicago is higher now than in the suburbs of the Chicago metropolitan area although some suburbs have higher levels of attainment (see Table 2). For example, 2 out of 3 residents of Evanston have at least a bachelor’s degree.
2. College graduates of the population 25+, 1990-2016
Although non-Hispanic whites who account for about one-third of the population of Chicago are doing well, the situation for African-Americans and Hispanics is more mixed. Of the ten largest cities in the United States, African-Americans in Chicago rank seventh and Hispanics rank ninth in the percentage of adults with a college education.
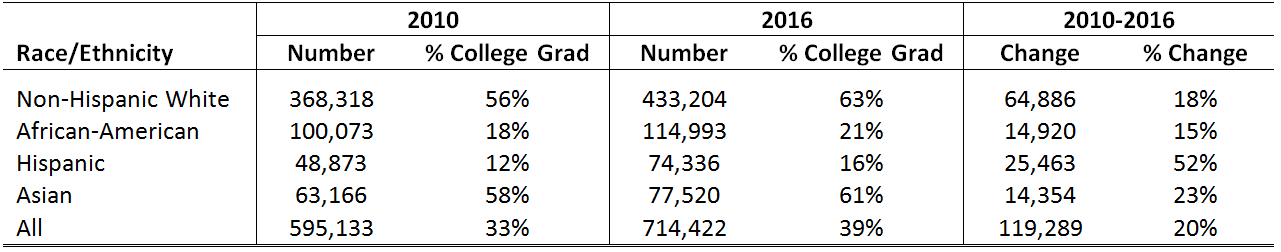
The good news is that both the percentage and number of college-educated African-Americans and Hispanics in the city of Chicago has increased since 2010. This is also the case for non-Hispanic whites and Asians. In Table 3, data are arrayed on the number and percentage of college graduates in the city of Chicago by race and ethnicity. The data indicate that the largest gain in the number of college graduates was for non-Hispanic whites followed by Hispanics. The largest relative gain was for Hispanics (over fifty percent) followed by Asians. Overall, there was a 20% increase in the number of college graduates in the city of Chicago between 2010 and 2016. Part of the increase is a result of growth in the number of non-Hispanic whites, Hispanics, and Asians in the city. For the African-American population, growth in the number of college graduates cannot be attributed to population growth because the number of blacks in the city declined by ten percent during the 2010-2016 period.
3. City of Chicago college graduates, 25+, by race and ethnicity in 2010 and 2016
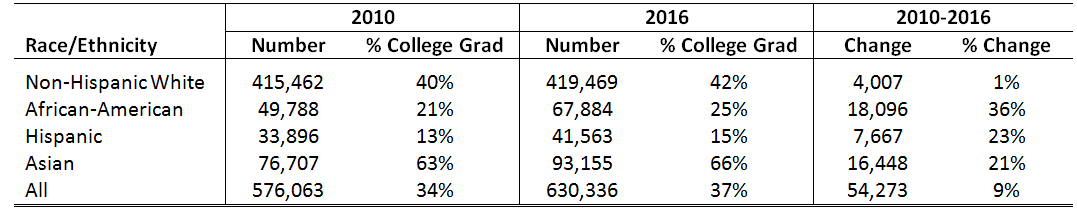
In suburban areas, the story is different, as shown in Table 4. For example, in suburban Cook County non-Hispanic whites are over twenty percentage points less likely to have a college degree than their counterparts in the city of Chicago. Further, there has only been a one percent increase in the number of non-Hispanic whites with a college degree in the suburbs of Cook County. This is partly a result of a seven percent decline in the non-Hispanic white populations in suburban Cook County. At the same time, there have been large increases in the number of African-American, Hispanic, and Asian college grads in suburban parts of Cook County. For example, for the 2010-2016 period, the African-American population in suburban Cook County increased twelve percent.
4. Suburban Cook County college graduates, population 25+, by race and ethnicity in 2010 and 2016
Further, Chicago public schools that disproportionately serve African-American and Hispanic families have improved considerably. Over the past ten years, CPS high school graduation rates have increased from fifty-seven percent to seventy-four percent. Of high school graduates, a higher percentage are going to college. Test scores are up as well. Low-income students in Chicago outperform other low-income students in other districts in Illinois. A Stanford study argues that CPS is the fastest-improving school district in the country.
It is worth noting that in the 1980s Secretary of Education Bennett called the Chicago public school system “the worst in the nation.” Although it is not clear if that was ever the case, it certainly is not now.
Although there is good news on education, the evidence on income is more mixed. This is partly a product of national trends over the past couple of decades. For the city overall, median real household income increased three percent last year. Since 2010, real income has increased close to eight percent although there is substantial variation by race and ethnicity. Non-Hispanic white income increased seven percent while Hispanic income increased almost ten percent. Although household income in the African-American community increased this past year, it is almost five percent lower in real terms since 2010. Over a longer period of time (since 1979) African-American income has declined even more (twenty-one percent) although non-Hispanic white income is up substantially (forty-three percent).
In the suburbs of Chicago, household income has also increased modestly (about three percent) this past year. Over a longer period of time, non-Hispanic white income in the suburbs is about where it was at in 1979. However, median household income for African-Americans in the suburbs has remained constant since about 1979.
Although education has increased in the city of Chicago relative to suburban Chicago, median household income in suburban areas is still significant higher than in the city of Chicago. In 2016, household income in the city was eighty percent of median household income in the metropolitan area. This is up two percentage points since 2010.
These changes have driven other important changes in Chicago. On the positive side, the high concentration of talent in parts of the city is resulting in high skilled jobs following the talent, especially to areas in and around the central business district. Further, more educated and affluent African-Americans and Hispanics have been able to move to suburban locations for better opportunities for their families.
On the negative side, the large and continued decline in income in the African-American community in many parts of the city of Chicago is cause for concern. This is resulting in well over half of the children in community areas like Englewood and West Garfield Park growing up in poverty. It is also resulting in large population declines in communities like Englewood and West Englewood.


