Chicago City Trends
The fortunes of the city of Chicago have become clouded in recent years as concerns over its weakening finances and heavy debt obligations have grown. The tally for the unfunded public employee debt obligations of Chicago’s overlapping units of local governments (including those for public schools, parks, and county services) is now approaching $30 billion. Moreover, the city government has been criticized for its practices of funding current public services with proceeds from the issuance of long-term debt and the long-term leases of public assets (such as its parking meter system). However, faith in Chicago’s ability to address its debts has not fallen so far as that in Detroit’s, chiefly because the Windy City’s economic trends display more vibrancy.
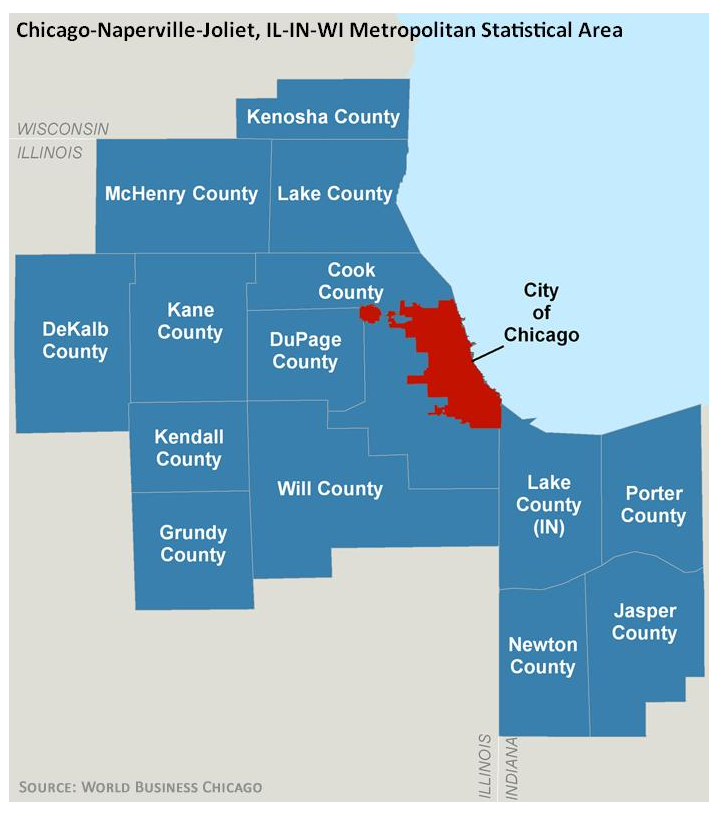
Population change is a prominent indicator of the health of an urban economy because it reflects a city’s ability to hold on to its residents (as opposed to losing them to the suburbs or other locales). Over the past few decades, similar to other central cities, Chicago has experienced an erosion in its population share of the broader metropolitan statistical area (MSA);1 in contrast, the surrounding suburbs have seen their share climb. According to the U.S. Census, Chicago held 38% of the MSA’s population in 1980, with this share falling to 35% by 1990; in the subsequent 20 years, Chicago’s population share of the MSA decreased another 3 percentage points per decade, reaching 29% by 2010 (see table below). During the 1980–2010 period, Chicago lost a total of over 300,000 residents. At the same time, suburban Chicago gained close to 2 million in population. Since 2010, the city of Chicago’s population and population share of the MSA have strengthened somewhat, though the (off-Census year) estimates are probably not as reliable.
Table 1. Population of the City of Chicago and the Chicago Metropolitan Statistical Area (MSA)

Figure 1

While population trends can be telling for a city’s prospects, they can also belie changes in its residents’ wealth and income. Despite the city of Chicago’s population loss over the past few decades, its economic trends have been generally more encouraging.2 Household income is an important indicator of Chicago’s fortunes relative to those of its suburbs. In 1990, median household income in the city was just 67% of the median household income in suburban Chicago. By 2010, this income ratio had climbed to 73% (see table below). Decomposing household income statistics by (self-reported) racial/ethnic group reveals that this trend was pervasive for the three largest groups: non-Hispanic white, black, and Hispanic. The ratio of city median income to suburban median income among white households experienced the greatest change; it rose from 77% in 1990 to 98% (near parity) in 2010.
Table 2. Median household income ($) for Chicago and suburbs, 1990-2010

Source: Authors' calculations based on data from the U.S. Census Bureau 1990 and 2000 Census of Population and Housing, and the American Community Survey 2010.
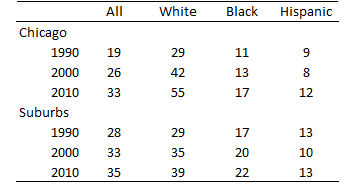
These robust trends are echoed by Chicago’s rising share of adults aged 25 and older who have attained at least a bachelor’s degree. In 1990, among adults aged 25 and older, 19% of those residing in the city had attained a four-year college degree versus 28% of those residing in the suburbs (see table below). By 2010, Chicagoans in this age demographic had almost reached the same share in this regard as their suburban counterparts (33% for city residents versus 35% for suburban residents). The non-Hispanic whites again experienced the greatest change among the three largest racial/ethnic groups. In 1990, 29% of the white city population aged 25 and older had a four-year college degree—the same percentage as the white suburban population in this age demographic; however, by 2010, 55% of such white city dwellers had a bachelor’s degree, while 39% of their white suburbanite counterparts did. Between 1990 and 2010, the city’s black population also made substantial gains in education, as evidenced by the share of black adults aged 25 and older with a bachelor’s degree having risen from 11% to 17%.
Table 3. Percentage of Chicago population aged 25 years or older without a Bachelor's degree

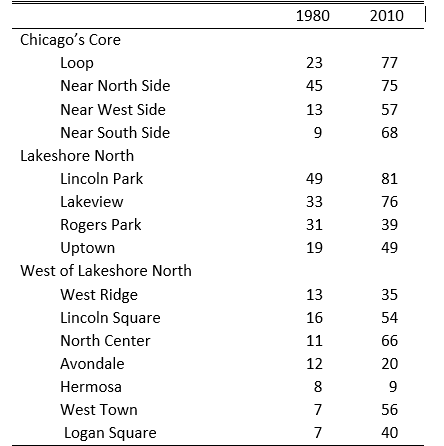
By “drilling down” through the data to examine specific neighborhoods, we can see how geographically concentrated the city’s gains in college-educated adults aged 25 and older have been. These gains have been highly concentrated in Chicago’s central business district (“the Loop”) and the surrounding areas, as well as the neighborhoods west of Chicago’s northern lakeshore. As shown in the table below, dramatic gains in the college-educated population were seen in the Loop and the neighborhoods just south, west, and north of it. For example, the Near South Side saw an increase in the share of adults with a four-year college degree climb from 9% in 1980 to 68% in 2010. No less dramatic were such gains in Chicago’s neighborhoods west of its northern lakeshore: The shares of the college-educated population there typically doubled or tripled between 1980 and 2010 (in the case of the North Center neighborhood, this share increased sixfold—from 11% in 1980 to 66% in 2010).
Table 4. Percentage of Chicago population aged 25 years or older without a Bachelor's degree, by community area and year

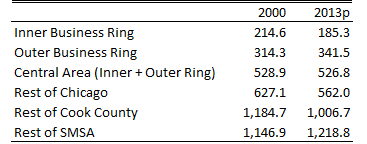
As one might expect, many college-educated Chicago residents work in proximity to their residence. Of those living in the Central Area and Mid-North Lakefront, an estimated 57% work in the Central Area of Chicago and 79% work somewhere in the city.3 Of those who do work in the Central Area, an estimated 19% travel to work by driving alone (as opposed to walking, public transit, bike, and carpooling); this percentage is much smaller than the nearly 70% of metropolitan Chicago workers who travel to work by driving alone.4 The trends highlighted thus far point to the fact that the city of Chicago draws and retains many jobs. By one count, the city of Chicago’s Central Area is the domicile of over half a million jobs. As seen below, job counts in the Central Area have remained fairly constant over the past 13 years, even while job levels in the remainder of the city and in the remainder of Cook County have been falling.
Table 5. Payroll jobs in Chicagoland, by location (thousands)

Source: Illinois Department of Employment Security, Where Workers Work database, available online.
Meanwhile, compensation levels per job have continued to climb in Chicago’s Central Area, reflecting a work force with greater skills and education. Annual compensation per worker on the payroll in Chicago’s Central Area exceeds that of the overall MSA by 50%.
Table 6. Annual compensation per payroll job (and ratio to MSA)

Source: Authors' calculations based on data from the U.S. Census Bureau, County Business Patterns (zip code files).
Many of the trends shown here bode well for the city of Chicago, despite the fiscal challenges it currently faces. To be sure, many large central cities in the Midwest, including Detroit, are experiencing strong growth of both jobs and households centered around their central areas and downtowns. In this, the central Chicago area enjoys a strong start.
Footnotes
1 Current and historical delineations of MSAs are available online.
2 This is not to say that all parts of the city have been on the economic upswing. Several Chicago neighborhoods have seen severe deterioration in wealth and income, as well as in living conditions, as evidenced by increasing incidences of homelessness and crime in certain areas in the past few decades; see, e.g., this blog post.
3 This statement covers 113,000 workers living in these areas as of the year 2000. Estimates were pulled from Regional Transportation Authority Mapping and Statistics (RTAMS) and are based on the Census Transportation Planning Package (CTPP), “which is a special tabulation of the decennial U.S. Census for transportation planners” and “contains detailed tabulations on the characteristics of workers at their place of residence (‘part 1’), at their place of work (‘part 2’), and on work trip flows between home and work (‘part 3’)”. Workers who work at home are excluded.
4 Estimates are from RTAMS and are based on the Census Transportation Planning Package (CTPP).


