Office Space Trends in the Seventh District
Will commercial real estate (CRE) be the next stressor in the financial system? That’s the question that some are asking, especially with a significant percentage of CRE loans maturing in a high interest rate environment that makes refinancing properties more difficult. Adding to the concern is the amount of CRE floating rate debt that is set to adjust in the current high interest rate environment but was underwritten when interest rates were at or near their recent lows.
While some banks have increased their loan loss reserves, and the largest banks’ holdings of CRE debt is relatively small, if the high interest rate environment endures and property values are priced significantly lower, bank balance sheets could be negatively impacted.
The CRE sector under the greatest scrutiny is office space. Per Kastle Systems’ measure of office occupancy, the post-pandemic return-to-office trend has plateaued at around half of pre-pandemic levels.1 If office occupancy rates don’t materially improve as loans mature and leases come up for renewal, a lower valuation of properties will likely occur. The repricing (for potential sales or valuations) of properties will depend on building type, age, and location. If a lower repricing of properties occurs, research shows that rents will experience a negative shock as well, negatively impacting cash flow from buildings to landlords and lenders.
In this blog post, I examine on-the-ground conditions in the CRE office sector in the Seventh District’s major cities of Chicago, Des Moines, Detroit, Indianapolis, and Milwaukee. I use often-cited measures of the health of the CRE office sector using CoStar data, comparing pre-pandemic trends with year-to-date levels of a variety of metrics including vacancy rates and property values.
I show that office space trends vary along some dimensions across the District. For example, in Chicago, downtown properties carry greater risk of defaulting than other areas of the city, whereas in Detroit suburban and non-central business district (CBD) urban office spaces carry greater risk of defaulting. The increased risk comes from rising vacancy rates as a significant percentage of office properties mature over the next few years. As this blog post2 points out, lower occupancy rates (higher vacancy rates) lead to reduced cash flow into a property which if low enough, could trigger a series of events that might result in loan defaults.
Generally, vacancy rates have risen faster in higher quality (class A) buildings than in lower quality (class B and class C) buildings. I focus on office vacancy rates, which can be defined as the percentage of units available to rent that are vacant or unoccupied as a percentage of the total number of units available in an office building.
Vacancy rates
To set the scene, figure 1 shows the amount of office space inventory in each Seventh District market as defined by CoStar. Not surprisingly, Chicago has the largest amount of office space with Detroit a distant second. While Des Moines has the lowest amount of office space, it had the highest percentage increase in office space in the past five years, followed by Indianapolis and Chicago.
1. Office space by market
| Market | 2018:Q1 (sq. ft.) | 2023:Q1 (sq. ft.) | Five-year change (%) |
| Chicago, IL | 498,560,991 | 509,883,442 | 2.3 |
| Des Moines, IA | 40,440,144 | 41,729,725 | 3.2 |
| Detroit, MI | 199,218,969 | 200,707,832 | 0.7 |
| Indianapolis, IN | 107,327,218 | 110,241,452 | 2.7 |
| Milwaukee, WI | 77,803,292 | 78,526,101 | 0.9 |
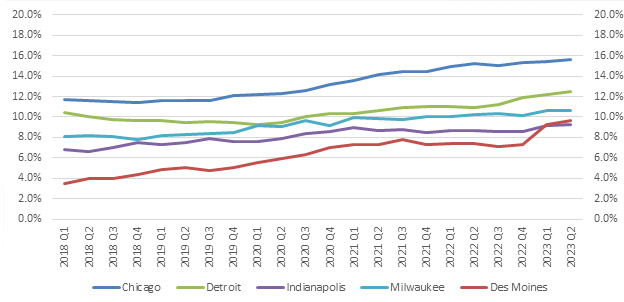
Figure 2 shows the office vacancy rate for the Seventh District’s major markets. Except for Detroit, office vacancy rates had inched higher from 2018 through 2020. Compared with office vacancy rates from the early-to-mid 2010s, office vacancy rates are currently lower. Since 2020, office vacancy rates have risen above their respective pre-pandemic levels. Also, none of the markets have shown any noticeable sign of returning to their pre-pandemic levels. However, trends have differed by market. Des Moines’ office vacancy rate has almost tripled, and Chicago and Detroit have seen steady rises in office vacancy rates since the beginning of the pandemic. Office vacancy rates in Chicago, Des Moines, and Milwaukee are at or close to their historical highs.3 However, Indianapolis had higher office vacancy rates in 1990 and 2003. And Detroit experienced its peak office vacancy rate in 2010, one year after GM and then-Chrysler exited bankruptcy and two years before Detroit entered into a consent agreement with the State of Michigan, a precursor to the city’s 2013 bankruptcy filing.
2. Office vacancy rates by Seventh District market
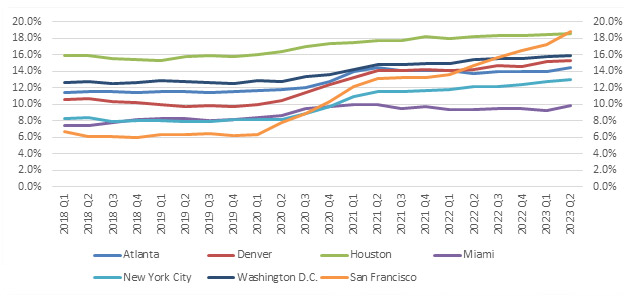
How do the Seventh District’s office space trends compare to those of other major U.S. markets? Figure 3 presents office vacancy rates in select major U.S. markets to capture geographical diversity within the top 20 U.S. office markets by asset value. New York and San Francisco have gotten the most attention since the onset of the pandemic. New York is the highest value market with its share of high-profile vacancies, but arguably the San Francisco market stands out even more with its office vacancy rate more than tripling as the tech sector hasn’t returned to fully occupy its pre-pandemic space. Elsewhere, the Washington DC market ranks third by asset value and even with many government employees still working remotely, its office vacancy rate has only moved slightly higher with most of the vacancies concentrated in older buildings. In Texas, the past boom-and-bust cycles of the oil and gas industry have left Houston with an elevated office vacancy rate. Atlanta’s office market contains many national and regional headquarters and while its office vacancy rate is elevated, it hasn’t reached its post-Great Recession high. Miami is the smallest of the markets here by asset value and has benefited from in-migration from the Northeast Corridor, which has been well documented. Denver’s office market has trended up in recent years, moving into the top 20 by asset value. Its office vacancy rate has also increased significantly since the pandemic, along with New York’s. Both these cities’ trends show similar patterns to what we have seen in Chicago and Detroit. The other cities’ more modest increases are similar to what’s occurred in Indianapolis and Milwaukee.
3. Office vacancy rates by select CoStar market
Submarket vacancy rates
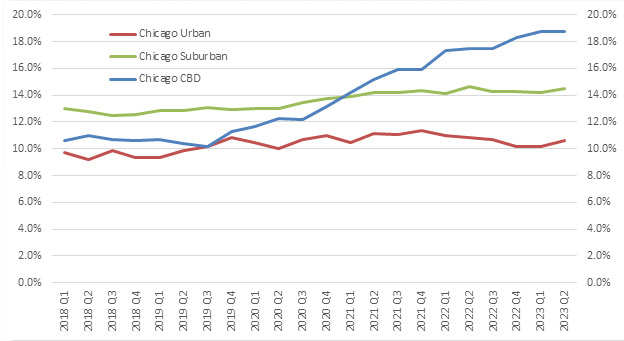
When we drill down into sub-markets that only include central business districts (CBDs), urban (other urban areas outside of the major city’s CBD), and suburban areas, we can see indications that there has been some movement of CBD office tenants to other locations within a market that are closer to where employees reside. This trend is apparent in Chicago (see figure 4). Before 2020, Chicagoland’s suburban vacancy rate was modestly higher than its CBD and urban office vacancy rates. Since 2020, office vacancy rates haven’t changed much outside of Chicago’s CBD, except for a slight rise in the suburban office vacancy rate. However, as with some of the other major cities, Chicago’s CBD office vacancy rate has risen sharply since the beginning of the pandemic.
4. Chicagoland office vacancy rates by location type
5. Metro Detroit office vacancy rates by location type
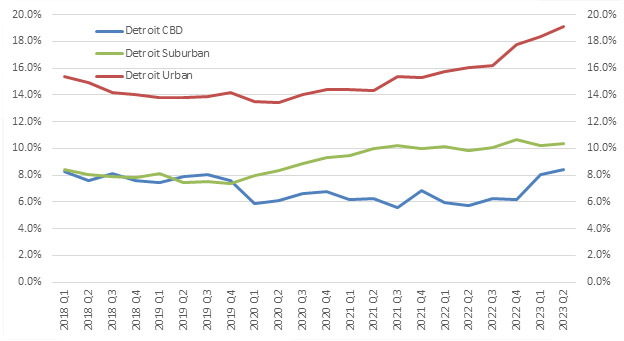
The increase in Chicago’s office vacancy rate can be attributed mostly to the rise in its CBD office vacancy rate. Approximately 38% of the Chicago market’s office space is in the CBD versus just 18% for Detroit. So the rise in office vacancies isn’t just an issue for the downtowns of major cities within a market, but also for the areas surrounding those downtowns.
Vacancy rates by space quality
Office space quality is divided into three classes. Class A space is the highest quality, class B is medium, and class C is the lowest quality. Does the quality of the space make a difference when it comes to persuading tenants to maintain their holdings? Class A space would likely contain more up-to-date configurations, such as the open floor plan designs and collaboration spaces that were becoming popular before the pandemic. This also means that class A space can’t easily be converted to other uses, putting additional pressure on building owners and leasing agents to fill the space with new tenants.
Figure 6 shows office vacancy rates for class A space in the Seventh District’s major markets. Chicago’s class A office vacancy rate rose in line with the increase in its CBD office vacancy rate. The same inference can be drawn for Des Moines and the substantial increases in its class A and CBD office vacancy rates, respectively. Meanwhile, increases in class A office vacancy rates in Detroit (urban), Indianapolis (CBD), and Milwaukee (suburban) coincide with the more visible increases in those markets’ submarkets.
6. Class A office vacancy rate by Seventh District market
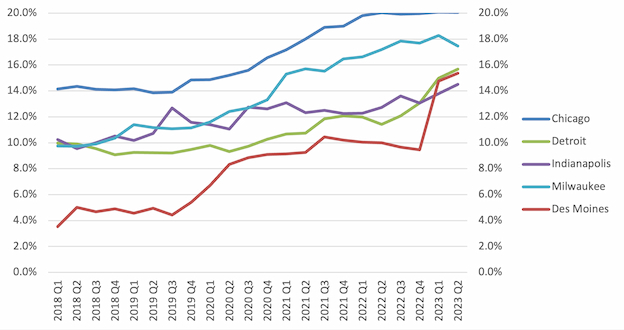
At least in the Seventh District’s major markets, class A office space does not seem to be enough of an enticement to prevent tenants from leaving. In fact, in each of the Seventh District’s major markets, the class A office vacancy rate is now higher than the combined rate for class B and class C office space. In the Seventh District’s major markets, there has been a greater percentage of class A office space left vacant than class B and class C office space combined since 2020.
Capital values
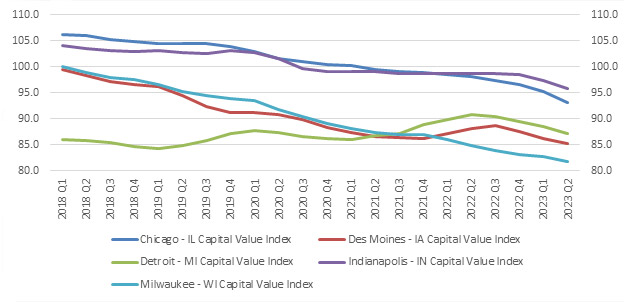
Office vacancy rates have increased due to tenants leaving, so how has tenant outflow impacted office building property values? CoStar has a capital value index for markets with quarterly updates of estimates of asset values. This index includes sales prices from recent transactions, but other factors as well in its property valuations. Figure 7 shows the trend of office capital values over the past five years for the Seventh District’s major markets.
7. CoStar capital value index4 for the Seventh District’s major markets
Source: CoStar.
Since 2020, excluding the Detroit market, office spaces have already lost value, though the trend was already negative pre-pandemic. Milwaukee and Chicago have suffered more than or close to double-digit losses in asset values since 2020. More modest asset value declines have occurred in Des Moines and Indianapolis. If asset value declines were to bottom out or even slow from their current pace and bottom out in the medium term, the level of losses would likely be manageable for all parties involved, including property owners, landlords, financial institutions, nontraditional lenders, and local governments on some properties. However, some research suggests that trends in occupancy and increasing refinance rates imply that office space will be revalued at dramatically lower levels, which would have negative economic implications for communities and the financial system.
What are the implications of these trends for communities and the financial system?
The Seventh District’s major office markets have seen office vacancy rates rise since 2020 as office tenants have either moved out or downsized out of their existing holdings. The increase in office vacancy rates varies by each area’s submarket—with some markets having experienced quicker rises in their CBD office vacancy rate (Chicago, Des Moines, Indianapolis), while some others (Detroit and Milwaukee) have experienced more pronounced increases in their urban and suburban office vacancy rates. Class A office vacancy rates have increased in recent years in each Seventh District city.
When comparing Seventh District markets with the entire U.S. market, Chicago is at greater risk of property loans defaulting in its CBD segment, while Detroit’s elevated default risk lies in its urban markets. The elevated default risks come from increasing vacancy rates and tenants failing to make rent payments, putting properties into special servicing. According to this report, the Chicago MSA has one of the higher special servicing rates across all (not just office) commercial mortgage-backed securities. Special servicing rates increase when the number of missed loan payments increase, increasing the loan’s probability of defaulting5. Also, research indicates that a market-wide decline in vacancy rates increases a borrower’s willingness to continue paying off the mortgage, reducing the probability of default.
One consistent risk to office markets lies around when loans mature and leases expire. Some of the major U.S. and Seventh District markets have a significant amount of office space leases set to mature and turn over in the next couple of years. Specifically, in the next 18 months, New York, Washington DC, Chicago, and Atlanta are among the top ten MSAs with office space leases scheduled to roll over. According to CRED IQ’s measure of distressed loans (special servicing and delinquent) within a property as a percentage of all properties, Chicago has one of the more distressed office markets among the MSAs it tracks.
With floating-rate debt, borrowers have to make the choice to limit their losses or extend the loan, taking a chance that interest rates will decrease. Meanwhile, the maturation of fixed-rate debt means larger balloon payments at maturation, plus additional expenses to refinance the loan at a higher interest rate and higher interest-only payments. How will these additional costs impact building tenants and owners?
The fallout from maturing CRE office loans will depend largely on tenants’ return-to-office policies. A spring 2023 survey indicated that 60% of respondents are in a steady state with their return-to-office policy, and 38% of respondents expect to increase their office utilization. Within the number expecting to increase their office use, 71% are looking to do so by the second half of 2024. But it is not clear which types of tenants will be increasing their office utilization: the 53% of respondents practicing a voluntary or mandatory less than 50% return-to-office policy or the 42% of respondents already mandating that employees come into the office more than 50% of the time.
If office utilization doesn’t pick up and vacancies increase as tenants leave, that puts building owners and landlords under financial pressures that could have larger ramifications. “Zombie” office space could lose much of its value. Considerable markdowns in CRE office real estate values would impact the financial institutions that carry that real estate on their books. Regional and smaller banks could be disproportionately impacted as many have significant exposure to the CRE office segment. Let’s also not forget the property tax revenue that state and local government entities will forego in the wake of CRE office property devaluations.
Clearly, turmoil in the CRE office sector has the potential to have widespread economic impacts.
Notes
1 See this report from Kastle Systems. Kastle’s barometer focuses on the number of employees using office space on a given day, whereas the office vacancy rate measures vacant space as a percentage of the total space available in the building.
2 See https://www.financialresearch.gov/the-ofr-blog/2023/06/01/five-office-sector-metrics-to-watch/
3 Based on CoStar’s data, which goes back to 1982.
4 2008Q4 = 100
5 See Finance, Professional Perspective - Special Servicing of CMBS Loans During Business Disruptions (bloomberglaw.com)


