The Federal Reserve’s policy tools rely on financial markets to transmit changes in monetary policy to the real economy. For instance, changes in short-term interest rates set by the Fed and faced by financial institutions—e.g., the federal funds rate—affect longer-term rates paid by firms and households. These rate changes in turn impact borrowing and spending decisions. Understanding the current state of financial conditions is, thus, both critical to central bankers and of interest to the wider public.
In this article, we are interested in comparing the Chicago Fed’s measure of financial conditions, the National Financial Conditions Index (NFCI), with the Federal Reserve Board’s measure of financial conditions, the Financial Conditions Impulse on Growth (FCI-G) index, to better illustrate the link between the NFCI and real economic activity. We find that the NFCI provides real-time indications of future changes to the FCI-G, further demonstrating it to be a useful barometer of the impact of financial conditions on future economic growth.
The NFCI: Measuring financial conditions and financial stress
Introduced in 2011, the Chicago Fed’s NFCI, which is released on a weekly basis, was designed to measure U.S. financial conditions in real time. The index helps market participants and policymakers assess the health and resilience of the highly interconnected financial system and has been used by others to help determine the impact of financial stress on the broader economy.1
The NFCI uses a statistical procedure called dynamic factor analysis to synthesize over 100 indicators into a summary measure of U.S. financial conditions. The index is scaled so that its mean is zero and its standard deviation is one over a sample period that begins in 1971. Thus, positive NFCI readings indicate tighter-than-average financial conditions, while negative readings indicate looser-than-average conditions, with the deviation from average conditions measured in standard deviation units.
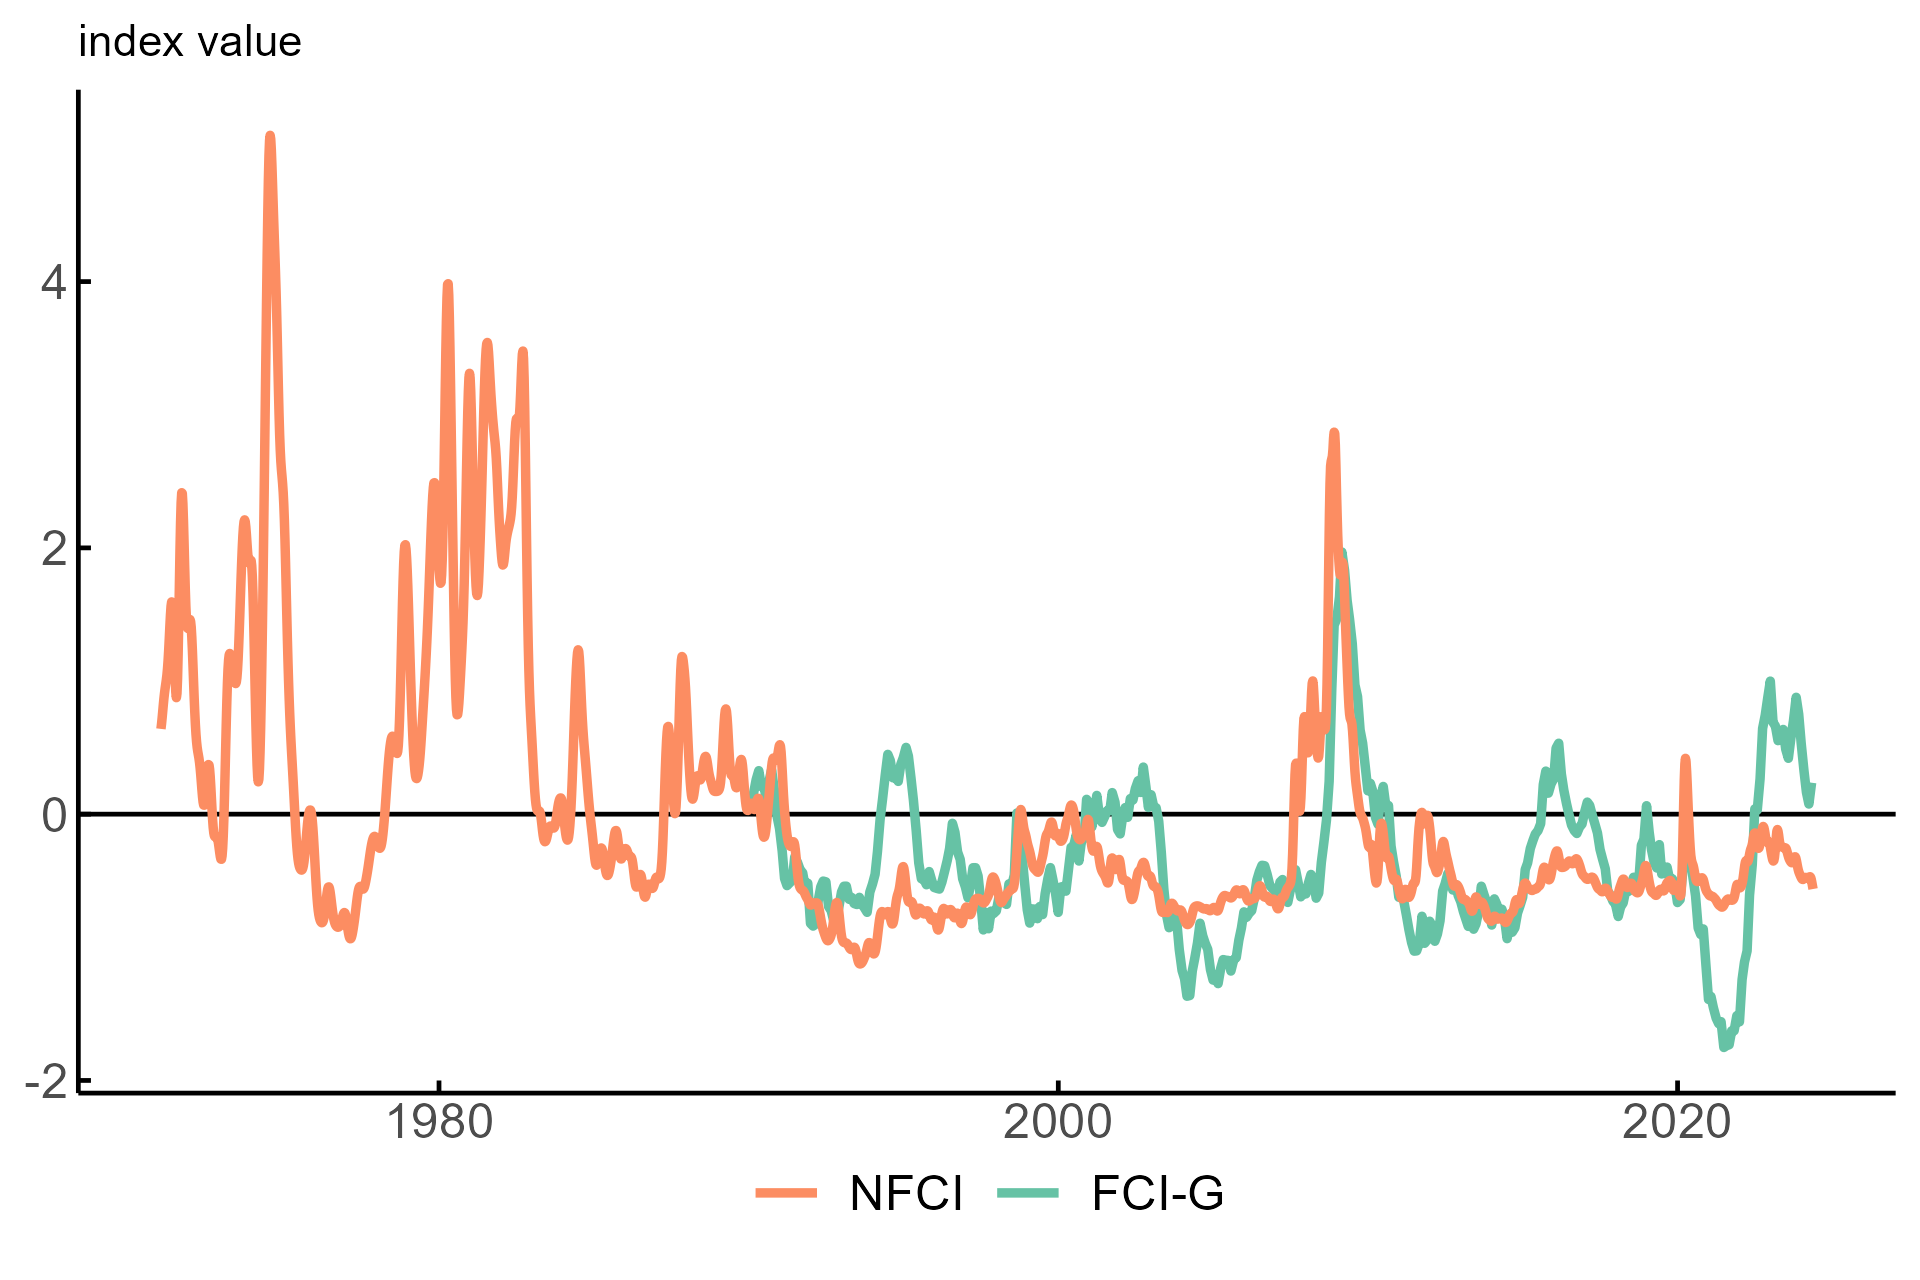
Market commentators often say that financial markets “take the stairs up and ride the elevator down,” as they tend to experience long periods of calm followed by short but intense bouts of volatility. This behavior in financial markets can be clearly seen in the history of the NFCI (the orange line in figure 1); note that markets “riding the elevator down” is associated with a large increase in financial stress and thus a substantial increase in the NFCI. The NFCI displays quite a few large spikes in its history during well-known periods of financial stress, leading to a significant rightward skew in its distribution and causing its mean (or average) value to be significantly higher than its median (or typical) value. This fact means that the NFCI historically has been below zero about 70% of the time.
1. Historical time series of the NFCI and FCI-G

Sources: Federal Reserve of Chicago and the Board of the Governors of the Federal Reserve System.
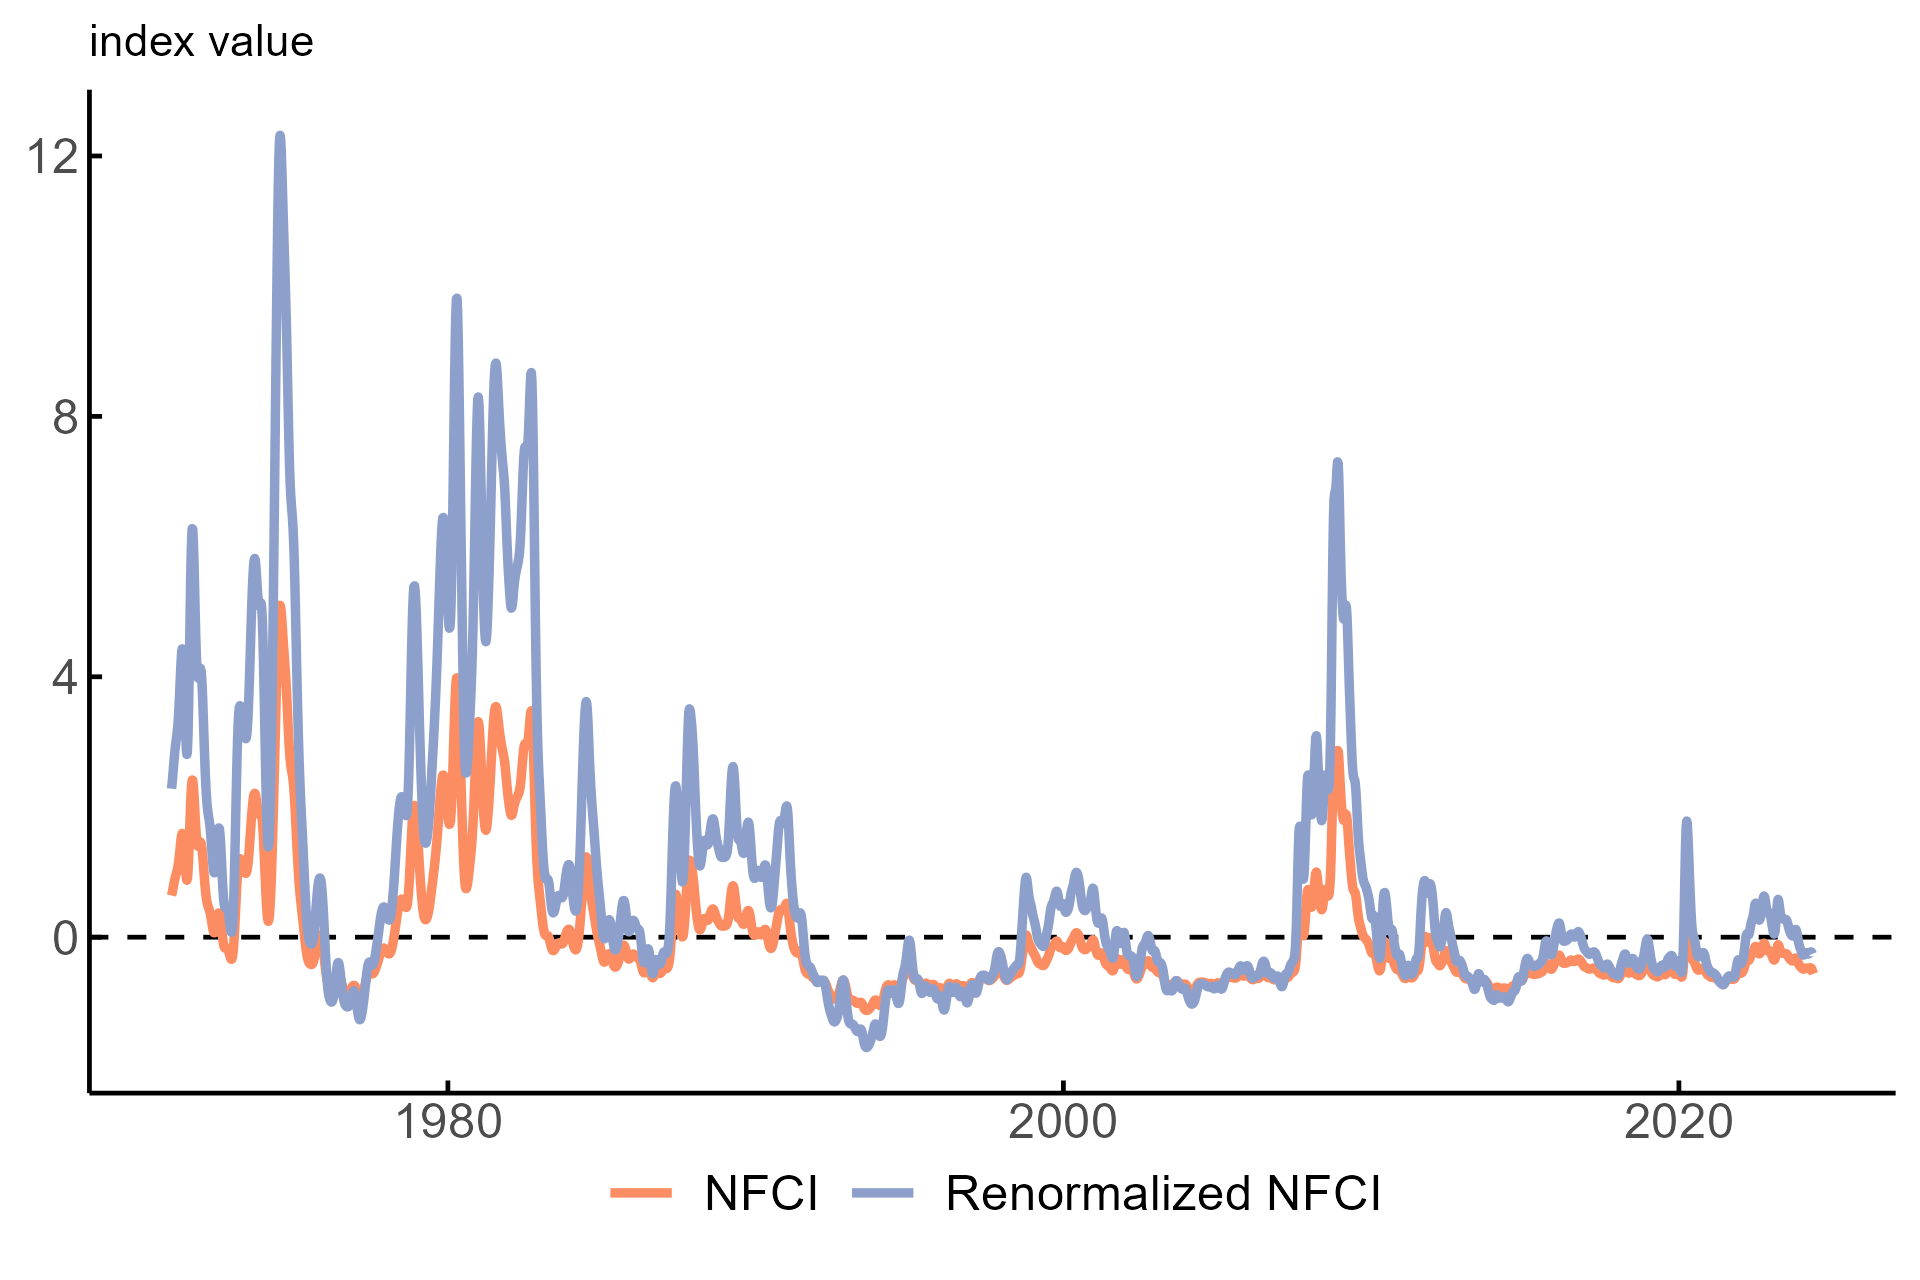
However, this scaling of the NFCI is solely meant to facilitate its interpretation relative to past periods of extreme financial stress.2 An alternative normalization that scales the NFCI based on the median3 may be more appropriate if one is instead looking to measure current financial conditions relative to a more typical historical outcome. Such an alternative normalization of the NFCI results in what we call the “renormalized NFCI,” which is shown in comparison with the traditional NFCI in figure 2.
2. Historical time series of the NFCI and the renormalized NFCI

Source: Authors’ calculations based on data from the Federal Reserve of Chicago.
We think of this renormalized (median-based) NFCI as capturing tighter-than-typical or looser-than-typical financial conditions as opposed to tighter-than-average or looser-than-average conditions like its traditional (mean-based) counterpart. Most of the time, both ways of looking at financial conditions lead to similar interpretations. The last few years, however, are an exception: Financial conditions have often been tighter-than-typical (i.e., they’ve been above the median), although not tighter-than-average (i.e., they’ve been below the mean).
The FCI-G: Measuring the expected impact of financial conditions on economic growth
While there is evidence that the NFCI is useful in forecasting future real gross domestic product (GDP) growth and in predicting recessions, this information does not directly affect the way the index is measured.4 In other words, neither the NFCI nor the renormalized NFCI on their own are designed to provide a direct estimate of the expected impact of current financial conditions on the broader U.S. economy.
In contrast, the Federal Reserve Board’s FCI-G, a monthly index introduced in 2023 and shown as the green line in figure 1, directly maps current financial conditions to their expected impact on the broader economy. In other words, the FCI-G by construction is linked to real GDP growth, as it combines changes in a much smaller set of seven financial variables (versus the NFCI’s set of 105) with those seven variables’ expected impact on real GDP growth based on the Board’s modeling (in particular, its FRB/US model). When the FCI-G is positive, it indicates that financial conditions are a headwind to economic growth over the coming year, while a negative FCI-G value indicates a tailwind instead. Given this construction, the value of the FCI-G can be directly interpreted as an estimate of the magnitude of the expected impact of current and past financial conditions on real GDP growth a year from now.
We are interested in comparing the FCI-G with the NFCI as a way of making more explicit the link between the NFCI and broader economic activity. The sheer number of financial variables in the NFCI makes it infeasible to directly trace out the growth impact of each variable, like the FCI-G does with its considerably smaller number of variables. But if the weekly NFCI, on account of its broader coverage of the financial system, contains information that may help to predict the future direction of the monthly FCI-G, then the timelier NFCI releases could be informative of the transition of financial conditions from headwind to tailwind—and vice versa—that the FCI-G is designed to capture.
Is the NFCI a leading indicator for the FCI-G?
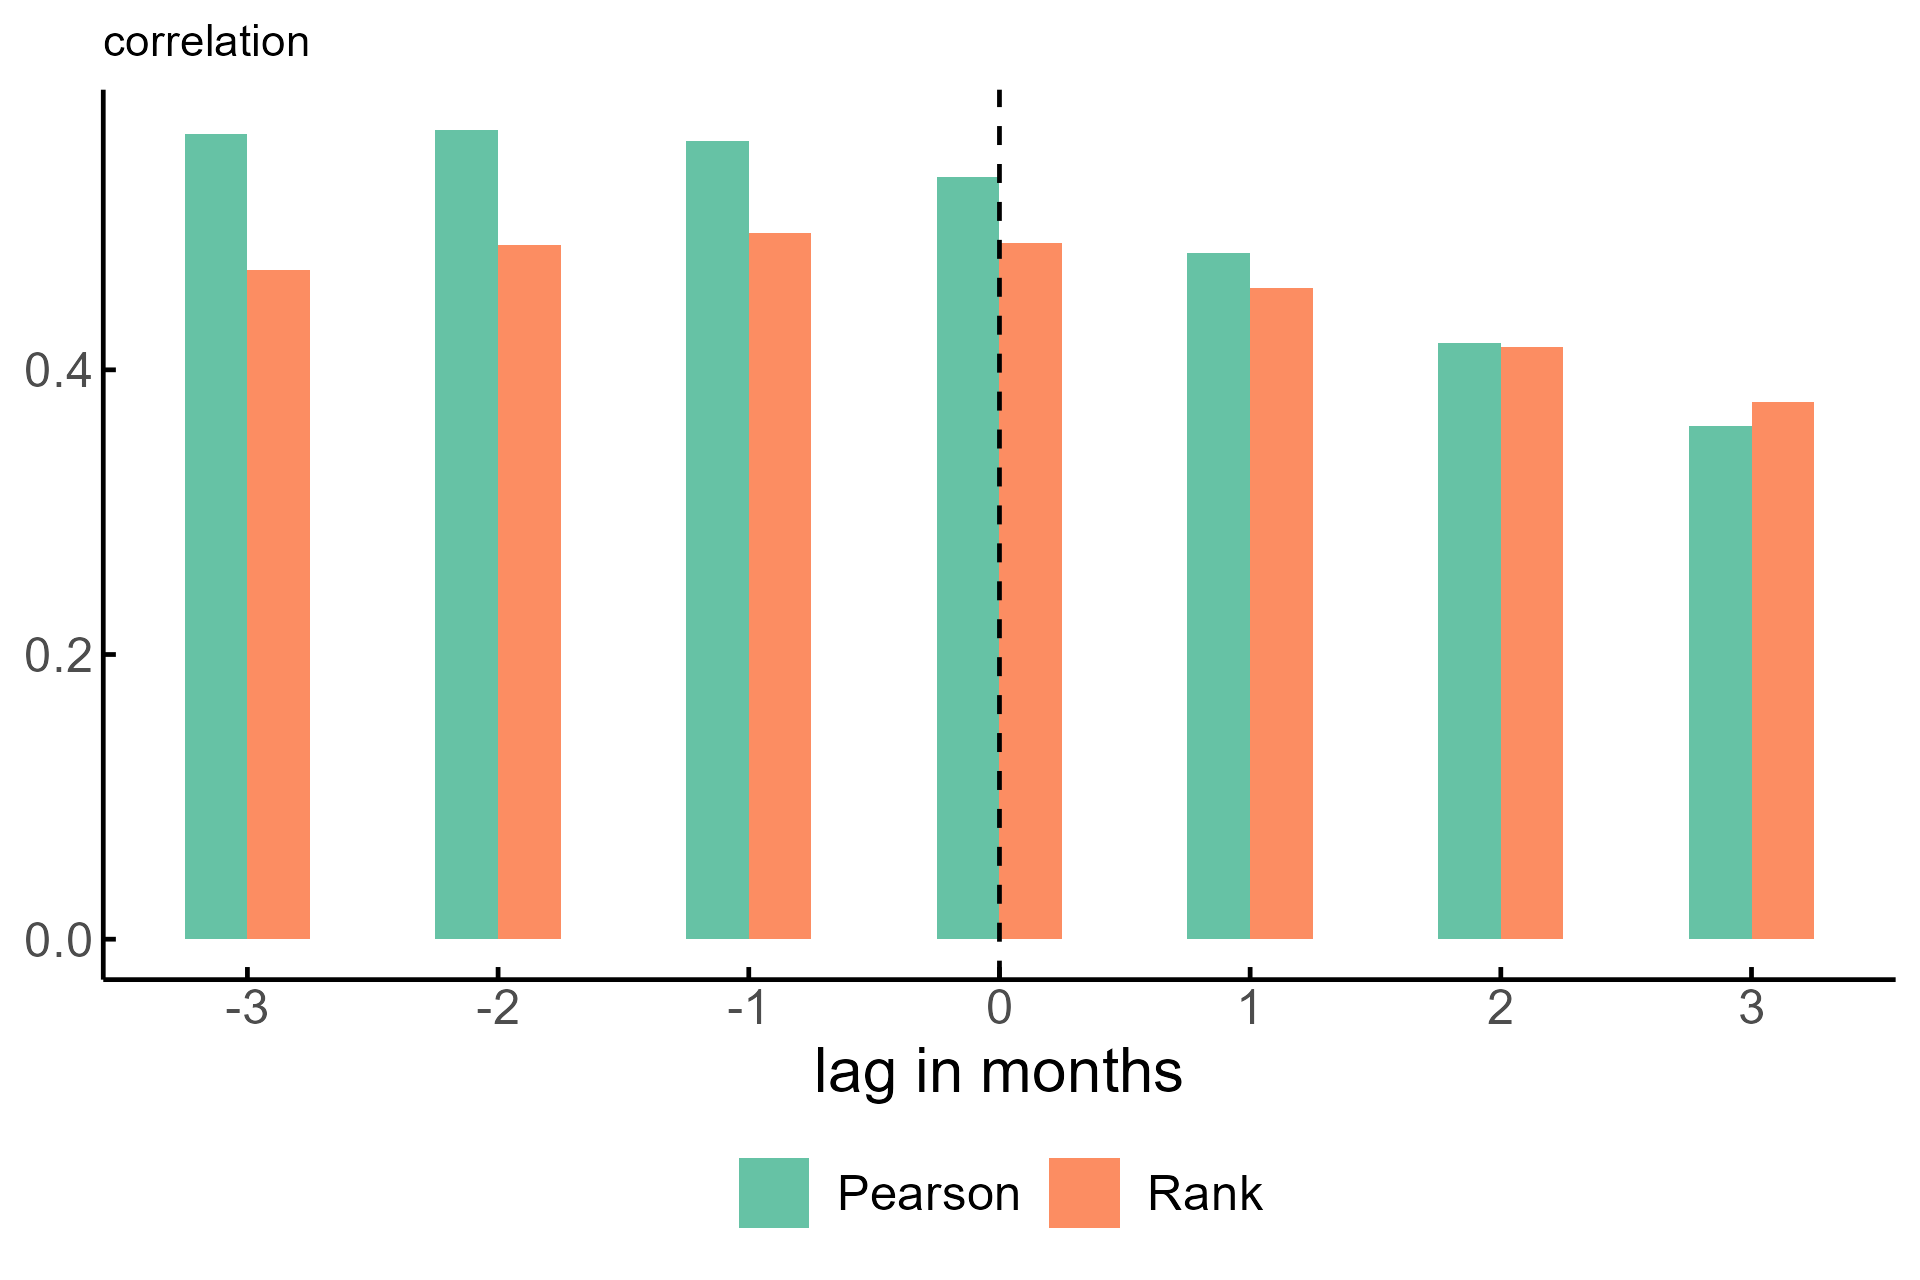
To address the fact that the NFCI is released weekly and the FCI-G is released monthly, we look at the latest NFCI value at the time of each FCI-G reading. This is equivalent to looking at the final week in each month and helps align the two series such that we can look at their cross-correlation at different points in time (in both the past and future). Figures 3 and 4 then show the Pearson correlation measure, i.e., the traditional correlation coefficient, between the NFCI at time t + x (where x is a measure of the time to a month in the near past) and the FCI-G at time t.5 For example, the bar at t = –1 indicates the correlation between the current NFCI and the FCI-G observed next month, while the bar at t = 1 indicates the correlation between the current FCI-G and the NFCI observed next month. These coefficients summarize in a statistical sense how related the two series have been historically. Higher values at negative lags (i.e., leads) indicate that the NFCI is likely to be predictive of the future direction of the FCI-G.
Given the statistical properties of the NFCI noted previously—in particular, that the NFCI displays large positive outliers—we use an alternative correlation coefficient that is more robust to outliers: the rank (Spearman) correlation. Comparing these to the typical Pearson correlation measure lets us see how sensitive our results are to the handful of extreme periods of financial stress shown in figure 1. The two different types of correlations (Pearson and rank) shown in figure 3 generally peak at a lead of about one to two months, although the slightly lower and closer-to-contemporaneous (i.e., peaking near zero) rank correlations indicate that the isolated periods of extreme financial stress play an outsized role in this result. Still, the cross-correlations suggest that the NFCI seems to lead the FCI-G, even outside of these periods of elevated financial stress.
3. Lead/lag relationship between NFCI and FCI-G, 1990–2024

Sources: Authors’ calculations based on data from the Federal Reserve of Chicago and the Board of the Governors of the Federal Reserve System.
One major concern with the analysis shown in figure 3 is that the NFCI updates its full history upon every release. As monthly and quarterly data trickle in, the NFCI’s perception of current and past financial conditions can change. The correlation coefficients in figure 3 compare this fully revised NFCI series to the FCI-G series.6 However, this is not what a user of the NFCI would have access to in real time. For instance, an observer on April 1, 2020, would see the NFCI at 0.05 and believe that financial conditions had just crossed the threshold into “tighter than average.” Armed today with the full history of NFCI revisions, we see that this threshold was crossed on March 13, 2020. Since the NFCI is designed to give a real-time reading of current financial conditions, it is important to account for what a real-time observer would have known about the NFCI.
Another consideration that we fail to account for in figure 3 is the release lag of each of these indexes. Every Wednesday, there is an NFCI released for the previous week (ending on Friday), meaning that the NFCI has about a five-day release lag. Though the FCI-G is a new series, it appears to be released around the 15th of each month, giving a reading for the previous month. Again, to fairly describe the real-time relationship between the NFCI and FCI-G, we need to adjust for the release lags as well.
Through the Archival FRED (ALFRED) service, we have a full history of the release dates and unrevised, as-released values of the NFCI back to its first release in 2011. In addition, we make a conservative assumption that each month’s FCI-G is released on the final day of that month (as opposed to the 15th day of the next month). If we use the as-released NFCI on its release day and compare it to the FCI-G,7 we can more closely replicate what an observer would have seen in real time. However, this comes at the cost of limiting the analysis to 2011 and later, which removes the three periods of extremely tight financial conditions (around 1990, 2000, and 2008) from the comparison.
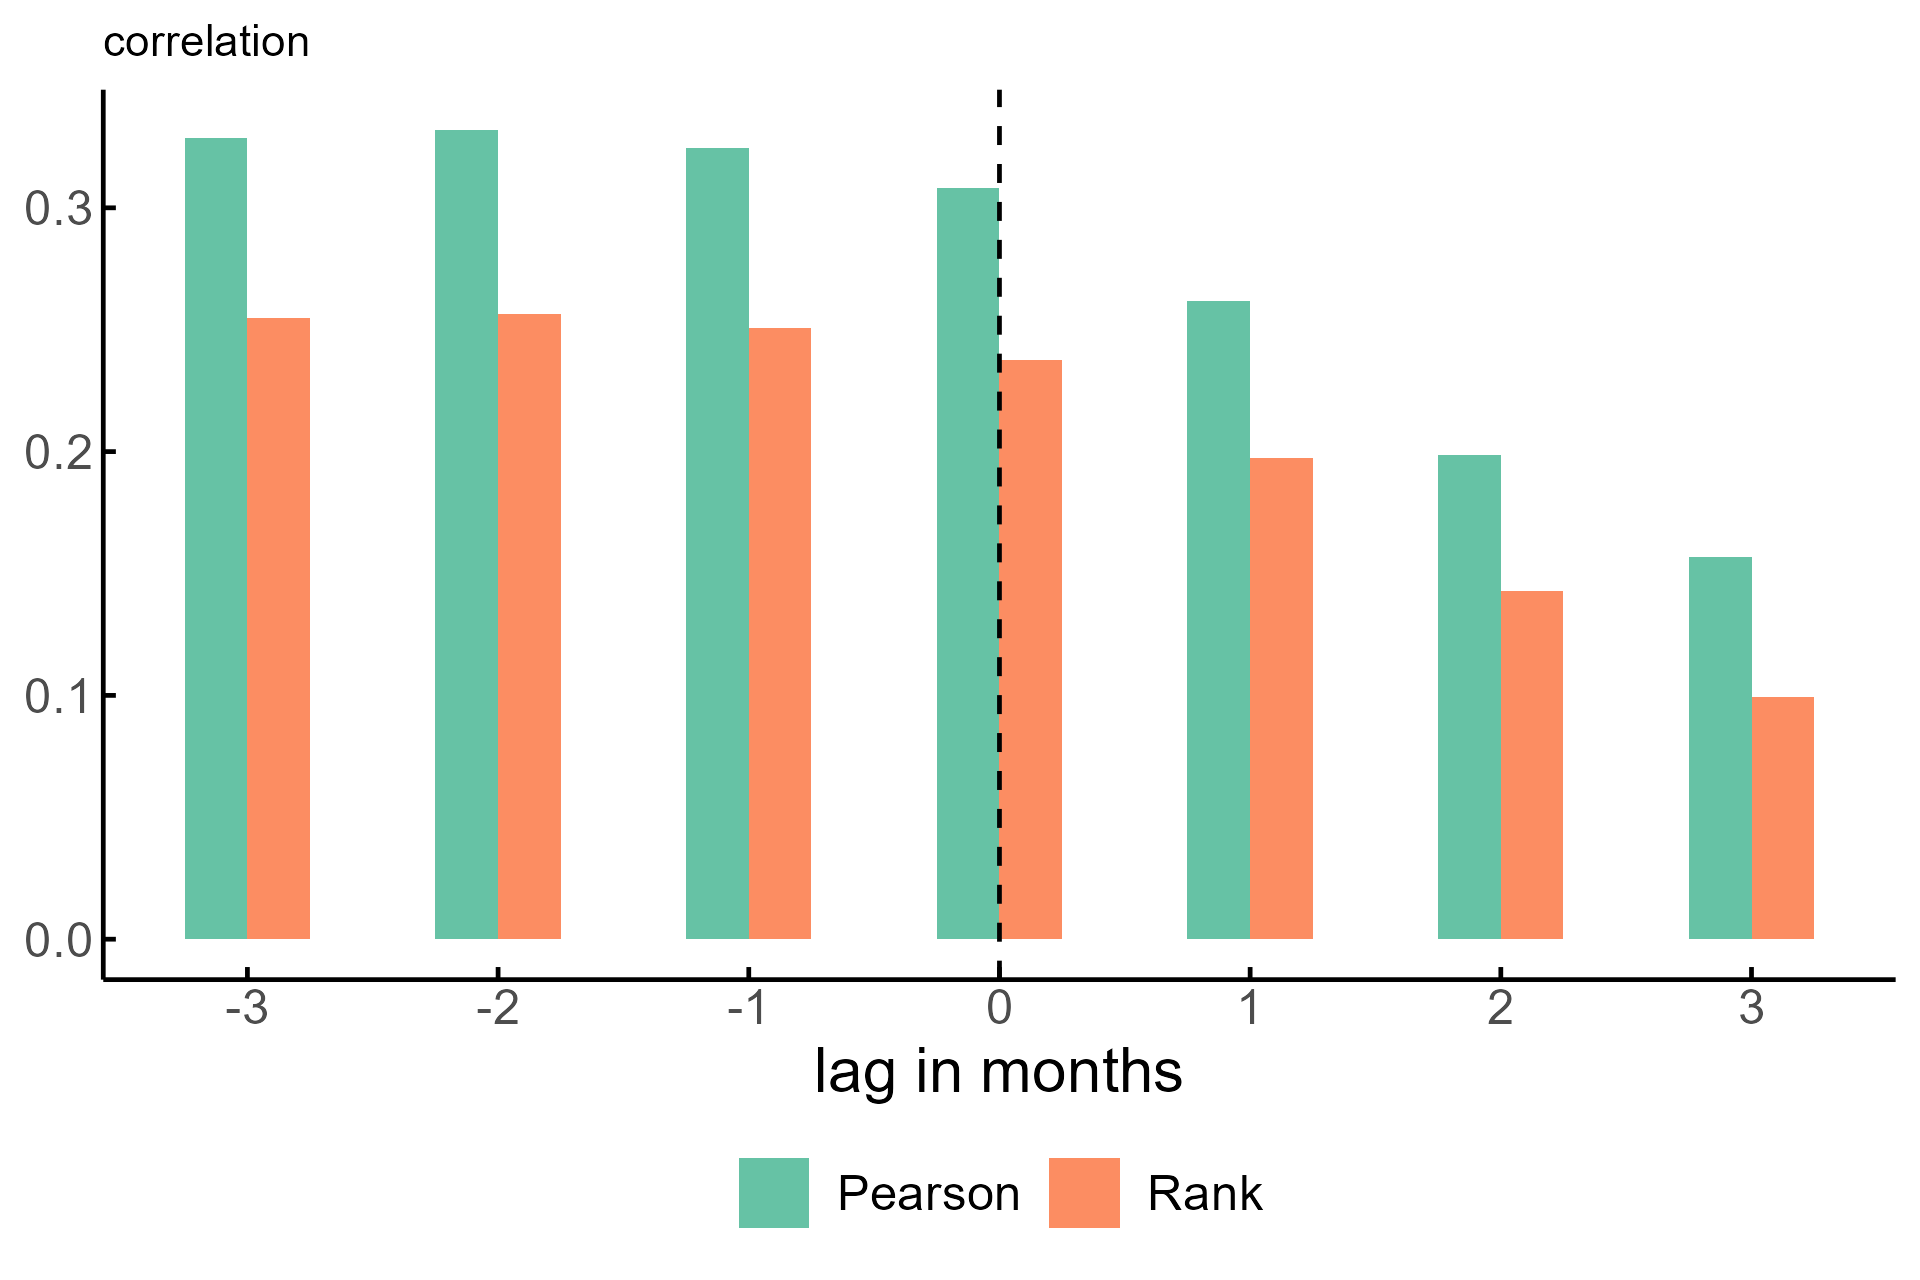
Cross-correlations that use the as-released NFCI are shown in figure 4. The NFCI still leads the FCI-G when measured in this way, though the relationship is notably weaker, partly because of the difference in sample periods used in figures 3 and 4. As in much of figure 3, the Pearson correlations are higher than the rank correlations in all of figure 4, indicating that some of the connection between the two indexes is being driven by the extreme events in the sample (e.g., the Covid-19 pandemic). Still, as others have found in a different context, the NFCI provides real-time information that is informative of the direction of the broader economy.8
4. Lead/lag relationship between the as-released NFCI and FCI-G, 2011–24

Sources: Authors’ calculations based on data from the Federal Reserve of Chicago from Archival FRED and the Board of the Governors of the Federal Reserve System.
Summary
One, perhaps, shortcoming of the NFCI is its lack of direct interpretability as a measure of the impact of financial conditions on future economic growth. Other financial conditions indicators, like the FCI-G, have been created that address this issue, providing a numeric assessment of the impact of current financial conditions on future growth. This exercise shows that the NFCI, despite its lack of explicit targeting of real GDP growth, is predictive of the FCI-G in the next month. The NFCI’s ability to lead the FCI-G should continue to make it valuable to policymakers and market participants who are interested in how financial conditions may impact future economic growth.Notes
1 Tobias Adrian, Nina Boyarchenko, and Domenico Giannone, 2019, “Vulnerable growth,” American Economic Review, Vol. 109, No. 4, April, pp. 1263–1289. Crossref
2 Scott Brave and R. Andrew Butters, 2012, “Diagnosing the financial system: Financial conditions and financial stress,” International Journal of Central Banking, Vol. 8, No. 2, June, pp. 191–239, available online. This article also suggests that the threshold above which the NFCI is predictive of a crisis state is –0.39, near the median value of the NFCI. This helps motivate our choice of the median for rescaling the NFCI.
3 We use an outlier-robust measure of volatility, the median absolute deviation, in this scaling.
4 David Kelley, 2019, “Which leading indicators have done better at signaling past recessions?,” Chicago Fed Letter, Federal Reserve Bank of Chicago, No. 425, Crossref; and Scott A. Brave and R. Andrew Butters, 2011, “Monitoring financial stability: A financial conditions index approach,” Economic Perspectives, Federal Reserve Bank of Chicago, Vol. 35, First Quarter, pp. 22–43, available online.
5 The correlations shown in figures 3 and 4 would be identical if we considered the renormalized NFCI, as it is a linear transformation of the NFCI.
6 The FCI-G seems to only be subject to revisions insofar as the input series are revised (like the Zillow Home Value Index is) or the FRB/US multipliers are changed.
7 When we use our conservative assumption of each month’s FCI-G coming out on the final day of that month (as opposed to the 15th day of the next month) and match the release of the weekly NFCI to this timing assumption, this implies that we typically have two fewer NFCI releases that could in principle be used to predict the upcoming FCI-G release. Including this additional information slightly increases the correlations in figure 4.
8 Aaron J. Amburgey and Michael W. McCracken, 2023, “On the real-time predictive content of financial condition indices for growth,” Journal of Applied Econometrics, Vol. 38, No. 2, March, pp. 137–163. Crossref


