

The following publication has been lightly reedited for spelling, grammar, and style to provide better searchability and an improved reading experience. No substantive changes impacting the data, analysis, or conclusions have been made. A PDF of the originally published version is available here.
In early February the Federal Open Market Committee announced a tightening of monetary policy; as of June, this has been reflected in a 125-basis-point increase in the federal funds rate from 3% to 4.25%. In light of this action, recent movements in the dollar against the German mark and Japanese yen seem perplexing. From February 4 to June 30, the dollar depreciated by 9.9% against the mark and 10.2% against the yen.
The conventional wisdom would predict that the dollar should strengthen following a tightening of U.S. monetary policy. Yet the dollar depreciated despite central bank interventions in the foreign exchange markets to support it. To take another example, on Wednesday, May 11, the Bundesbank cut its discount and Lombard rates by 50 basis points each. The Wall Street Journal characterized this as “an unexpectedly deep” cut1 The day before, the dollar had traded at 1.6735 marks; by Wednesday’s close in New York, the dollar was trading lower—at 1.6695 marks.
This Chicago Fed Letter investigates the empirical relationship between the federal funds rate and the yen/dollar and mark/dollar exchange rates in the 1980s and 1990s. The evidence from this period shows that sustained and large increases in the federal funds rate led to an appreciation of the dollar, but it often took two years for these effects to take noticeable hold. The effects of monetary policy actions are difficult to detect initially because exchange rate fluctuations over a one-year period are largely composed of unexplained shocks. Nevertheless, movements in the federal funds rate since the most recent business cycle peak (mid-1990) explain a surprisingly large fraction of the long-term movements in the yen/dollar exchange rate and somewhat less in the mark/dollar rate.
Forecasting exchange rate movements
Accurately forecasting movements in the dollar over short horizons is a difficult exercise. In an influential study, economists Richard Meese and Kenneth Rogoff concluded that sophisticated models of exchange rate determination make poor forecasts.2 These economists suggested a thought experiment that, in the context of today’s foreign exchange markets, could be described as follows: On February 4, Chairman Greenspan announced that “the Federal Open Market Committee decided to increase slightly the degree of pressure on reserve positions.” This action sent the federal funds rate to 3.25% from its previous average of 3%. Immediately following the announcement, the dollar was trading at 1.752 marks and 109 yen. Since the historical pattern of the federal funds rate is to continue rising for some time following an initial upward change in direction, what values of the dollar should a sophisticated analyst forecast for February 4, 1995? Or 1996? Of the models they considered, Meese and Rogoff concluded that the best forecasting model would simply predict no change, that is, 1.752 marks and 109 yen for 1995 and 1996. Only at horizons of about two or three years can the additional information about the behavior of the economy add forecasting power to these models.
One limitation of standard forecasting models is that they usually identify changes in monetary policy with changes in monetary aggregates such as M1 or M2. A recent study by Eichenbaum and Evans, however, indicates a stronger empirical relationship between the federal funds rate and the dollar.3 When expansionary (contractionary) changes in monetary policy are measured by unanticipated reductions (increases) in the federal funds rate, the data indicate that the dollar will depreciate (appreciate)—but there is a substantial delay between the policy actions and the maximal effect on the dollar.
Assessing the average relationship between the federal funds rate and the exchange rate
For both Germany and Japan, I used a statistical model to analyze three financial variables: the federal funds rate, a short-term interest rate in the foreign country, and the exchange rate. The exchange rate was measured in marks per dollar and yen per dollar. The statistical model was a vector autoregression estimated using weekly data. The German model was estimated for the period March 1979 through June 1994. Because of subtle statistical issues involving trends in the yen/dollar exchange rate, the Japanese model was estimated over the period July 1987 through June 1994. (Estimating the Japanese model over the 1979 to 1994 period would have attributed an even greater explanatory role to the federal funds rate in affecting the yen/dollar exchange rate.) The analysis accounts for changes in U.S. and foreign monetary policies through exogenous changes in the federal funds rate and the foreign short-term interest rate. This Fed Letter reports only on the effects that changes in the federal funds rate have on the value of the dollar.4
How do unusual movements in the federal funds rate affect the time path of the dollar? I will refer to such unusual movements as FF shocks. These shocks can be interpreted in the following way. Much as bond market traders forecast a value for interest rates each week, the statistical model can generate forecasts of the federal funds rate each week on the basis of its past values as well as past values of the foreign interest rate and the exchange rate. Then the new federal funds rate occurs this week. If the forecast is either lower or higher than the actual value, then the forecast is in error and the difference is called an FF shock. When the federal funds rate is unexpectedly high (low), as on February 4, that is a positive (negative) FF shock; this can also be referred to as a contractionary (expansionary) policy shock.
The first column of figure 1 plots the average effect of an FF shock on the federal funds rate (FF) and on the yen/dollar exchange rate (YEN, measured as yen per dollar). An average sized FF shock causes the federal funds rate to increase approximately 13 basis points during the first six months. So a 25-basis-point shock is a two-standard-deviation shock over the 1987-94 sample period. These shocks are larger over the 1979-94 period. This effect persists for about 18 months and then dampens. The effect of this approximately 13-basis point FF shock on YEN is initially small, and even perversely negative for about six months. By the end of the first year, however, the dollar has appreciated by about 0.5%, and this appreciation persists through the end of the third year. These estimates imply that a series of FF shocks totaling 125 basis points could increase the value of the dollar by 5% over a two- to three-year period.
1. Effects of FF and YEN shocks
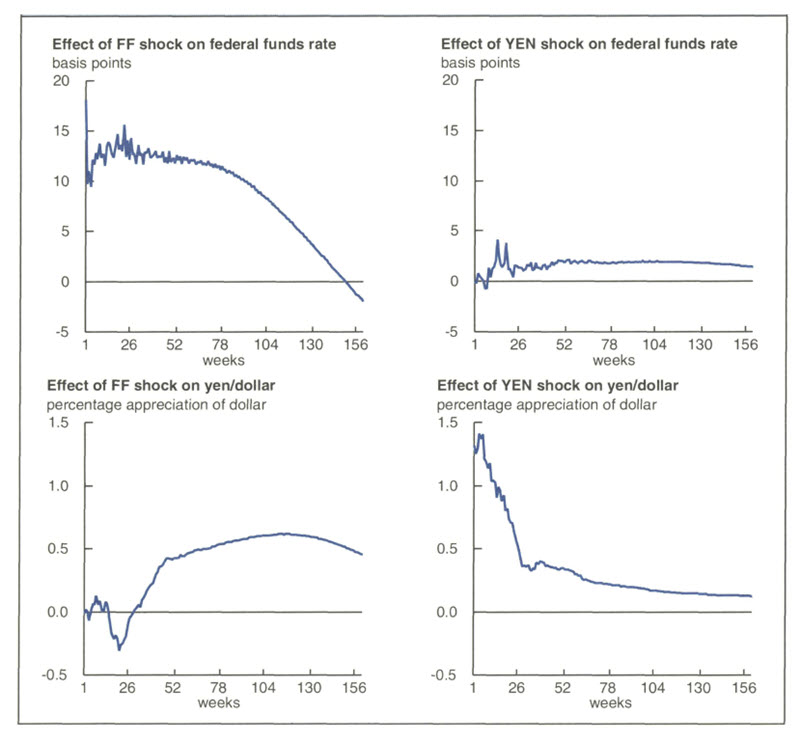
Of course, many other things cause exchange rates to fluctuate besides U.S. and foreign monetary policy actions. The statistical model for Japan refers to these as unanticipated changes in the yen/dollar exchange rate (YEN shock) that cannot be accounted for by fluctuations in U.S. or Japanese short-term interest rates. The model has difficulty capturing the effects of irregular phenomena such as fears of a trade war, the toppling of the Berlin Wall, the coup attempt against Gorbachev, or presidential elections, to name only a few. As a result of this difficulty, the model lumps all such nonmonetary effects into what I refer to as the YEN shock for Japan, or the MARK shock for Germany.
The second column of figure 1 displays the effect of the YEN shock on FF and YEN. Unanticipated shocks to the yen/dollar exchange rate are large: An average-sized YEN shock increases the value of the dollar by almost 1.5%. The response patterns of the exchange rate arising from the YEN and FF shocks indicate that over shorter horizons, most of the variation in the yen/dollar exchange rate will be due to factors unrelated to the federal funds rate; it turns out that they are mainly due to YEN shocks. Over longer horizons, more of the variation in the yen/dollar exchange rate will be due to monetary policy factors such as FF shocks.
These results seem consistent with the forecasting results reported by Meese and Rogoff; that is, information about the stance of monetary policy in the U.S. is not very helpful for forecasting future movements in the yen/dollar exchange rate at horizons under two years. The results for Germany are comparable.5
The yen/dollar and mark/dollar experience, 1987-94
How would the dollar have behaved over the 1987-94 period if the only factors influencing it had been U.S. monetary policy actions? Row 1 of figure 2 suggests an answer for Japan. In the upper left panel, the highly variable blue line is the actual path of the exchange rate from July 1987 through June 1994. The black line is the counterfactual path that the vector autoregression predicts the exchange rate would have followed if the YEN and Japanese monetary policy shocks had been identical to zero.
2. Exchange rate movements explained by FF shock
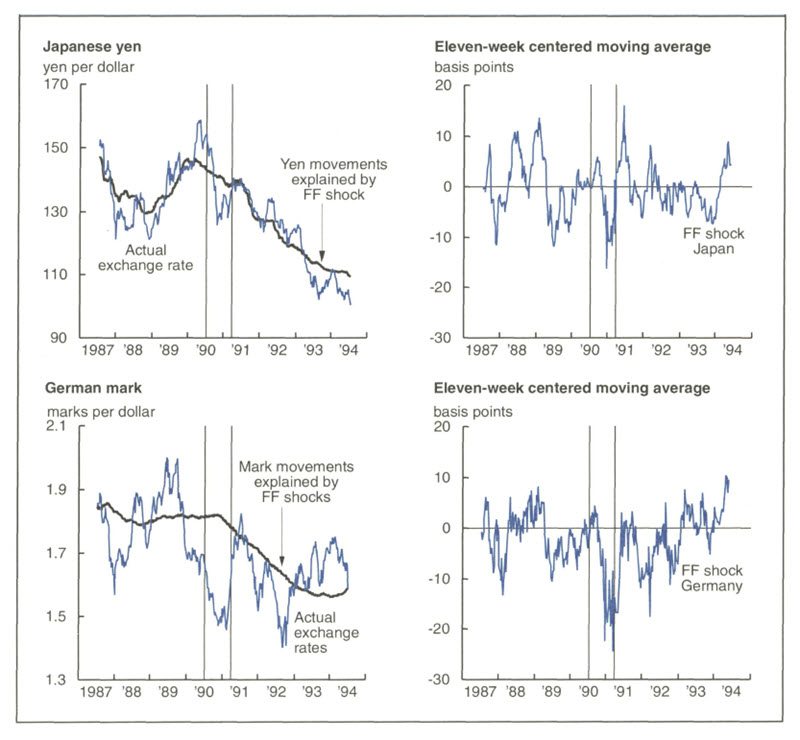
The yen/dollar exchange rate path predicted by the FF shocks matches many of the long-term movements in the actual exchange rate over this period. From November 1988 to April 1990, the dollar appreciated 31%; the FF shocks statistically accounted for about 40% of that appreciation. From April 1990 through June 1994, the dollar depreciated by about 60%; the FF shocks captured roughly half of that fall. The upper right panel displays the smoothed FF shock series, where negative (positive) numbers represent unanticipated policy easing (contraction). The shocks were predominantly positive in 1988, and the dollar appreciated in 1989. The shocks were mostly negative in 1989, and the dollar began to depreciate in 1990. In 1992 and 1993, the shocks were more negative than positive, and the dollar depreciated from 1992 through June 1994. In spite of the reasonably close fit, however, the FF shocks failed to predict much of the high-frequency variability in the yen/dollar exchange rate.
The results for the mark/dollar (MARK) are substantially weaker but still interesting (see row 2 of figure 2). From 1987 to 1989, the average level of the dollar was about 1.8 marks, the level implied by the FF shock; from mid-1992 to the present, the average level of the dollar has been about 1.6 marks, the level implied by the FF shock. As with Japan, however, the forecasted path from the FF shocks misses the high-frequency variability in MARK by an enormous amount.
Summary
Over short horizons, exchange rates can follow many paths that do not correspond to the predictions from recent monetary policy actions. In this sense, the dollar’s depreciation against the yen and the mark since February 4 does not seem shocking. Over longer periods, however, these unexplained movements in exchange rates seem to average out. At longer horizons, then, the economic fundamentals of monetary policy seem to provide reasonable predictions for the direction and level of the dollar.
Tracking Midwest manufacturing activity
Manufacturing output index (1987=100)
| May | Month ago | Year ago | |
|---|---|---|---|
| MMI | 131.4 | 131.7 | 119.5 |
| IP | 117.6 | 117.3 | 111.3 |
Motor vehicle production (millions, seasonally adj. annual rate)
| June | Month ago | Year ago | |
|---|---|---|---|
| Cars | 6.1 | 6.3 | 5.7 |
| Light trucks | 5.1 | 5.0 | 4.2 |
Purchasing Managers’ Surveys: net % reporting production growth
| June | Month ago | Year ago | |
|---|---|---|---|
| MW | 72.4 | 71.5 | 59.1 |
| U.S. | 59.8 | 61.3 | 51.9 |
Manufacturing output index, 1987=100
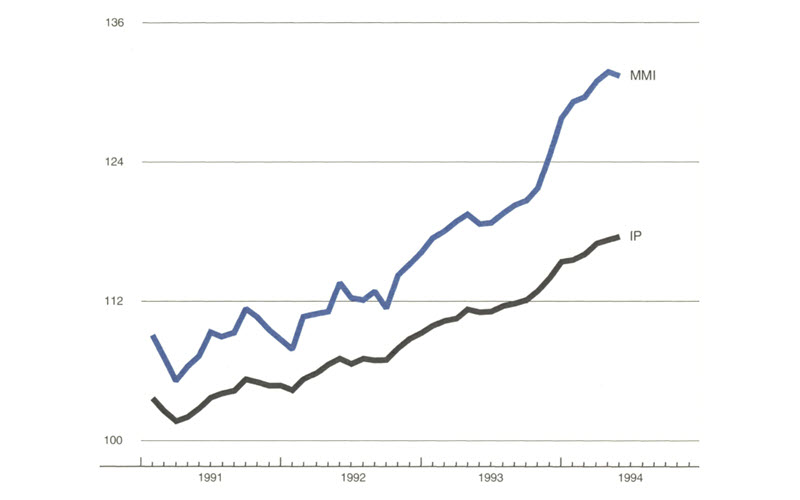
Expansion in Midwest manufacturing activity slowed in recent months, according to the Midwest Manufacturing Index. A significant decline in light vehicle assemblies (on a seasonally adjusted basis) played an important role, partly because of special constraints unrelated to demand. Even so, appliance industry output has also softened in recent months after strong gains in 1993.
While growth has slowed, purchasing managers’ surveys suggest that manufacturing activity continued to percolate at a high level. Inventory building and strength in investment helped bolster industrial output in the region. However, renewed expansion in consumer spending on durable goods is probably necessary for manufacturing activity to remain this strong.
Notes
1 “What’s news: Business and finance,” Wall Street Journal, May 12, 1994, p. 1.
2 Richard A. Meese and Kenneth Rogoff, “Empirical exchange rate models of the seventies: Do they fit out of sample?” Journal of International Economics, Vol. 14, No. 1/ 2, 1983, pp. 3-24.
3 Martin Eichenbaum and Charles L. Evans, “Some empirical evidence on the effects of monetary policy shocks on exchange rates,” Federal Reserve Bank of Chicago, working paper, No. 92-32.
4 Twenty-six lagged observations for each variable were included in the three-variable vector autoregression. The foreign interest rate variable is a three-month government bill rate. The federal funds shock is an orthogonalized shock from the vector autoregression. For a fuller discussion of the effects of foreign monetary policy shocks on the dollar and a discussion of some technical issues, see Charles L. Evans, “Interest rate shocks and the dollar,” Economic Perspectives, Vol. 18, No. 5, September/October 1994, forthcoming.
5 These are discussed in Evans, op. cit.


