

The following publication has been lightly reedited for spelling, grammar, and style to provide better searchability and an improved reading experience. No substantive changes impacting the data, analysis, or conclusions have been made. A PDF of the originally published version is available here.
While 1996 started off slowly, the economic engine accelerated in the second quarter of the year, to the point where many people were very concerned about the economy overheating. These fears were mollified in the third quarter as the economy’s growth matched the slower growth of the first quarter. In that setting, the Federal Reserve Bank of Chicago held its tenth annual Economic Outlook Symposium on December 6, 1996. More than 50 economists and analysts from business, academia, and government attended the conference. The sessions focused on the housing market and how its strength during 1996 would affect the economy in 1997. Prior to the symposium, individuals were asked to submit both annual and quarterly 1997 forecasts for many of the gross domestic product (GDP) components, as well as several other economic series. This Fed Letter will review the accuracy of last year’s conference forecast for 1996 and summarize the 1997 Economic Outlook Symposium.
The economy in 1996—Forecast and results
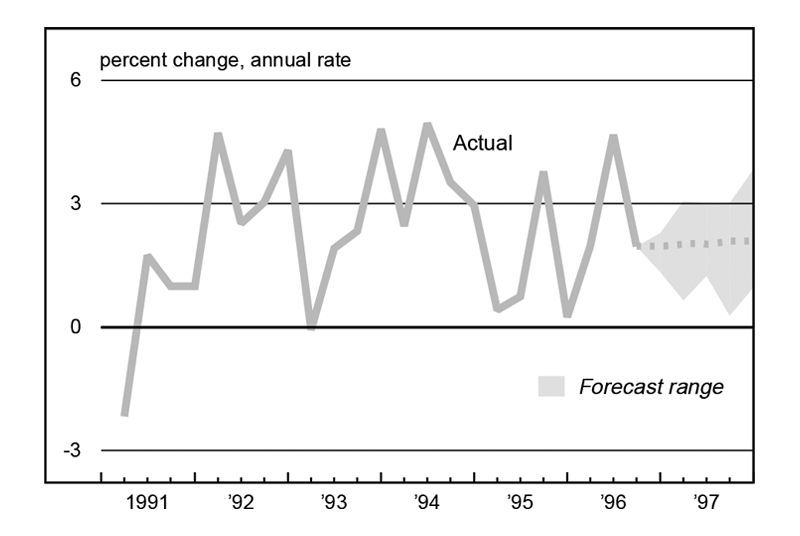
It is helpful to look back to the forecasts that were made a year ago and analyze where the forecasts differed from the actual outcome. One caveat should be noted. Last year’s forecasts were made late in 1995, prior to the new chain-weighted revisions to GDP. Consequently, the forecasts were based upon the old fixed-weight measurements. During the 1990s, the new chain-weighted real GDP averaged –0.5% lower annualized growth than the old fixed-weight measured real GDP. The expectation at last year’s Economic Outlook Symposium was for growth in real GDP to average 2.6% for the fourth quarter of 1995 through the first three quarters of 1996, a reduction from the extremely strong 3.7% pace of the prior four quarters. Correcting for the –0.5% lower growth in the new data would reduce the forecast to 2.1%. Actual real GDP has averaged 2% growth over the past four quarters. So the corrected consensus forecast was fairly accurate last year.
The consensus forecasts of the components of GDP were generally higher than the realized revised components’ actual values. For personal consumption expenditures, change in business inventories, net exports, and government purchases of goods and services, the degree of overforecast was very small. However, business fixed investment was expected to increase by 8.4% but only grew by 6.5%. This relatively large difference for business fixed investment could possibly be due to the new chain-weighting technique. The largest forecast error in the GDP components occurred for residential fixed investment, which was anticipated to increase by 1.7% but rose by 3.9%. The consensus forecast was right on target for industrial production, while the unemployment rate, inflation, and the prime rate were slightly lower than the group expected. The consensus was a little low on light vehicle sales, which turned out to be 300,000 units stronger than expected. The trade-weighted dollar showed more strength than the forecasters anticipated. Finally, housing starts were anticipated to increase by 1.36 million units but in fact rose by 1.46 million units. This unexpected strength in the housing sector was a prime reason that the central topic for the 1997 Economic Outlook Symposium was, following the presidential vision theme, Building a House for the 21st Century.
Looking forward
In 1997, the forecasters are expecting a fairly boring year. Boring is not necessarily bad considering that not a single forecaster is expecting a recession over the next five quarters. Figure 1 summarizes what the forecasters are expecting both in 1996 (fourth quarter numbers not known) and in 1997. The typical forecaster is expecting 1996 real GDP growth to be 2.3%. The forecast for 1997 is for real GDP growth to be 2.2%. This slight decline of 0.1% is related to some anticipated softening in the growth rates of personal consumption expenditures, business fixed investment, net exports, and government purchases of goods and services. A more severe reduction is expected in residential construction, which is forecast to ease to 0.5% in 1997 from 1996’s rate of 5.4%. The only GDP component expected to be stronger in 1997 is the change in business inventories.
1. Median forecasts from the 1997 Economic Outlook Symposium
| 1995 | 1996 | 1997 | |
| Real GDP | 2.0% | 2.3% | 2.2% |
| Personal consumption expenditures | 2.3% | 2.4% | 2.1% |
| Business fixed investment | 9.5% | 7.1% | 5.9% |
| Residential construction | –2.3% | 5.4% | 0.5% |
| Change in business inventories (billions) | $33.2 | $17.8 | $22.7 |
| Net exports of goods and services (billions) | –$107.6 | –$120.4 | –$124.6 |
| Government purchases of goods and services | 0.0% | 0.8% | 0.6% |
| Industrial production | 3.3% | 3.1% | 2.7% |
| Car and light truck sales (millions) | 14.7 | 15.0 | 14.7 |
| Housing starts (millions) | 1.36 | 1.46 | 1.38 |
| Unemployment rate | 5.6% | 5.4% | 5.5% |
| Inflation rate (Consumer Price Index) | 2.8% | 2.9% | 2.8% |
| Prime rate | 8.83% | 8.27% | 8.16% |
| Federal Reserve trade-weighted dollar | –7.7% | 3.5% | 0.7% |
Sources: U.S. Bureau of Economic Analysis; Federal Reserve Board of Governors, various releases; U.S. Department of Commerce, Bureau of the Census; U.S. Department of Labor, Monthly Labor Review, various years; U.S. Department of Labor, Bureau of Labor Statistics.
With the slight slowing in real GDP growth, industrial production is expected to slow from 3.1% to 2.7% in 1997. Car and light truck sales are expected to ease somewhat from their fairly strong 15 million-unit pace to a relatively modest sales rate of 14.7 million units. Housing starts are expected to moderate to a 1.38 million-unit pace in 1997 following a very strong 1.46 million-unit rate in 1996. The unemployment rate is forecast to rise by a tenth of a percent to 5.5%. Inflation is actually forecast to decline by a tenth of a percent to 2.8% in 1997. There is an expectation that the prime rate will experience a slight decline, falling by 11 basis points next year. Finally, the trade-weighted dollar is expected to rise by 0.7%.
In terms of the quarterly pattern for GDP, the forecast group is expecting a fairly flat quarterly outlook. GDP is anticipated to grow by 2% in each of the next three quarters, starting with the fourth quarter of 1996, and then by 2.1% for the last two quarters of 1997 (see figure 2). This flat growth pattern for 1997 is reflected in the growth outlook for personal consumption expenditures, business fixed investment, residential investment, and government purchases of goods and services. Some weakening is anticipated in change in business inventories as the year progresses. Net exports are anticipated to improve over the course of 1997.
2. 1997 forecast of real GDP
Source: U.S. Bureau of Economic Analysis.
The quarterly patterns for the other series forecast—industrial production, inflation, the prime rate, and the trade-weighted dollar—are expected to grow at the same pace that they have been experiencing recently. Car and light truck sales and housing starts (see figure 3) are expected to decline over the forecast horizon, while there is a slight pickup anticipated in the unemployment rate as 1997 draws to a close.
3. 1997 forecast of housing starts
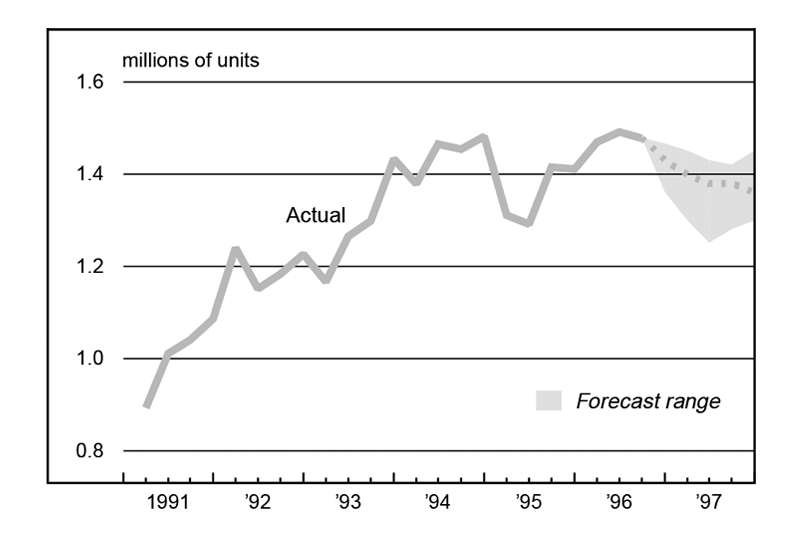
Source: U.S. Department of Commerce, Department of the Census.
The macroeconomic outlook
An economist from the Economic Cycle Research Institute, Inc., argued that while consensus forecasts do a fairly good job during a time of expansion or contraction, they do a terrible job at predicting a turning point in the economy. So, using consensus forecasts alone will not allow one to properly anticipate a change in the direction of the economy. According to the work done at the Institute, the current pattern of information is consistent with the beginning of a recession. However, this is best interpreted not as a prediction but as a note of caution. The prediction by this economist is that the economy is entering a period of slower growth and is more vulnerable to some exogenous shock that could push it into a recession. The Institute expects inflation to be benign over the coming year. This economist concluded with an outlook for international growth. The economies of Japan and France are expected to experience anemic growth. Germany’s economy is expected to fare somewhat better, but not much. The United Kingdom and Canada are forecast to have reasonable growth. The economic recoveries abroad are considered fragile and will be heavily dependent on economic conditions in the United States.
A chief economist from an investment firm believes that the economy will most likely continue to expand, but that there is risk of a recession. Real disposable income growth should be able to sustain continued consumer spending. Debt service payments as a percent of disposable income are high and rising. There is a risk to the forecast that consumer delinquencies will increase and cause lenders to cut back on lending, leading to an economic slowdown. The housing market should continue to do well in 1997 for several reasons. Out of pocket expenses for housing have been declining as a share of household income. Consumer confidence levels are very high, consistent with a good housing market. Credit quality spreads, which often widen when recession/credit quality problems begin to surface, have not widened. Corporate balance sheets remain solid. This investment economist was concerned about the quality spreads for foreign bonds. Interest rates for Russia and Southeast Asia are viewed as being too low, not reflecting the true risk of the investment. Meanwhile Latin America probably is facing interest rates that are too high due to overestimated investment risk.
A consultant to consumer industries expects the current expansion to continue through 1997, although there is less of a recession cushion than in past cycles. The level of growth in service spending by consumers is much lower than prior expansions as a result of demographics. The result is that the service spending cushion has shrunk to around 2%. Overall, consumer spending is clearly growing in a range that is consistent with continued expansion. The strong housing market in 1996 has provided good durable spending growth. This consultant believes that the strength from the consumer side for continued expansion has to come from nondurable spending. Currently, nondurable spending growth is rebounding, but not too strongly. Consumer spending on light vehicles is not out of line with past expansions. While consumer spending on furniture and household appliances is fairly moderate, the force behind durable spending is computer, video, and audio spending. Apparel has done well and should continue to add to growth in 1997. Credit growth has been slowing and will not be the boost to the consumer that it has been. Despite many newspaper reports, real disposable income growth can support continued consumer expenditures.
An economist from a government lending institution presented the long-term outlook for housing and mortgage finance markets. The year 1996 was one of the best in the housing industry’s history. Existing home sales will set a record, and new home sales were good. Home appreciation during this past year has been the best of the 1990s. The outlook for the future is mixed for the housing industry. Certain demographics do not work in the favor of housing. Individuals in the 25- to 44-year-old category, prime first-time home buyers, are expected to fall by 5% in the first decade of the next century, so there will be less need for homes. However, the estimated population growth for the 1990s has been revised to over 25 million people, the largest decade increase since the 1950s.
While population growth is up, household formation in the second half of the 1990s is expected to reach the lowest levels in the last quarter of a century. Household formations are the driving force behind the demand for housing. Immigration to some extent can be viewed as a white knight for the housing industry. The number of individuals legally emigrating to the U.S. during the 1990s is expected to be the largest number in this century. Statistics show that after 15 years in the U.S., immigrants have the same home ownership rates as the general population, and after 20 years immigrant ownership rates are actually higher than among the general population. There was a large influx of immigrants approximately 15 years ago, so the impact of this group on the housing market should begin to be felt.
Looking at homeownership by age category over time, two points stand out. The first is that homeownership rates increase with age. The second point is that for all groups under the age of 65, homeownership rates have either stayed the same over time or have fallen. Homeownership rates fell from around 65.5% in the early 1980s to around 64% by 1985 and had been holding steady at 64% though 1994. Since 1994, homeownership rates have risen to nearly their previous level of 65.5%. Thus, the outlook for housing is generally positive, with the majority of anticipated assistance coming from immigrants.
Conclusion
After heating up in the second quarter of 1996, economic growth slowed in the third quarter. The forecasting participants are expecting slightly slower growth in real GDP in 1997 than occurred in 1996. There was very widespread support for continued slow growth. The range limits of the forecasts (eliminating the two extreme high and low values) were 1.4% and 2.6%. This slow economic growth will be good news for inflation watchers, as price pressures on the economy are not expected to be very strong.
Tracking Midwest manufacturing activity
Manufacturing output indexes (1987=100)
| November | Month ago | Year ago | |
|---|---|---|---|
| CFMMI | 129.5 | 129.5 | 125.6 |
| IP | 130.4 | 129.4 | 124.5 |
Motor vehicle production (millions, seasonally adj. annual rate)
| November | Month ago | Year ago | |
|---|---|---|---|
| Cars | 6.3 | 5.5 | 6.1 |
| Light trucks | 5.6 | 5.4 | 5.3 |
Purchasing managers' surveys: net % reporting production growth
| December | Month ago | Year ago | |
|---|---|---|---|
| MW | 58.0 | 60.2 | 54.8 |
| U.S. | 58.4 | 57.5 | 46.9 |
Manufacturing output indexes, 1987=100
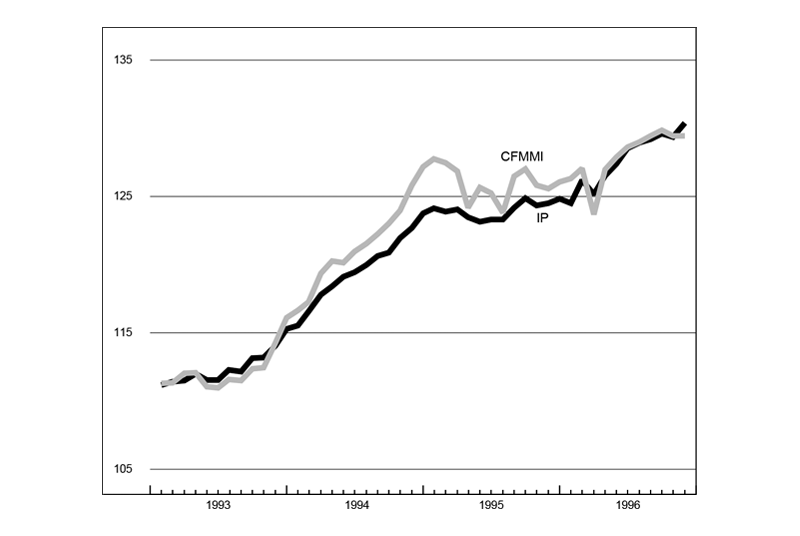
The CFMMI was flat in November, in contrast to a fairly strong gain in the nation. Declines in its machinery sector were offset by gains in its resource sector (primarily in food processing and petroleum products). The region’s auto and steel sectors were flat, despite an increase in auto assemblies in the region and the nation, following the production rebound from the GM strike. Reporting problems with electrical power data used to generate the auto component of the regional index may result in an upward revision next month.
The composite index for production, according to the Midwest purchasing managers’ surveys, was 58 in December, consistent with expanding activity. However, the pace of production activity in the region appears to have slowed from its October rate, in contrast to the nation, which showed a modest pickup.


