

In this Chicago Fed Insights article, we provide an update on the Chicago Fed Advance Retail Trade Summary (CARTS). CARTS is a summary measure of multiple high-frequency consumer spending indicators that aims to improve on the timeliness and reliability of traditional measures of U.S. retail spending.
To achieve these goals, CARTS produces weekly indexes of retail sales and prices that are dynamically benchmarked to the U.S. Census Bureau’s monthly measure of retail & food services sales excluding motor vehicles & parts (ex. auto) and, until recently (as we will explain), the U.S. Bureau of Economic Analysis’s (BEA) monthly measure of retail prices for the same category of spending.
Here, we summarize the ongoing improvements to these indexes made in CARTS 2.2 and present a new dashboard (see figure 1). We explain each of the panels of the dashboard in greater detail in what follows. The preliminary CARTS release for November 2024 suggests that both retail & food services sales and prices ex. auto increased from October on a seasonally adjusted basis. Final CARTS results for November including the Thanksgiving period are to be released on December 16, 2024.
1. CARTS 2.2 dashboard
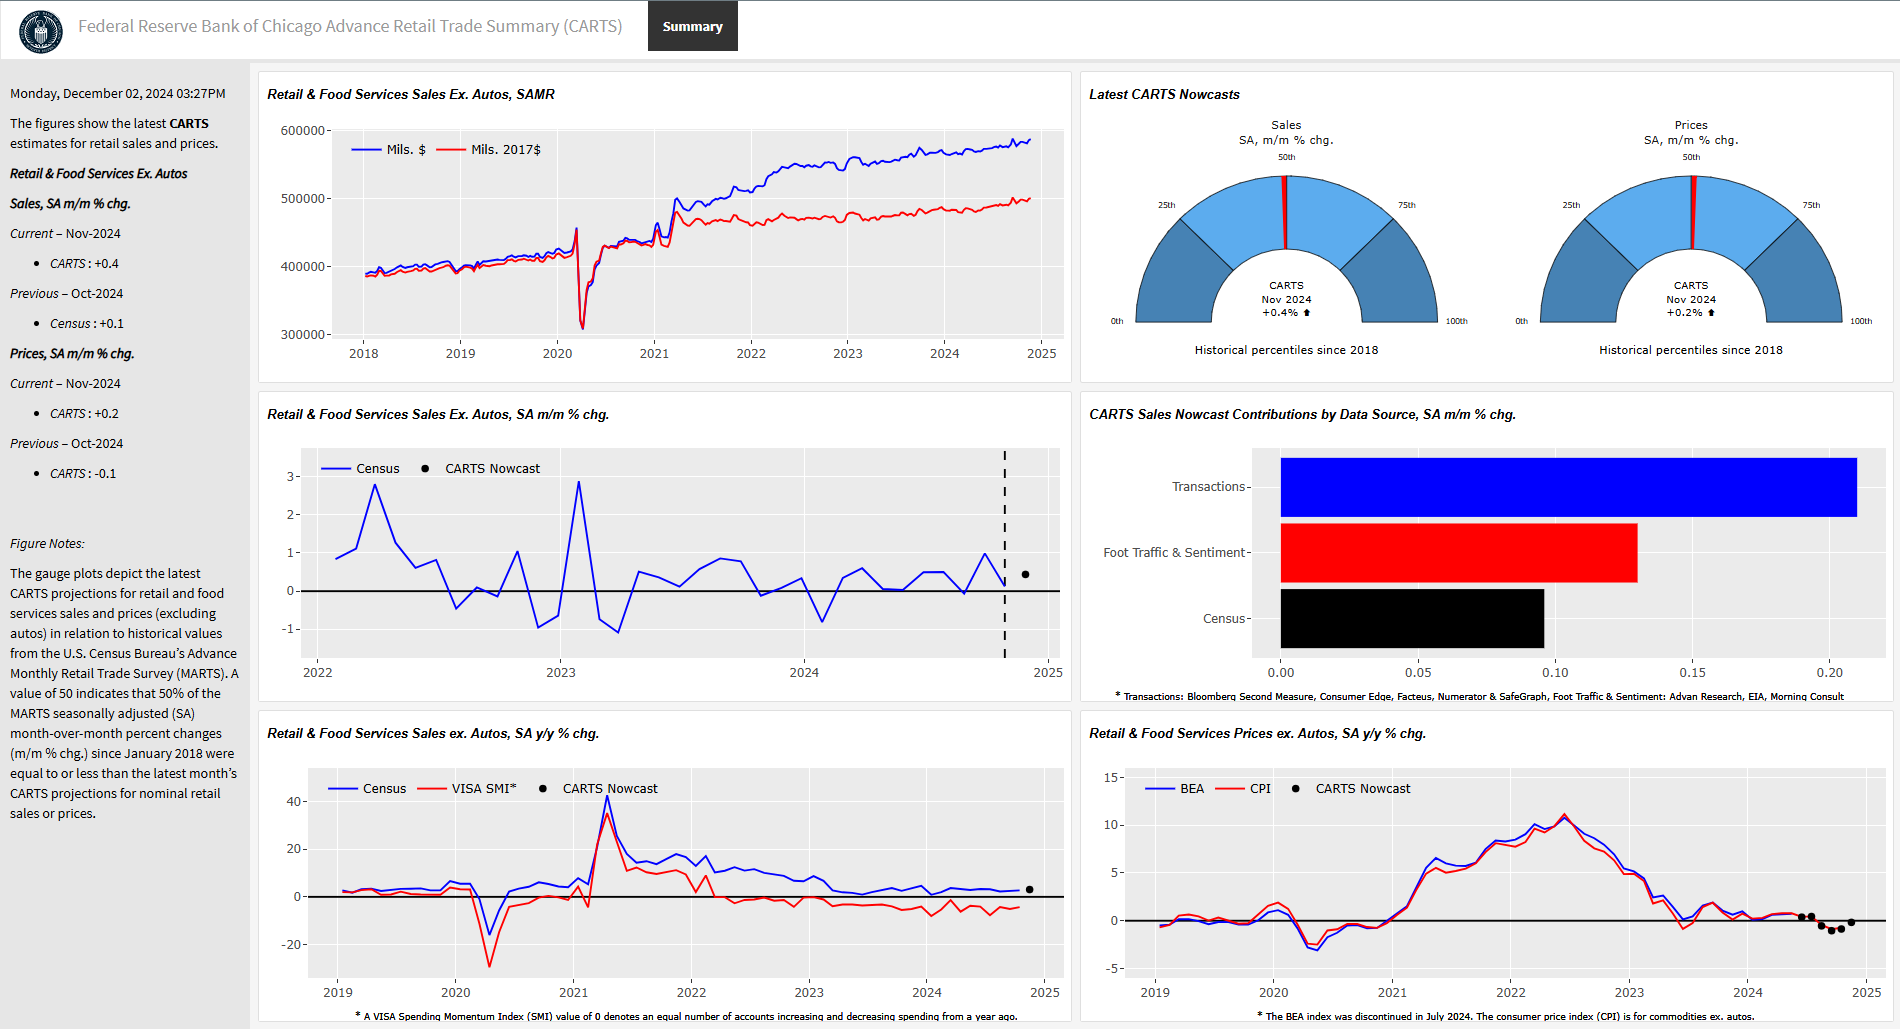
Sources: Authors’ calculations based on data from Haver Analytics, Adobe Analytics, Advan Research, Bloomberg Second Measure, Consumer Edge, Facteus, Morning Consult, Numerator, SafeGraph, and State Street PriceStats.
Updates in CARTS 2.2
The key feature of CARTS is its ability to combine high-frequency indicators with monthly data on retail & food services sales and prices ex. auto in a time-consistent fashion. The resulting Weekly Index of Retail Trade and Weekly Index of Retail Prices both match the available data from the Census Bureau and BEA when aggregated to monthly frequencies and provide initial estimates of these data ahead of new monthly data releases from these agencies.
The Census Bureau’s monthly data for retail sales are not adjusted for changes over time in the prices of retail goods and services. However, up until recently, the price deflator for retail sales produced by the BEA could be used to convert monthly retail sales into an inflation-adjusted measure. The dynamic benchmarking used in CARTS for the Weekly Index of Retail Sales and the Weekly Index of Retail Prices ensures that the latter can be used as a price deflator for the former at the weekly frequency as well.
This feature of CARTS allows its users to construct both current and constant dollar estimates of weekly sales such as those shown in figure 2.1 In July 2024, the BEA stopped publishing the chain-weighted price index for retail & food services sales ex. auto that had been used as a benchmark for the Weekly Index of Retail Prices. This means that the inflation-adjusted estimates after May 2024 are no longer benchmarked in CARTS.
2. Retail & food services sales ex. auto, SAMR
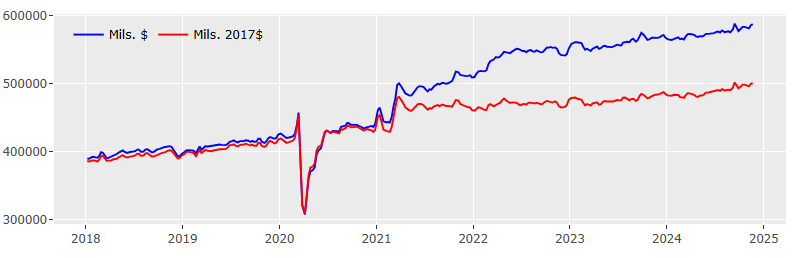
Sources: Authors’ calculations based on data from Haver Analytics, Adobe Analytics, Advan Research, Bloomberg Second Measure, Consumer Edge, Facteus, Morning Consult, Numerator, SafeGraph, and State Street PriceStats.
To compensate for the loss of the BEA data series and restore a sense of dynamic benchmarking for prices, CARTS 2.2 has added to the econometric model2 used to construct the Weekly Index of Retail Prices a monthly consumer price index from the U.S. Bureau of Labor Statistics (BLS)—namely, the Consumer Price Index (CPI) for commodities excluding motor vehicles and parts.3
As figure 3 demonstrates, the history of this BLS price index closely tracks that of the similar BEA price index. While CARTS 2.2 continues to benchmark the history of the Weekly Index of Retail Prices to the now-discontinued BEA price index through May 2024, its construction from June 2024 onward is instead disciplined by its strong correlation with the BLS price index. In this way, CARTS continues to present a representative weekly snapshot of retail & food services prices ex. auto.
3. Retail & food services prices ex. auto, SA y/y % chg.
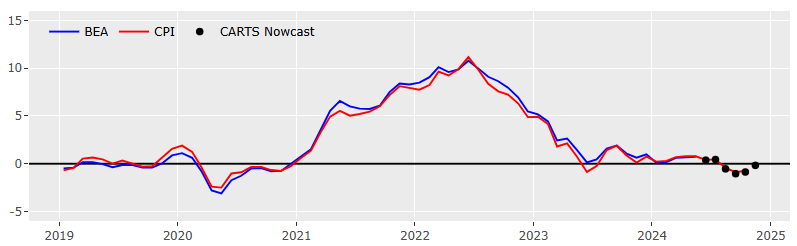
Sources: Authors’ calculations based on data from Haver Analytics, Adobe Analytics, and State Street PriceStats.
Tracking holiday spending with CARTS 2.2
When the Census Bureau data are not yet available, CARTS contains a projection or “nowcast” of these data. Figure 4 summarizes the CARTS Nowcasts for sales and prices for November 2024 in gauge plots showing where the nowcasts fall in relation to historical values since 2018.
4. Latest CARTS Nowcasts
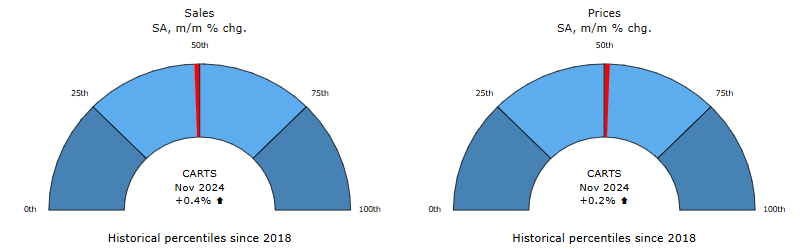
Sources: Authors’ calculations based on data from Haver Analytics, Adobe Analytics, Advan Research, Bloomberg Second Measure, Consumer Edge, Facteus, Morning Consult, Numerator, SafeGraph, and State Street PriceStats.
Sales are projected to increase 0.4% in November from the previous month, and prices are projected to increase 0.2%. As such, the CARTS Nowcasts would fall near the median month-over-month percent changes in sales and prices for retail & food services ex. auto since 2018. In terms of sales, the CARTS Nowcast for November 2024 is also somewhat higher than growth in retail & food services sales ex. auto in October (see figure 5).
5. Retail & food services sales ex. auto, SA m/m % chg.
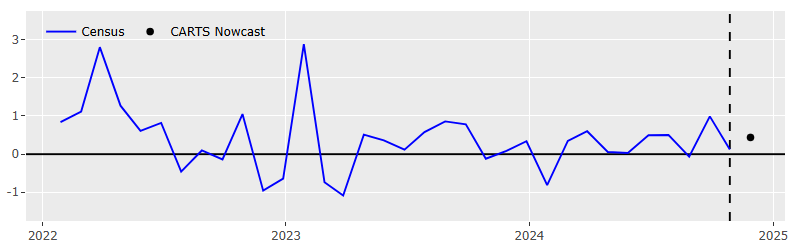
Sources: Authors’ calculations based on data from Haver Analytics, Adobe Analytics, Advan Research, Bloomberg Second Measure, Consumer Edge, Facteus, Morning Consult, Numerator, SafeGraph, and State Street PriceStats.
The underlying contributions to the CARTS Sales Nowcast for November suggest that the increase in retail & food services sales ex. auto was driven primarily by high-frequency data on consumer transactions, followed by high-frequency foot traffic & sentiment indicators and then by momentum from past values of the Census Bureau's Monthly Retail Trade Survey (see figure 6).
6. CARTS Sales Nowcast contributions, by data sources, SA m/m % chg.
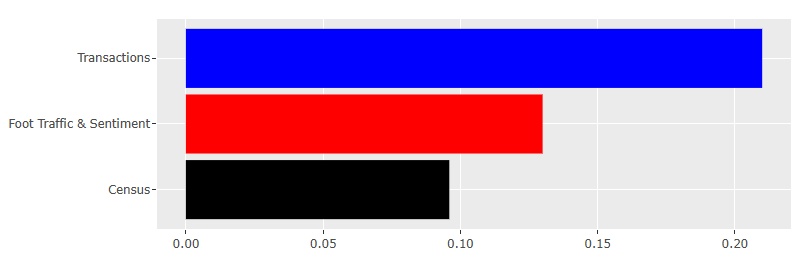
Sources: Authors’ calculations based on transactions data from Bloomberg Second Measure, Consumer Edge, Facteus, Numerator, and SafeGraph; foot traffic & sentiment data from Advan Research, the U.S. Energy Information Administration from Haver Analytics, and Morning Consult; and retail sales data from the U.S. Census Bureau from Haver Analytics.
To put the decomposition shown in figure 6 into perspective, it is helpful to compare both the Census Bureau's monthly retail sales data and the CARTS Sales Nowcast with other measures of consumer transactions. In figure 7, we plot both against the Visa Spending Momentum Index (SMI). As the SMI aims to measure differences in the number of accounts increasing versus decreasing spending from a year ago, we transform the Census Bureau data and CARTS Sales Nowcast to year-over-year percent changes to match this timing.
7. Retail & food services sales ex. auto, SA y/y % chg.
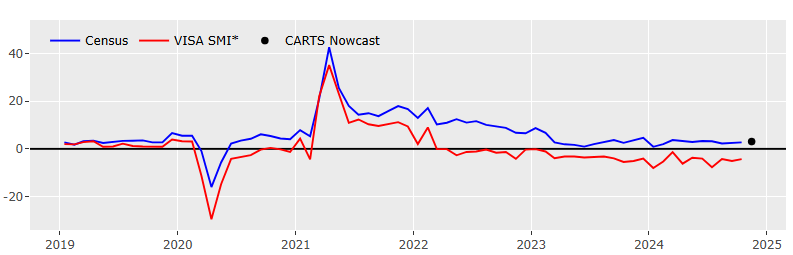
Notes: Census indicates the U.S. Census Bureau's Monthly Retail Trade Survey. CARTS stands for the Chicago Fed Advance Retail Trade Summary; the CARTS Nowcast is the monthly average of the Weekly Index of Retail Trade. Both the Census Bureau and CARTS indexes are shown as seasonally adjusted (SA) year-over-year (y/y) percent changes (% chg.).
Sources: Authors’ calculations based on data from Haver Analytics, Advan Research, Bloomberg Second Measure, Consumer Edge, Facteus, Morning Consult, Numerator, and SafeGraph.
The Visa index has indicated declining momentum in consumer spending for some time now, with the number of accounts with decreased spending exceeding those with increased spending. Year-over-year growth in actual retail sales has largely followed this pattern, but it has remained positive. The CARTS Nowcast for year-over-year growth in retail & food services sales ex. auto at 3.1% in November points to slightly more momentum in retail spending going into the holiday shopping season.
Conclusion
While it is still early in the 2024 holiday season, the preliminary CARTS release for November suggests that both retail & food services sales and prices ex. auto increased on a month-over-month and year-over-year basis. Final CARTS data for November 2024 including the Thanksgiving period are scheduled to be released on December 16, 2024. Additional details on CARTS are available online.
Notes
1 To construct constant dollar sales, divide the Weekly Index of Retail Trade by the Weekly Index of Retail Prices after the latter index has been divided by 100.
2 The Weekly Index of Retail Prices is constructed from a mixed-frequency vector autoregression that includes the monthly price indexes from the BEA and U.S. Bureau of Labor Statistics (BLS), weekly gas prices from the U.S. Energy Information Administration (EIA), and indexes of online prices from State Street PriceStats (weekly) and Adobe Analytics (monthly).
3 More specifically, we remove the transportation less motor fuels subcomponent from the aggregate CPI for commodities.


