The following publication has been lightly reedited for spelling, grammar, and style to provide better searchability and an improved reading experience. No substantive changes impacting the data, analysis, or conclusions have been made. A PDF of the originally published version is available here.
A useful summary measure of the household debt burden is the fraction of personal income taken up by service payments on outstanding debt. It is generally understood that the larger this fraction is, the more sensitive consumer spending will be to an increase in interest rates. The relationship depends on three plausible assumptions. First, in the short run it is difficult for consumers to change their level of outstanding debt. Second, an increase in interest rates tends to increase current debt service payments while either having no impact on income or reducing it. Third, the larger their debt burden, the less likely consumers are to take on additional debt.
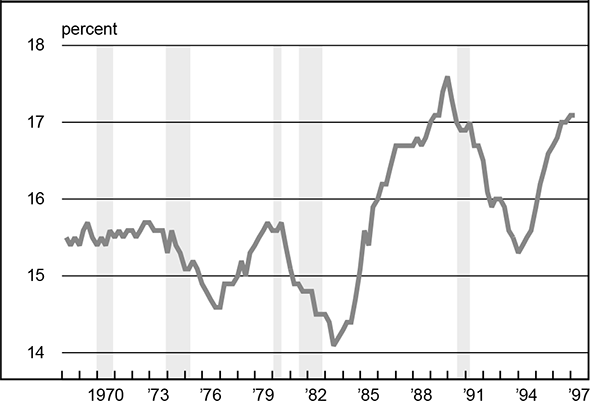
A closely watched measure of the household debt burden compiled by the Federal Reserve Board is plotted in figure 1. This measure is based on an estimate of total debt service payments using contemporaneous interest rates and the flow of funds measure of outstanding debt in the household sector. According to this measure, the debt burden is highly cyclical. It tends to rise during an expansion and fall during a contraction. The amplitude of the variations in the debt burden over the business cycle appears to have increased since the 1979–80 recession and, overall, households have been willing to take on more debt in recent years.
1. Debt service as percent of disposable income

Source: Board of Governors of the Federal Reserve System.
Aggregate measures, however, may mask important changes in the behavior of different demographic groups over time. This is of particular interest in the current environment of rapid change in the type and scope of debt available to consumers. Another drawback to this kind of measure is that it is based on aggregate macroeconomic data and not on debt service payments of individual households.
The periodic Survey of Consumer Finances is a useful tool for addressing these issues. The survey provides detailed information on debt service payments of large, diverse samples of U.S. households for 1989, 1992, and 1995. A recent Federal Reserve Bulletin article discussed some preliminary measures of the household debt burden for different demographic groups in the 1995 survey and compared them with the previous two surveys.1 In this Fed Letter, we exploit recent revisions to the dataset and changes in methodology to make the survey data from different years more comparable.
Figure 2 describes aggregate and median measures of the total debt burden for all households and income groups for each of the survey years. The median numbers show how the debt burden is distributed among households in a particular income category. These measures differ from the measure in figure 1 in that they are based on total income from all sources instead of disposable income and actual instead of imputed debt service payments.
2. Debt burden (%) by income
| Aggregate | Median | |||||
| Income | 1989 | 1992 | 1995 | 1989 | 1992 | 1995 |
| All households | 15.5 | 15.8 | 14.8 | 16.0 | 16.4 | 16.4 |
| < $10,000 | 19.1 | 17.3 | 22.6 | 22.9 | 20.0 | 16.7 |
| $10–25,000 | 12.6 | 16.6 | 16.3 | 17.3 | 15.8 | 17.5 |
| $25–50,000 | 16.8 | 17.1 | 17.0 | 16.4 | 16.6 | 16.9 |
| $50–100,000 | 16.5 | 16.0 | 16.6 | 16.1 | 16.9 | 16.7 |
| > $100,000 | 14.4 | 14.2 | 10.5 | 13.6 | 14.8 | 11.1 |
Source: Board of Governors of the Federal Reserve System, Survey of Consumer Finances, various years.
After rising moderately from 15.5% to 15.8% between 1989 and 1992, the aggregate debt burden for all households fell by 1 percentage point to 14.8% in 1995. Figure 1 shows that for the periods over which the 1989, 1992, and 1995 surveys were conducted, the numbers based on macro data are 17.5%, 16%, and 16.6%, respectively. Since the macro numbers report debt service as a fraction of disposable income, we would expect them to be larger than the survey numbers based on total income. Still, the two sets of debt burden measures exhibit substantial differences in the direction of changes between consecutive survey years. Because the survey data are based on direct evidence of debt service payments, the differences may cast some doubt on the reliability of the numbers based on macro data.
Figure 2 also shows that the median debt burden of all households did not change between 1992 and 1995 and only increased slightly between 1989 and 1992, from 16% to 16.4%. The rough constancy in debt burden for households taken together masks variations among different income groups, with the lowest two income groups and the highest income group showing the greatest variation. For the lowest income category, the aggregate debt burden decreased by almost 2 percentage points between 1989 and 1992 and increased by more than 5 percentage points between 1992 and 1995. The aggregate debt burden for the $10,000–$25,000 income group showed a 4 percentage point increase between 1989 and 1992 and only declined slightly between 1992 and 1995. The debt burden for the highest income category showed little change between 1989 and 1992, before declining by almost 4 percentage points in 1995. In contrast, the aggregate debt burden for households with income between $25,000 and $100,000 hardly changed over the three surveys.
Interpretation of the evidence for the highest income category is problematic because there is some inherent bias in the time trend of the debt burden. Figure 2 reveals that debt burdens are generally lower in higher-income categories than in lower-income categories. Moreover, with growth in the economy, we would expect the income of a typical household in this group to grow over time. These factors suggest the debt burden for the highest income category will tend to decline over time. The bias arises because, unlike the other categories, this category does not have an upper bound.
The increase in the household debt burden for the two lowest income groups between the expansion years 1989 and 1995 is of particular interest, because it may have implications for monetary policy. If these increases have persisted, the implication is that households in the lowest income categories are more sensitive to a change in interest rates now than in 1989. Thus, despite the relative constancy of the debt burden for all households between 1989 and 1995, one might argue that we are in a situation of heightened macroeconomic sensitivity to interest rate changes.2 Further analysis indicates that this conclusion is probably not warranted, however.
Consider the median numbers for the two lowest income groups in figure 2. The typical household in the under $10,000 category appeared to be less burdened in 1995 than it was in 1989, while the typical household in the $10,000–$25,000 category showed little change. The differences between these median numbers and their aggregate counterparts suggest interesting changes in the distribution of debt within these income groups.
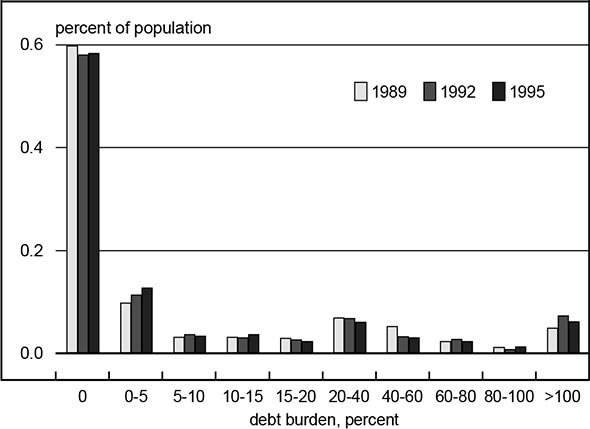
Figures 3 and 4 show the debt burden of households in the lowest and next to lowest income categories, respectively. Remarkably, figure 3 shows that for the under $10,000 group there was little change over the 1989–95 period. The increase in the aggregate debt burden for this income category and the decline in the median appear to be due a slight increase in the fraction of households with lower debt burdens and an increase in the debt burdens of very highly indebted individuals, a very small percentage of the population.
3. Debt burden in lowest income group

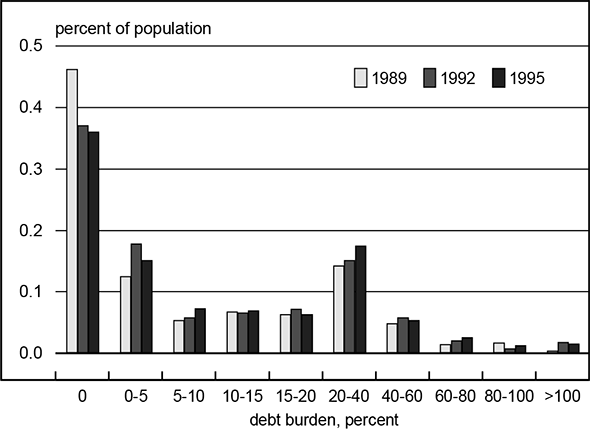
4. Debt burden in second lowest income group

A somewhat different picture emerges from figure 4. This suggests the increase in the aggregate debt burden for the next-to-lowest income category between 1989 and 1995 was largely due to a reduction in the fraction of households without any debt service payments. There do appear to be moderate increases in some of the higher debt burden categories. This also helps account for the observed increase in the aggregate debt number for the $10,000–$25,000 income group. Again, the number of households involved here is very small.
Finally, even if one is convinced that a significant increase in the debt burdens of low-income households occurred between 1989 and 1995, one must keep in mind that these households account for a relatively small fraction of total consumption expenditures. Our analysis indicates that, although these lower-income households accounted for between 35% and 37% of all U.S. households over the three survey years, they accounted for no more than 9% to 11% of total consumption. Hence, in terms of the implications of these debt burden numbers for the sensitivity of consumption expenditures to changes in interest rates, there appears to be little cause for concern.
Figure 5 shows how changes in debt burdens have been allocated across types of debt. Changes in the composition of debt may have macroeconomic implications if they show, for example, that households are using unsecured instead of secured debt to finance expenditures. Moreover, there may be implications for public policy if, for example, aggressive marketing of credit cards has led to excessive amounts of high-interest debt for low-income households. We consider the equivalent of the aggregate numbers in figure 2 for the various types of debt indicated in figure 5.3
5. Debt burden (%) by income and type of debt
| All households | < $10,000 | $10–25,000 | $25–50,000 | $50–100,000 | > $100,000 | ||
| Mortgage and home equity | 1989 | 5.4 | 3.9 | 4.5 | 6.2 | 7.6 | 3.6 |
|---|---|---|---|---|---|---|---|
| 1992 | 7.7 | 7.8 | 7.3 | 8.5 | 8.8 | 6.1 | |
| 1995 | 8.1 | 8.0 | 8.4 | 9.1 | 9.8 | 5.6 | |
| Installment | 1989 | 1.1 | 4.4 | 1.9 | 1.8 | 0.7 | 0.7 |
| 1992 | 0.6 | 2.0 | 1.4 | 1.0 | 0.3 | 0.2 | |
| 1995 | 0.6 | 1.8 | 1.2 | 0.8 | 0,5 | 0.2 | |
| Credit card | 1989 | 0.2 | 0.2 | 0.3 | 0.4 | 0.3 | 0.1 |
| 1992 | 0.4 | 0.8 | 0.6 | 0.6 | 0.4 | 0.1 | |
| 1995 | 0.5 | 1.3 | 1.0 | 0.7 | 0.6 | 0.2 | |
| Investment real estate | 1989 | 2.8 | 2.6 | 0.3 | 0.9 | 1.0 | 5.9 |
| 1992 | 2.5 | 0.6 | 1.1 | 1.1 | 1.9 | 4.8 | |
| 1995 | 2.0 | 4.7 | 0.7 | 1.2 | 1.6 | 3.1 | |
| Other lines of credit | 1989 | 0.5 | 0.1 | 0.3 | 0.3 | 0.5 | 0.6 |
| 1992 | 0.5 | 0.1 | 0.3 | 0.4 | 0.5 | 0.5 | |
| 1995 | 0.4 | 0.1 | 0.1 | 0.4 | 0.5 | 0.3 | |
| Other | 1989 | 5.4 | 8.0 | 5.4 | 7.2 | 6.5 | 3.5 |
| 1992 | 4.1 | 6.1 | 5.8 | 5.5 | 4.2 | 2.3 | |
| 1995 | 3.3 | 6.7 | 4.8 | 4.8 | 3.6 | 1.0 |
Looking at the numbers for all households, the fall in debt burdens from 1989 to 1995 is reflected in installment, investment real estate, and other debt. However, since 1989 households have taken on progressively more mortgage and home equity, and credit card debt. The level of debt service on credit card debt is the smallest among the various debt components, only 0.5% of income in 1995. However, it more than doubled as a fraction of income from 1989 to 1995. Overall, there has been a shift in debt burdens toward secured debt.
With few exceptions, the trends for all households are reflected in these debt service numbers by income category. Of particular interest is the credit card debt component. Credit card debt servicing increased sharply for the two lowest income categories between 1989 and 1995. The under $10,000 group experienced a more than sixfold increase in credit card debt, and the credit card debt burden for the $10,000–$25,000 group increased by more than a factor of three. These observations seem consistent with evidence from other sources that credit card issuers have become more aggressive in recent years at expanding the base of cardholders. However, the increase in the credit card debt burden for the lowest income group appears to be offset by a drop in the installment debt burden. This suggests that there has not been a substantial increase in high-interest debt for low-income households, but that these households have merely substituted one type of high-interest debt for another.
Conclusion
We have presented new evidence on the household debt burden from the Survey of Consumer Finances. Our analysis suggests that, perhaps contrary to evidence based on macro data, the household debt burden has not changed very much over the period covered by the survey and does not represent a substantial increase in macroeconomic sensitivity to interest rate changes. In addition, we have found that households have tended to use more secured debt over the period covered by the survey and that increases in credit card debt service of lower-income households have been offset to a large extent by reductions in the servicing of installment debt.
Tracking Midwest manufacturing activity
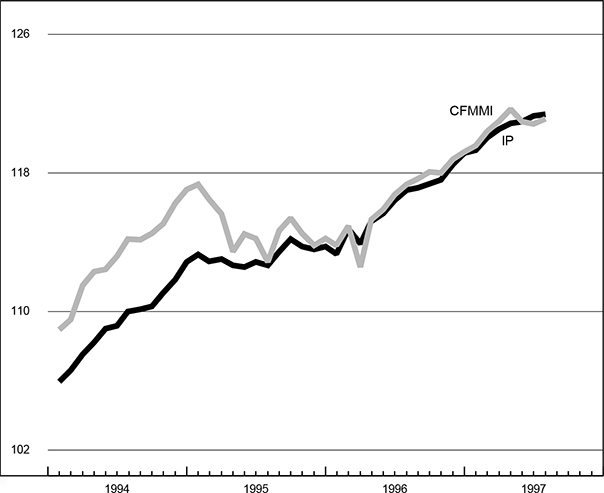
Manufacturing output indexes (1992=100)
| July | Month ago | Year ago | |
|---|---|---|---|
| CFMMI | 121.1 | 120.8 | 117.4 |
| IP | 121.4 | 121.3 | 117.0 |
Motor vehicle production (millions, seasonally adj. annual rate)
| August | Month ago | Year ago | |
|---|---|---|---|
| Cars | 6.1 | 5.8 | 6.7 |
| Light trucks | 6.0 | 4.9 | 5.6 |
Purchasing managers' surveys: net % reporting production growth
| September | Month ago | Year ago | |
|---|---|---|---|
| MW | 70.4 | 60.5 | 63.7 |
| U.S. | 57.4 | 62.4 | 53.9 |
Manufacturing output indexes, 1992=100

The CFMMI increased 0.2% from June to July, following a 0.1% decline in June. By comparison, the Federal Reserve Board’s IP index for manufacturing increased by 0.1% in July and 0.3% in June.
The Midwest purchasing managers’ index for production increased to 70.4% in September from 60.5% in August. This is the index’s highest level since September 1994. The Detroit and Milwaukee purchasing managers’ indexes increased, and the Chicago index declined only slightly from last month’s high level. The national purchasing managers’ index decreased from 62.4% in August to 57.4% in September. Economic activity in the manufacturing sector grew at a slower rate in September than in August. Motor vehicle production increased from 5.8 million to 6.1 million units for cars and from 4.9 million to 6 million units for light trucks.
Notes
1 A. Kennickell, M. Starr-McCluer, and A. Sunden, “Family finances in the U.S.: Recent evidence from the Survey of Consumer Finances,” Federal Reserve Bulletin, January 1997, pp. 1–24.
2 For an argument along these lines, see G. Epstein, “On borrowed time?” Barron’s, January 13, 1997.
3 For definitions of the types of debt, see the article cited in note 1.


