

The following publication has been lightly reedited for spelling, grammar, and style to provide better searchability and an improved reading experience. No substantive changes impacting the data, analysis, or conclusions have been made. A PDF of the originally published version is available here.
By the time this article hits your desk you will have seen headlines announcing that the U.S. current account deficit (the amount by which national investment exceeds national savings) has widened to a new record annual level. During 1999 it took just nine months to equal the previous record annual level of $221 billion set in 1998. Record nominal trade and income deficits in the fourth quarter raised the 1999 current account deficit to $339 billion. The magnitude of these recent increases has prompted policymakers and the press to express concern about the economic consequences of sustaining large current account deficits and to propose restrictive trade policies to reduce them.1 Congress has gone so far as to establish a bipartisan commission, the U.S. Trade Deficit Review Commission (USTDRC), to look into the perceived current account problem.2 This Chicago Fed Letter examines the merits of this debate by analyzing the data to see if recent changes in the current account balance were a temporary response to a short-lived economic event, the Asian financial crisis, or the persistent byproduct of recent U.S. trade agreements.
Guide to international transactions
The current account has three parts. The first part is the familiar trade account. The balance of the trade account is the difference between the value of U.S. exports and imports of goods and services. A trade deficit occurs when the value of imports exceeds the value of exports. The second part of the current account is the less familiar income account, which records income payments made to foreigners and income received from foreigners. International income flows largely reflect interest payments made by the U.S. on its foreign debt and interest received from its foreign assets.
Income flows also reflect labor income received by U.S. residents from overseas and labor income paid to foreign residents. An income deficit occurs when the value of income payments to foreigners exceeds the value of income receipts from abroad. The final part of the current account is transfers. The balance of the transfer account is the difference in the value of private and official transfers to and from other countries, the largest of which is foreign aid. The balance of the current account is the sum of the trade, income, and transfer account balances.
Assessing the current account for any one year is difficult because past current accounts influence future current accounts through the income account. Holding other things constant, a current account deficit this year would automatically lead to a smaller income balance and larger current account deficit next year. The annual change in the stock of a country’s net foreign assets (foreign assets less foreign debt) is determined by the country’s annual current account balance.3 For example, an annual current account deficit of $100 billion would mean that the stock of net foreign assets decreased by $100 billion over the year. Other things being equal, the smaller stock of net foreign assets this year would lead to relatively higher interest payments to foreigners next year, implying a smaller income balance and an increased current account deficit next year.
Thus, the nominal current account appears to be inherently unstable. However, focusing on just the current account ignores the fact that a country’s ability to meet its foreign obligations is tied to gross domestic product (GDP). Economists overcome this problem by expressing the current account as a ratio to GDP. Even in deficit, a country that has a stable current account to GDP ratio would also have a stable net foreign debt to GDP ratio, so it should have no problem meeting its foreign debt obligations.
History of U.S. current account
Figure 1 plots the current account (and its three components) as a percentage of nominal GDP. Looking through this lens we see that the current account deficit of 1999 loses some of its alarm. At 3.66 percent of nominal GDP it is still a record deficit, but it is only marginally higher than the current account deficit to GDP percentages of 1986 and 1987.
The driving force behind these record deficits has been large increases in the trade deficit. Fluctuations in the trade balance over the 1980s and 1990s changed the current account balance by as much as 1 percent of GDP in a single calendar year, while the combined income and transfer accounts have slowly added about 0.5 percent of GDP to the current account deficit over the last 40 years.
1. Components of current account
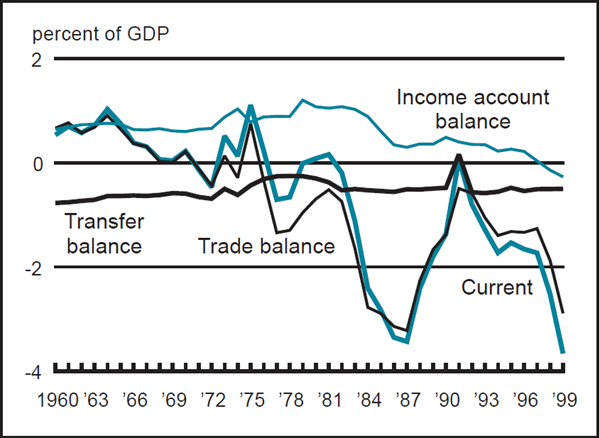
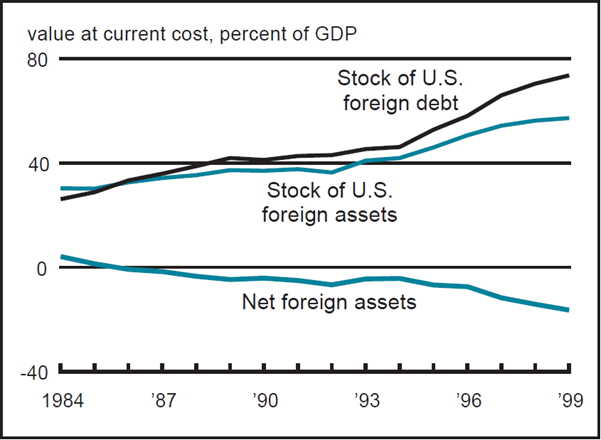
Figure 1 shows that the U.S. has only been running a deficit on the income account since 1998. Figure 2 reveals that over time the accumulated value of U.S. current account deficits has outweighed the accumulated value of surpluses so that the stock of U.S. foreign debt exceeds the stock of U.S. foreign assets. In other words, the U.S. is an international net debtor. The U.S. has been an international net debtor since 1986. U.S. net foreign debt currently represents 16 percent of GDP. This should have led to an income deficit back in 1986. It did not because the ex-post rate of return on U.S. foreign assets has consistently exceeded the ex-post rate of return foreigners enjoy on their U.S. assets (i.e., U.S. foreign debt).
2. Net international investment position
In contrast to the income account, figure 1 shows that with the exception of 1991, the U.S. has consistently recorded a transfer deficit, a consequence of large foreign aid payments to developing countries. The surplus in 1991 came about because of net transfer payments to the U.S. associated with the war in the Persian Gulf.
Why are policymakers concerned?
By definition, the current account balance is the outcome of consumption and investment decisions made by U.S. and foreign residents, who presumably act in their best interest subject to various constraints (including government policy), so from their standpoint the current account balance is optimal. This means that the size of the deficit should not be a concern for public policy unless there is evidence of poorly functioning markets (in goods or capital) and/or inappropriate government policies (fiscal, monetary, or trade). While the policy debate surrounding the persistent current account deficits of many emerging countries has included discussions about imperfect domestic capital markets and inappropriate domestic government policies, the U.S. debate has been limited to questioning government policies, most recently free trade agreements.
For example, the record current account deficits of the mid-1980s coincided with large fiscal deficits, which led to the popular view that current account imbalances are byproducts of fiscal imbalances—the twin-deficits theory. According to this theory, increases in the government’s fiscal deficit should be matched by similar increases in the current account deficit. The idea is that the current account balance reflects the difference between national saving and investment, so reductions in national saving such as a large fiscal deficit would directly increase the current account deficit. Obstfeld and Rogoff (1995) and others find no empirical support for this theory in the long term.4 Its apparent weakness is also reflected by the fact that the U.S. reduced its fiscal deficit over the latter half of the 1990s and is currently running a surplus.
In contrast to the 1980s, today’s policy debate over the appropriate size of the U.S. current account deficit has focused on the ballooning trade deficit. This is the primary focus of the USTDRC. Commentators argue that the trade deficit is the necessary byproduct of restrictive trade practices in other countries and the ongoing liberalization of U.S. international trade. This has led to calls for limiting the entry of foreign goods into the U.S.
Another feature of the current debate is that commentators have raised fears about the dynamic consequences of sustaining large trade deficits. They argue that the situation is more acute than it was in the 1980s because the U.S. is now an international debtor with an income deficit. The concern is that the U.S. will soon be in a debt trap as larger income deficits lead to higher net debt levels that in turn lead to even larger income deficits. Witnesses testifying before the USTDRC have argued that the stock of U.S. net foreign debt could reach 50 percent of GDP by 2011 if the U.S. and world economies continue to expand at present rates and returns on assets remain at current levels.5
Why we think concerns are misplaced
The data do not support the view that the recent surge in the U.S. current account deficit was caused by changes in U.S. international trade policy. According to trade theory, liberalizing U.S. trade would lead to a rise in the relative price of foreign goods (imports) and an outflow of capital from the U.S., which is inconsistent with the facts.6 The data reveal that there was a net capital inflow to the U.S. and a large fall in the relative price of foreign goods. Based on this and other evidence the main influence on the U.S. current account over the last three years appears to have been the Asian and Latin American financial crises and the subsequent slowdown of global (non-U.S.) economic activity.
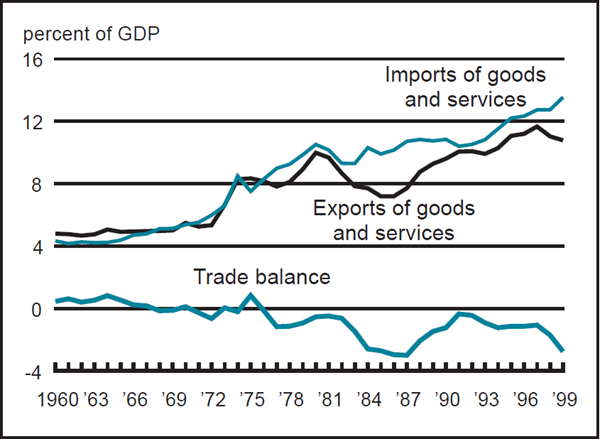
The U.S. was seen as a safe haven in the wake of the Asian, and later Latin American, financial crisis. On a risk-adjusted basis the U.S. had higher rates of return, which led to a large net inflow of capital. The increased supply of funds for investment was one of the factors that led to relatively low U.S. interest rates in recent years,7 which helped fuel the U.S. expansion and demand for imports by reducing saving and raising investment and consumption. The outflow of capital from Asia also caused a massive depreciation of Asian, and eventually Latin American, currencies. This led to a significant fall in the relative price of foreign goods, thereby raising U.S. demand for imports (and lowering foreign demand for U.S. exports). (See figure 3.) Another consequence of the capital outflow from Asia was high domestic interest rates in Asia and Latin America, which caused a severe economic slowdown. This also lowered the demand for U.S. exports and led to a significantly lower return on U.S. foreign assets relative to that on U.S. foreign debt. Overall, the data appear to be consistent with the view that the flow of capital from Asia and Latin America to the U.S. following their financial crisis caused the recent widening of the U.S. trade and income deficits, not trade liberalization.
3. Exports vs. imports
Future of U.S. current account
As conditions improve abroad, we expect to see a reversal of the temporary factors associated with the global financial crisis. As foreign risk diminishes there should be an outflow of funds from the U.S. This decrease in the supply of funds available for investment should raise the level of U.S. interest rates. In turn, higher interest rates should raise the level of saving and lower the level of consumption and investment. At the same time, improved economic conditions should raise foreign demand for U.S. goods, and the outflow of capital should put some downward pressure on the dollar. These factors should lower the nominal trade deficit through higher export and lower import demand. The net effect of the global recovery on the income deficit is less clear. Higher U.S. interest rates combined with a higher net debt level should raise the income deficit through higher income payments abroad, while improvements in the relative return on U.S. foreign assets should lower the income deficit. Our estimates suggest that the latter effect will dominate, so there should be an improvement in the income deficit. Overall, undoing the temporary events surrounding the global financial crisis should reduce the U.S. current account deficit to GDP ratio in the short run.
The capital inflow in the wake of the global financial crisis partly financed the investment boom that has supported the longest U.S. economic expansion.8 There is a widespread belief that this investment spurt has permanently raised the productive capacity of the U.S. and, some say, its long-run trend growth rate. Both these factors have greatly improved the U.S.’s ability to meet its foreign debt obligations (i.e., its ability to sustain a large current deficit in the long run).
The growing importance of services in the U.S. economy should also help. The so-called new economy is dominated by services, which account for over 70 percent of GDP. Although most economists think of services as nontradable goods, many are in fact tradable. At present, services account for a relatively small, but growing share of U.S. trade (see figure 4). One could reasonably expect the share of services in trade to approach the share of services in GDP. The growing trade surplus in services indicates that U.S. producers have a comparative advantage in this area. This suggests that the U.S. may run trade surpluses in the long run as trade continues to shift from manufactured goods.
4. Goods trade vs. service trade

Conclusion
The current account deficit as a share of nominal GDP is only now approaching the record levels set in the 1980s. Unlike the 1980s deficits, which were driven by government spending, today’s deficits are linked to a favorable situation that has allowed the U.S. to expand its productive capital stock by borrowing from abroad at relatively low interest rates. This investment has raised the U.S.’s productive capacity (and possibly its long-run growth rate) and its ability to meet its foreign financial obligations. In light of this, the current concern about the U.S. trade and current deficits appears to be without merit, as are the calls for restrictive trade policies to reverse the situation.
Tracking Midwest manufacturing activity
Manufacturing output indexes (1992=100)
| January | Month ago | Year ago | |
|---|---|---|---|
| CFMMI | 136.4 | 135.5 | 130.1 |
| IP | 146.6 | 145.3 | 138.6 |
Motor vehicle production (millions, seasonally adj. annual rate)
| February | Month ago | Year ago | |
|---|---|---|---|
| Cars | 5.6 | 5.7 | 5.5 |
| Light trucks | 6.9 | 7.1 | 6.8 |
Purchasing managers' surveys: net % reporting production growth
| February | Month ago | Year ago | |
|---|---|---|---|
| MW | 59.6 | 51.4 | 54.3 |
| U.S. | 61.3 | 55.9 | 56.3 |
Purchasing managers' surveys (production index)
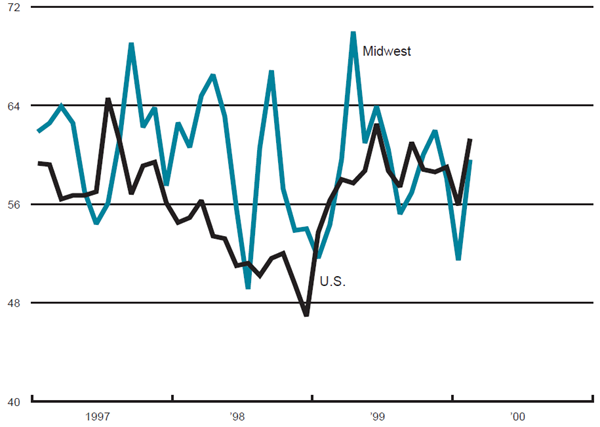
The Midwest purchasing managers’ composite index for production increased to 59.6% in February from 51.4% in January. The purchasing managers’ index increased in Chicago and Detroit but decreased in Milwaukee. The national purchasing managers’ survey for production increased from 55.9% to 61.3% from January to February. The Chicago Fed Midwest Manufacturing Index (CFMMI) rose 0.6% from December to January, reaching a seasonally adjusted level of 136.4 (1992=100). In comparison, the Federal Reserve Board’s Industrial Production Index (IP) for manufacturing increased 0.9% in January, after rising 0.2% in December.
Light truck production decreased from 7.1 million units in January 2000 to 6.9 million units in February, and car production decreased from 5.7 million to 5.6 million units from January to February.
Notes
1 See J. Khan, 2000, “Trade deficit set record in November,” New York Times, January 21, Section C, p. 1.
2 Congress established the USTDRC on October 21, 1998. See www.ustdrc.gov/index.html.
3 Foreign asset transactions are recorded in the capital account. The balance of the capital account is the difference between the change in value of U.S. foreign debt and assets. A capital account surplus occurs when the value of foreign debt increases by more than that of foreign assets. The balance of the capital account has the opposite sign to the current account balance, so the sum of the accounts is zero.
4 See M. Obstfeld and K. Rogoff, 1995, “The intertemporal approach to the current account,” in Handbook of International Economics, G. Grossman and K. Rogoff (eds.), Vol. 3, New York: Elsevier, North Holland.
5 See W. Godley, 1999, “Interim report: Notes on the U.S. trade and balance of payments deficits,” The Jerome Levy Economic Institute, Bard College, paper.
6 See M. A. Kouparitsas, 1999, “Why do countries pursue bilateral trade agreements? A case study of North America,” Chicago Fed, working paper, No. 97-20, http://research.frbchi.org/WorkingPapers/ wp97_20.pdf.
7 There is a wealth of evidence suggesting that the U.S. faces an upward sloping supply curve for investment funds; see M. Baxter and M. J. Crucini, 1993, “Explaining saving-investment correlations,” American Economic Review, Vol. 83, pp. 416–436, and references therein.
8 There is empirical evidence that suggests large current account deficits are typically associated with investment booms; see J. D. Sachs, 1981, “The current account and macroeconomic adjustment in the 1970s,” Brookings Papers on Economic Activity, No. 1, pp. 201–268.


