

The following publication has been lightly reedited for spelling, grammar, and style to provide better searchability and an improved reading experience. No substantive changes impacting the data, analysis, or conclusions have been made. A PDF of the originally published version is available here.
Even before the current economic downturn, states were finding it increasingly difficult to fund their Medicaid programs. In part, states may have become victims of their own recent good fortune. With the economy prospering in the latter half of the 1990s and tax dollars flowing in, few states saw the need for significant cuts in Medicaid spending, as such cuts could prove both socially painful and politically unpopular.
Now that the economy has slowed down and state revenues are falling short of expectations, policymakers are finding it necessary to address increasing Medicaid costs in a more aggressive fashion. Medicaid programs are funded by states’ general revenues, which are closely tied to the economic cycle, and matching funds from the federal government. Currently, Medicaid consumes the second largest portion of states’ general revenue spending, with only education commanding a larger share.1
This Chicago Fed Letter examines the growth in Medicaid spending and some of the measures that states in the Seventh District are taking to control costs as general tax revenues fall short of original estimates.
What is Medicaid?
Medicaid is a joint federal and state health insurance program that provides 1) health insurance for low-income families with children and with disabilities; 2) long-term care for the elderly poor and individuals with disabilities; and 3) supplemental coverage for low-income Medicare recipients for services not covered by Medicare.2 This means-tested program, the largest in the federal “safety net” of public assistance programs, traces its roots to the Social Security Amendments of 1965, which also established Medicare.
Under broad federal guidelines, each state is at liberty to determine its own eligibility standards, benefits packages, payment rates, and program administration. Subsequently, Medicaid is actually 56 distinct programs, one for each state and territory of the U.S. The programs are jointly funded by the state and federal governments, with the federal contribution for Medicaid services ranging from 50% to 83%, depending on the state’s average per capita income levels.3
Up, up, and away!
The last two decades have brought dramatic changes in both the scope and costs of Medicaid. Beginning in the late 1980s, Congress greatly expanded Medicaid eligibility to include many more pregnant women, children, and low-income Medicare recipients. Then, both legislation and court decisions during this period expanded Medicaid eligibility to include more learning-disabled children, as well as many individuals with specific medical issues (AIDS patients and substance abuse cases, for example). These changes not only increased enrollment, but by including these medically needy populations, also increased per-enrollee expenditures. Finally, enrollment also grew as a result of the general economic slowdown, and the accompanying increase in demand for social services, in the early 1990s.
In addition, state accounting policies designed to maximize the dollar match from the federal government may have distorted actual spending increases. For example, some states shifted services that had been financed through other programs to Medicaid in order to draw the federal match. One practice that substantially increased payments, however, was the way states handled Medicaid’s Disproportionate Share Hospital (DSH) provision. Many states would impose a tax on, or receive contributions from, DSHs. The revenue collected from providers would then be used for Medicaid reimbursements, allowing the states to collect matching funds from the federal government.4
All told, state and federal Medicaid spending more than doubled between 1988 and 1992, rising from $53.5 billion to nearly $120 billion, with growth averaging over 22% per year.
By the middle of the 1990s, however, the yearly increases in state Medicaid spending slowed to a more palatable rate (see figure 1). Most of these program expansions had worked their way into the system, and the federal government had closed some, though not all, of the loopholes that allowed states to increase federal matching funds through accounting changes. At the same time, states were working to contain Medicaid costs. The emergence of managed care was an important part of this effort; Medicaid managed care penetration increased from roughly 10% in 1991 to 56% in 2000. Initial cost savings from managed care were projected to be 5% to 15%, which would be achieved primarily through utilization management—increasing preventive care and reducing emergency room visits and specialist care—while simultaneously improving recipients’ overall access to care. As a further limiting factor to program cost increases, Medicaid enrollment began to fall as a result of the record economic expansion that began in the early 1990s.
1. Growth in personal health care expenditures

However, the rate of growth in states’ Medicaid spending remained high relative to both the overall rate of inflation and the rate of growth in private health care spending. One of the many reasons for this is that medical care inflation remained higher than the overall growth rate of consumer prices (see figure 2), and, as noted earlier, many Medicaid enrollees are higher-than-average consumers of medical care. Also, in many cases, the predicted cost savings from managed care failed to materialize. Utilization was more difficult to control than anticipated, while administrative burdens often increased.5
2. Inflation

Medicaid spending in the Seventh District
There is now a real sense of urgency about the need for states to cut their medical costs. This is because, unlike the Medicare program, which has its own trust fund, Medicaid programs are funded by general revenues (for example, sales, personal income, and corporate income taxes) that are inextricably tied to the economic cycle. Thus, when economic tides are rising, so too are revenues, and policymakers are not pressured to make hard cost-containment decisions. When that revenue stream slows, policymakers are forced to make painful decisions as to which of a myriad of vital programs to fund. Since Medicaid is the second largest and fastest growing source of state general revenue spending, from an accounting perspective, it is an attractive target for cuts.
As economic activity in the nation began to wane in 2000, so too did states’ general revenue collections. Between 1995 and 2000, quarterly revenue growth averaged 6.7% (change from year-earlier period). That rate began to decline in the fourth quarter of 2000 before turning negative in the third quarter of 2001 (see figure 3). And the flow of tax dollars continues to disappoint. According to a survey by the National Conference of State Legislatures, 44 states reported that revenues fell short of expectations in the early months of fiscal year 2002.6 At the same time, at least 20 states reported that Medicaid expenditures were higher than anticipated.7
3. States’ general revenue growth

All five Seventh District states (Illinois, Indiana, Iowa, Michigan, and Wisconsin) have reported that revenues were below expectations. In response, state governments have begun to announce budget cuts, including hundreds of millions of dollars of Medicaid funding. The effects of these cuts will be even more dramatic than it may first appear; cutting state funding will mean losing an approximately equal amount of matching federal funds. Some state efforts are fairly broad-based, as governments seek to spread the budget pain evenly. For example, Iowa’s governor has asked for across-the-board spending cuts from state departments. Other plans have been more specific and appear to be focused on the three largest components of state Medicaid spending: hospital care, nursing home care, and prescription drugs.
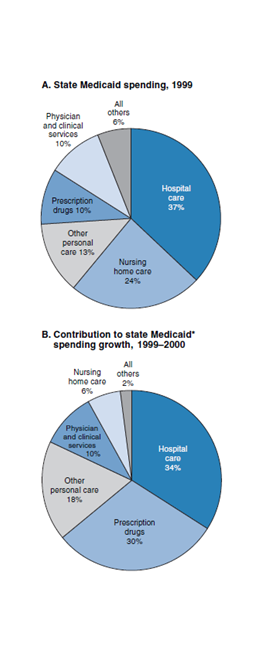
Hospital care is the largest component of states’ Medicaid spending, $28.7 billion in 2000, accounting for roughly 37% of total spending. As such, it is a major target of funding cuts. Illinois plans to reduce its reimbursements to hospitals for extended stays and out-patient care by approximately $100 million. These cuts will fall largely on the shoulders of the state’s “safety net” hospitals, which either serve a disproportionately high number of Medicaid recipients or are the sole provider in a rural community.
Long-term care, 75% of which is nursing home care, has also been a target of recent budget cuts. Medicaid pays for two-thirds of all nursing home residents, which constitutes 24% of states’ total Medicaid spending. Indiana recently announced Medicaid cuts of $155 million, much of which will come from nursing home care. The plan reduces reimbursement rates and establishes a minimum occupancy requirement for full reimbursement. In addition to its announced budget cuts, Iowa is also addressing this issue by cracking down on asset divestiture fraud, in which elderly parents hand over their assets to their adult children in order to qualify for Medicaid. In September, Iowa had 500 such cases pending and had identified approximately $1 million in improper payments.
Much of the recent debate has also centered on stemming the rising costs of prescription drug programs, and with good cause. State Medicaid spending on prescription drugs grew by over 20% in 2000, making it the fastest growing component of Medicaid spending. While prescription drugs accounted for only 10% of states’ total Medicaid spending in 1999, they accounted for 30% of total growth in spending from 1999 to 2000 (see figure 4). The increase in prescription drug spending is certainly alarming, yet some would argue that prescription drugs often pay for themselves by reducing other health care costs. For example, asthma medications might reduce the costs for acute care by much more than the price of the medications themselves. Until very recently, however, fee-for-service Medicaid prescription drug programs did not create incentives for either recipients or providers to consider cost when choosing between similar drugs (unlike private insurance).
4. State Medicaid spending
Source: U.S. Department of Health and Human Services, Centers for Medicare and Medicaid Services.
Michigan has developed a plan to contain prescription drug costs, and Indiana and Iowa are currently developing similar plans. In Michigan, a medical panel created a relatively restrictive prescription drug formulary of at least two “best in class” drugs in 40 therapeutic categories, from which doctors may prescribe drugs freely. Other drugs will require prior authorization from the state, unless the manufacturer is willing to match the price of the formulary drug. While Michigan estimates that the measure will save $42 million in the next fiscal year, it is unclear if the plan will come to fruition. The Pharmaceutical Research and Manufacturers of America, a drug-industry trade group, has challenged the legality of the plan, arguing that it denies patients needed drugs.
Conclusion
The onset of recession has put states’ budgets under increasing pressure as general tax revenues have fallen well below projections. At the same time, the demand for social services continues to rise, due in part to the economic slowdown. Unlike the federal government, most states are legally bound to balance their budgets. Furthermore, state governments cannot simply move funds from one account to another to meet spending needs. Over 70% of states’ general revenues are spent on K–12 education, Medicaid, higher education, and corrections. The remainder is spent on public aid, economic development, judicial functions, and other general government programs. Since Medicaid is the fastest growing component of states’ general revenue spending, policymakers are making quick and painful decisions to rein in spending. Initial public reaction to cost containment measures, such as advocacy group lobbying efforts and lawsuits, demonstrates that some of the states’ actions will not be popular, nor will they go unchallenged. Yet, as long as Medicaid spending is funded by general revenues, we can expect similar problems to develop in future economic downturns.
Notes
1 National Association of State Budget Officers, 2001, “The fiscal survey of states, December 2001,” Washington, DC, December.
2 Medicare is a federally funded program that provides health insurance primarily for Social Security eligible people aged 65 and older and certain people with disabilities. For more information, see www.medicare.gov.
3 U.S. Department of Health and Human Services, Health Care Financing Administration, 2002, “A profile of Medicaid,” Washington, DC, available on the internet at www.hcfa.gov./stats/2Tchartbk.pdf.
4 Disproportionate share hospitals are those hospitals that provide care to an unusually high percentage of low-income Medicaid patients, the indigent, and the uninsured. DSH payments increased more than tenfold between 1990 and 1996. For more information, see Theresa Coughlin, Leighton Ku, and Johnny Kim, 2000, “Reforming the Medicaid disproportionate share hospital program in the 1990s,” Urban Institute, Washington, DC, January, available on the internet at http://newfederalism.urban.org/html/discussion99-14.html.
5 See, for example, Consumers Union Southwest Regional Office, 1999, “Looking back at the promises of Medicaid managed care," Austin, TX, April.
6 National Conference of State Legislatures, 2001, “State fiscal outlook for FY 2002: October update,” Washington, DC, October.
7 Kaiser Commission on Medicaid and the Uninsured, 2001, “Medicaid budgets under stress: Survey findings for state fiscal year 2000, 2001, and 2002,” Washington, DC, October.


