

This Chicago Fed Letter investigates the evolution of longer-run economic projections made by participants of the Federal Reserve’s monetary policy committee, the Federal Open Market Committee (FOMC), in its Summary of Economic Projections (SEP), and by the private sector. Over the past few years, the FOMC’s longer-run projections for economic growth, unemployment, and the federal funds rate have fallen quite dramatically. We verify that these views are shared by the private sector and show that the declines are not unprecedented in magnitude, but the projections have reached historical lows. We point to some reasons for these developments and touch on some implications for monetary policy.
Regular and timely surveys of private sector longer-run economic projections have been conducted for decades, but the public release of such forecasts by the FOMC’s participants (the Federal Reserve Governors and 12 Reserve Bank presidents) is a recent phenomenon.1 Economic forecasts for the current and following year have been presented in the Monetary Policy Report (MPR) submitted by the Board of Governors to Congress twice a year since 1979. However, it was not until 2009 that the MPR included longer-run projections. The inaugural SEP was released to the public at the conclusion of the October 2007 FOMC meeting. It contained forecast information similar to that in the MPR at the time but was to be made available to the public more frequently. With the exception of 2012 when there were five SEPs, an SEP has been released following FOMC meetings once a quarter ever since.
1. Longer-run projections of real GDP growth

Sources: Board of Governors of the Federal Reserve System and Haver Analytics.
The five SEPs released from October 2007 to October 2008 contained summary measures of FOMC participants’ forecasts of four key economic variables through the current and next two to three years. The variables included percentage point changes for the fourth quarter of a forecast year over the fourth quarter of the prior year for the National Income and Product Accounts of the United States measures of real gross domestic product (GDP), the price deflator for the Personal Consumption Expenditures Index (PCE inflation), and the analogous deflator for PCE that excludes food and energy prices. In addition, FOMC participants provided forecasts of the fourth-quarter average civilian unemployment rate published by the U.S. Bureau of Labor Statistics. Crucially, participants were asked to condition their forecasts on their perception of “appropriate” monetary policy, such as the path for the federal funds rate and policies regarding the Federal Reserve’s balance sheet. This means the projections were not based on what participants thought the FOMC would actually do, but what they thought it should do. These underlying assumptions were not included in the materials released to the public after FOMC meetings.2
Starting with the January 2009 meeting, the SEP was amended to include “longer-run” projections for GDP growth, unemployment, and PCE inflation. The longer-run projections are described in the SEP as “the rate to which each variable would be expected to converge under appropriate monetary policy and in the absence of further shocks to the economy.” While the instruction to participants to base their projections on appropriate policy remained, the underlying monetary policy assumptions continued to be excluded from the post-meeting SEP releases.
In January 2012, the SEP was amended once more. Since then, the SEPs have included information on participants’ views about appropriate policy. These are provided in the form of projections of the federal funds rate over the same horizons as the other variables, including the longer run. Also in January 2012, the FOMC released its first annual statement of the longer-run goals and strategy that would guide policy over the next year, which included a commitment to a 2% inflation target.3
Despite the obvious difficulty in projecting out even a year or two, longer-run projections are essential for private planning and public policy. Within the context of monetary policy, such forecasts of GDP growth, unemployment, and inflation, along with the underlying assumptions of appropriate policy, are useful to assess the stance of policy. For example, if FOMC participants tended to expect near-term growth to be much faster than in the long run, then they would be more inclined toward a policy of tightening. The projections for the longer-run federal funds rate are also helpful in assessing the Committee’s policy intentions going forward. Specifically, they indicate the likely endpoint for policy normalization. Overall, when combined with the near-term projections, the long-run information in the SEP makes it easier for members of the public to anticipate the FOMC’s reactions to incoming data, thereby facilitating their own planning. The longer-run projections also stand on their own as a summary of well-informed views about the economy’s long-run prospects and serve as a useful benchmark to compare with the historical experience.4
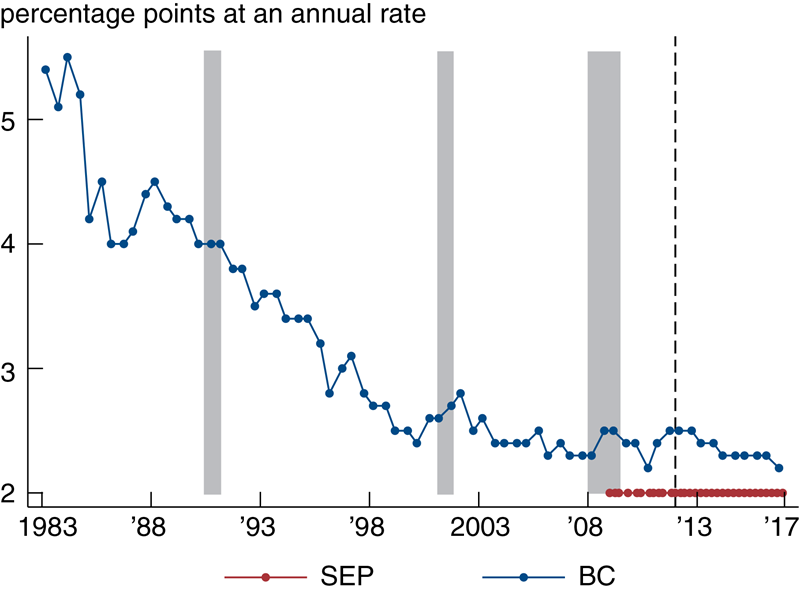
Figures 1–4 display median longer-run projections for real GDP growth, the unemployment rate, inflation, and short-term interest rates for the SEP through December 2016 (red), and the consensus (average) forecasts from the Blue Chip Economic Indicators (BC) monthly survey of about 50 leading private sector business economists through October 2016 (blue).5 The BC survey reports longer-run forecasts only in March and October. These forecasts extend six years from the year of the survey. We compare the SEP longer-run forecasts to the BC survey forecasts for the sixth year. This horizon seems consistent with the criteria used by FOMC participants when considering their longer-run projections. In contrast to the SEP, the BC forecasts are based on predictions of what monetary policy will be.
We choose to compare the SEP to the BC survey because the questions it poses about the longer run more closely parallel the SEP than other surveys, and the forecasts extend back in time relatively far. The real GDP growth and unemployment variables forecasted are the same in both the SEP and BC survey, but instead of PCE inflation the BC survey asks for forecasts of inflation in the Consumer Price Index for All Urban Consumers (CPI).6 Typically there is a small positive wedge between CPI and PCE inflation, but they tend to move together over the longer-term horizons in which we are interested.7 The BC survey does not ask for longer-run federal funds rate projections, but it does so for interest rates on three-month Treasury bills. We think this difference is inconsequential, since these variables are closely tied at low frequencies as well.8
Figure 1 displays the real GDP forecasts. Since the SEP first reported longer-run forecasts, the ones for annual GDP growth have fallen precipitously, from 2.5% to 1.8%. BC forecasts have fallen by the same amount, although from a slightly higher rate, from 2.7% to 2%. These declines are not unprecedented. In particular, the BC long-run forecast for GDP growth declined from 3.5% to 2.5% in the 1980s and from 3.3% to 2.7% in the years prior to the Great Recession. However, the most recent BC forecast is the lowest value ever recorded in the survey.
2. Longer-run projections of unemployment

Sources: Board of Governors of the Federal Reserve System and Haver Analytics.
Over the period 1983–2007, GDP growth averaged 2.9%, so the current views on growth are substantially lower than the experience before the Great Recession. A particularly interesting feature of both the BC and SEP forecasts is how long it took for them to start falling after the Great Recession. Presumably this reflects in part views that growth was held back immediately after the financial crisis by “headwinds,” such as a substantially weakened household sector balance sheet. After several years of sluggish growth, relatively optimistic long-run outlooks became more difficult to justify.
Since the end of the Great Recession, GDP growth has averaged about 2.2%. This has been held back by the aforementioned headwinds and perhaps shocks to the economy, such as debt crises in Europe or the fiscal showdowns in the U.S. So the magnitude of the declines in long-run growth projections might seem surprising.9 However, the likely source of these declines is a consensus that there are powerful forces in the economy beyond the control of the FOMC that will depress growth going forward, and it may have taken some time for this consensus to build.
Fernald (2016)10 examines the factors likely to drive growth over the next seven to ten years. He points to trends in educational attainment and demographics. It is unlikely that the strong growth in educational attainment seen in the last century can continue, implying that growth in labor quality will add less to GDP growth than it has in the past. In addition, as the baby boom generation retires there is downward pressure on growth in hours worked, which also depresses GDP growth. If productivity growth net of labor quality growth is similar to the experience of the 1973–95 period, which was slower than the earlier post-WWII period but considerably faster than since 2010, then these factors combine to yield Fernald’s baseline projection of 1.6%. From this perspective, the BC and SEP projections are optimistic.
Figure 2 shows that since 2013, the SEP and BC long-run forecasts of unemployment have tracked each other quite closely. However, following the financial crisis, the BC forecasts rose considerably faster than those in the SEP. The large swings evident in the BC series suggest that the recent variations in these forecasts are roughly consistent with past cyclical episodes. During expansions, views of the long-run unemployment rate tend to decline, while in recessions they tend to rise.
While the cyclical pattern is similar to past experience, the recent declines, much like with GDP growth, may also reflect a growing appreciation of powerful underlying trends. For example, Aaronson et al. (2015)11 argue that changes in the composition of the labor force may have lowered the “natural rate” of unemployment. The natural rate is the unemployment rate that would prevail in an economy making full use of its productive resources, so their work speaks directly to long-run unemployment projections. These authors argue that demographic and other changes related to educational attainment can be expected to continue to lower the natural rate for the remainder of this decade or longer.
3. Longer-run projections of inflation
Sources: Board of Governors of the Federal Reserve System and Haver Analytics.
Figure 3 shows the inflation forecasts. Recall that the SEP forecasts are for PCE inflation but the BC survey forecasts are for CPI, so we expect there to be a wedge between the two. The vertical dashed line in this figure indicates the month the FOMC announced its 2% target for PCE inflation, January 2012. Before then, the SEP indicates a range of forecasts (not shown), usually between 1.5% and 2%, but the median was always 2% and the top end of the range never exceeded 2%. After the target announcement, all FOMC participants reported 2% for their long-run forecast.
4. Longer-run projections of short-term interest rates
Sources: Board of Governors of the Federal Reserve System and Haver Analytics.
The BC forecasts from 1983 to the late 1990s turn out to track the trend in actual CPI inflation quite closely (not shown). They have been roughly flat since 2003 and relatively unresponsive to persistent deviations of actual inflation from the long-run forecast (not shown). Moreover, the variation after the target announcement is similar to that in the nine years preceding it. Apparently the private sector had believed for some time that the FOMC was committed to targeting a near 2% inflation rate and continued to do so after the target was announced. From this perspective, inflation expectations have been, and remain, well anchored.
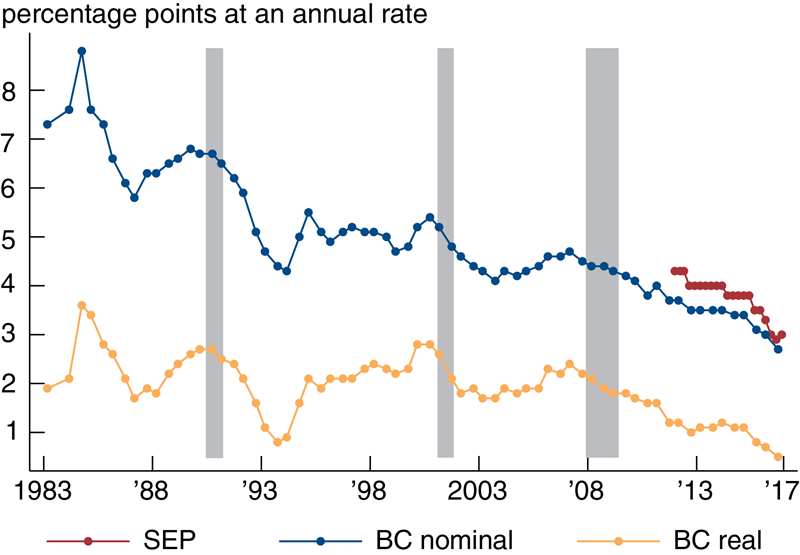
Figure 4 shows the interest rate forecasts. We have included estimates for the real counterpart to the BC short-term interest rate (orange dotted line).12 The real rate is a useful benchmark because the downward trend in inflation from 1983 to the late 1990s makes it difficult to compare nominal rates from that period to more recent times. Notice that since its inception, the SEP forecast has fallen substantially, from 4.3% to the most recent 3%. Since the SEP long-run projections of inflation are constant over this period, the projected real rate declines by the same amount. The BC forecasts follow a similar trend. Focusing on the real rate, the downward trend extends back to 2007. This suggests that views about what constitutes a “normal” federal funds rate have been declining for some time. While there are notable fluctuations in the real rate before 2007, these seem to be around a constant mean of about 2%. The current BC forecasts of the nominal and real short-term interest rate are at historical lows. The declines in recent years are not unprecedented in terms of magnitude, but have occurred over a longer period than earlier declines.
This pattern for short-term rates is somewhat different from the one observed for longer-term real Treasury bond rates, which appear to have been declining since the early 1980s (not shown).13 In a series of Brookings Institution blogs, former Federal Reserve Board Chairman Ben Bernanke reviews the main hypotheses for declines in real interest rates on safe assets.14 Similar to the longer-run projections of GDP growth and the unemployment rate, powerful forces beyond the control of the FOMC appear to be the root cause of the declines.15
Lower longer-run projections for returns on safe assets have important implications for monetary policy. Other things being equal, a lower funds rate makes it more likely that the FOMC will be constrained in its ability to counter an adverse shock to the economy because of the zero lower bound on nominal interest rates. As discussed by Evans et al. (2015),16 this consideration suggests the FOMC should be more cautious when raising short-term interest rates than it otherwise might be.
Conclusion
In summary, the longer-run economic projections of the FOMC’s participants and the private sector have followed similar paths over the past few years. Both sets of projections for GDP growth, unemployment, and short-term interest rates have declined quite substantially. These declines appear to reflect a growing consensus over driving forces in the economy beyond the control of the FOMC and not changes in the operating characteristics of monetary policy. However, the lower longer-run projections for short-term interest rates do suggest that the FOMC is now more likely to be constrained by the zero lower bound, which does complicate the policymaking calculus going forward.
1 Not all FOMC participants vote on monetary policy in any given year. The president of the Federal Reserve Bank of New York and all the Federal Reserve Governors vote at every meeting. Four additional votes circulate among the remaining Reserve Bank presidents according to a mandated schedule.
2 After five years, additional materials associated with the SEPs are released along with transcripts and documents provided to participants in advance of each FOMC meeting. These materials include answers to the question, “Does your view of the appropriate path of interest rates differ materially from the interest rate assumed by the staff in the Greenbook?” The term “Greenbook” refers to the document describing the macroeconomic outlook prepared by the staff of the Board of Governors in advance of each FOMC meeting. If participants answer yes to this question, they are asked to describe how their path differs. In principle, one might be able to construct the full range of policy assumptions with this information.
3 Then-Governor Janet Yellen summarized the rationale for these January 2012 changes at the December 2011 FOMC meeting. Her summary can be found in the recently released transcripts from the December 2011 FOMC meeting, https://www.federalreserve.gov/monetarypolicy/files/FOMC20111213meeting.pdf starting on p. 115.
4 See Ben S. Bernanke, 2016, “Federal Reserve economic projections: What are they good for?,” Ben Bernanke’s Blog, Brookings Institution, November 28, https://www.brookings.edu/blog/ben-bernanke/2016/11/28/federal-reserve-economic-projections/, for further discussion of the benefits of the SEP.
5 The SEPs are available at https://www.federalreserve.gov/monetarypolicy/fomc.htm. The complete BC survey is available by paid subscription. The longer-run projections displayed here are used by permission and extracted from the Haver Analytics database.
6 A minor discrepancy is that the growth rates reported by the BC survey are full year over full year rather than the fourth-quarter-over-fourth-quarter growth rates reported in the SEP.
7 See https://www.clevelandfed.org/newsroom-and-events/publications/economic-trends/2014-economic-trends/et-20140417-pce-and-cpi-inflation-whats-the-difference.aspx for a discussion of the key differences between the PCE deflator and CPI.
8 Other surveys with longer-run forecasts include the Survey of Professional Forecasters (SPF), which is maintained by the Federal Reserve Bank of Philadelphia, and the University of Michigan’s Surveys of Consumers (MSC). The SPF asks for longer-run projections for PCE (since 2007) and CPI inflation (since 1991), as well as real GDP growth (since 1992). However, the questions posed ask for average rates over the following ten years. These forecasts may confound short-term developments and the longer-run projections we are interested in. Similarly, the MSC has longer-run consumer price inflation projections (since 1979), but these are averages over the next five years and so are even more likely to be influenced by short-term developments.
9 For an investigation of how BC forecasters infer permanent and transitory shocks to real GDP from incoming data, see Spencer D. Krane, 2011, “Professional forecasters’ view of permanent and transitory shocks to GDP,” American Economic Journal: Macroeconomics, Vol. 3, No. 1, January, pp. 184–211.
10 See John G. Fernald, 2016, “Reassessing longer-run U.S. growth: How low?,” Federal Reserve Bank of San Francisco, working paper, No. 2016-18, August.
11 See Daniel Aaronson, Luojia Hu, Arian Seifoddini, and Daniel G. Sullivan, 2015, “Changing labor force composition and the natural rate of unemployment,” Chicago Fed Letter, Federal Reserve Bank of Chicago, No. 338, https://www.chicagofed.org/publications/chicago-fed-letter/2015/338.
12 The real rate is defined as the six-year-ahead forecast of the nominal rate less the six-year-ahead CPI inflation forecast.
13 See R. E. Hall, 2016, “The role of growth of risk-averse wealth in the decline of the safe real interest rate,” Stanford University, manuscript, for a recent discussion and some useful references.
14 See https://www.brookings.edu/blog/ben-bernanke/.
15 According to standard economic theory, long-run real interest rates are closely tied to the long-run growth rate of the economy. From this perspective, the decline in the SEP federal funds rate projection is consistent with the decline in the projections for real GDP growth.
16 See Charles Evans, Jonas Fisher, Francois Gourio, and Spencer Krane, 2015, “Risk management for monetary policy near the zero lower bound,” Brookings Papers on Economic Activity, Spring.


