

Many studies document the predictive power of the slope of the Treasury yield curve for forecasting recessions.2 This work is motivated, for example, by the empirical evidence in figure 1, which shows the term-structure slope, measured by the spread between the yields on ten-year and two-year U.S. Treasury securities, and shading that denotes U.S. recessions (dated by the National Bureau of Economic Research). Note that the yield-curve slope becomes negative before each economic recession since the 1970s.3 That is, an “inversion” of the yield curve, in which short-maturity interest rates exceed long-maturity rates, is typically associated with a recession in the near future.
1: Ten-to-two year yield-curve spread

Source: Authors' calculations.
Previous research has exploited this empirical regularity to estimate recession probabilities using statistical models such as probit specifications. An example is the probit analysis in figure 2, which shows the fitted probability that a recession will occur over the next year when the explanatory variable is the ten-to-two-year yield-curve spread. The fitted probability peaks before the beginning of each recession, with the exception of a false positive in the mid-1960s.
2. Estimated recession probabilities, long-spread model
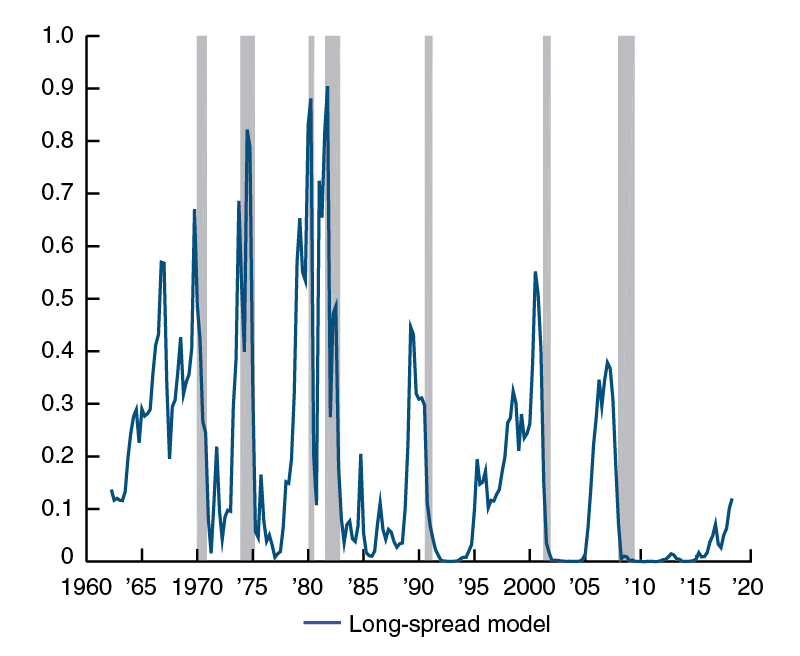
Source: Authors' calculations.
While the literature has found predictive content in this variable, it has been less successful at establishing why such an empirical association holds. There does seem to be broad agreement among financial economists that the slope of the yield curve contains information about current and expected future monetary policy actions—i.e., the raising or lowering of the federal funds rate by the Federal Reserve—which in turn are linked to expectations of future business cycle outcomes. However, this is an incomplete accounting because the yield curve is influenced by more than monetary policy expectations. In particular, the yield curve also reflects market attitudes toward various risks, and these too are influenced by economic outcomes. If the differences between the long-run and short-run values for either policy expectations or risk factors reflect market assessments of the probability of a recession in the future, then—to the degree these assessments are either correct or self-fulfilling—they will be useful in forecasting recessions.
Moreover, the expected interest-rate path and risk premium themselves have multiple components. Expected rates are shaped by market participants’ views on the future evolution of both inflation and real (inflation-adjusted) interest rates. Similarly, the risk faced by bondholders reflects uncertainty associated with both future inflation and the future real interest-rate path. The slopes of these separate components of expectations and risk premia could contain different information about future economic scenarios that might improve forecasts.
In this Chicago Fed Letter, we explore the distinct effects of these channels on the estimated probability of a recession and find that they do have different influences. We also offer some economic interpretations for these relationships between the yield curve and the broader macroeconomy.
The yield-curve slope and recession risk
The literature has focused on many different measures of the yield-curve slope, or term spread. Academic studies have often used the difference between the yield on the ten-year Treasury note, which reflects the long-term views of bond investors, and the three-month Treasury bill rate, which is a close substitute for the federal funds rate targeted by the Federal Reserve’s policymaking body, the Federal Open Market Committee (FOMC). Practitioners and financial commentators, on the other hand, often use the difference between the ten- and two-year yields.4 Both measures have merit and, indeed, they generally produce qualitatively similar results when included in statistical models for forecasting recessions.
Why might these yield-curve slopes help predict recessions? Recall the interest rate on a long-term bond in part reflects the path of short-term interest rates expected over the life of the bond. In turn, this expected path is influenced by views about the business cycle and monetary policy. If market participants expect a downturn, they likely also anticipate that the FOMC will cut the future policy rate to provide monetary policy accommodation. The expectation of lower future rates reduces longer-term rates, and this could result in an inverted yield curve. A related explanation is that market participants might expect that aggressive monetary policy tightening by the FOMC, which would push up current rates relative to future ones, heightens the odds of a future decline in economic activity. To the degree the market’s forecast of a downturn is correct, such moves in the yield-curve slope will be associated with a higher probability of a future recession.
To better isolate this monetary policy channel, Engstrom and Sharpe (2018)5 study an alternative yield-curve slope measure given by the difference between the six-quarter-ahead forward rate on U.S. Treasury securities and the current three-month Treasury bill rate, which they call the “near-term forward spread.”6 They argue that the six-quarter-ahead forward rate helps identify relevant market expectations of future monetary policy actions more precisely than spreads based on the ten-year yield. This is because the long-term yield is an average of the forward rates over ten years, and thus it dilutes the signal in forward rate movements over shorter time periods associated with business cycle fluctuations. Consistent with this intuition, Engstrom and Sharpe (2018) find that the near-term forward spread crowds out other slope measures in probit models predictive of U.S. recessions and conclude that a negative near-term spread may only predict recessions because it reflects the market’s expectation that a contracting economy will induce the Federal Reserve to lower its policy rate.
Monetary policy expectations, however, might not be the only channel that links the yield curve slope to future economic activity. Changes in the slope could also be driven by fluctuations in market participants’ attitudes toward risk, and these movements could also help forecast economic downturns. To study this second channel, we can use a dynamic term-structure model (DTSM) to break down the nominal yield y on a Treasury security of any given maturity into components associated with expected inflation, expected real interest rates, and the risk premia that investors require to invest in a security that exposes them to inflation and real interest rate risks:
1) ${y=\underbrace{{{\pi }^{\text{EP}}}+{{y}^{*\text{EP}}}}_{{{y}^{\text{EP}}}}+\underbrace{IRP+RRRP}_{TP}+\varepsilon ,}$
where ${{{\pi }^{\text{EP}}}}$ is the average expected path (EP) of consumer-price inflation over the bond’s life and ${{{y}^{*\text{EP}}}}$ is the average expected path of the inflation-adjusted real rate over the same horizon. The sum of these components, ${{{y}^{\text{EP}}}}$, is the expected path of the nominal interest rate. The bond’s yield also contains an inflation risk premium ${IRP}$ and a real rate risk premium ${RRRP}$, which reflect the compensation for the uncertainty associated with the future evolution of inflation and real interest rates, respectively. Their sum, which captures the total compensation that investors demand to bear interest rate risk, is known as the term premium, ${TP}$. Finally, the observed Treasury yield may differ from the DTSM-implied value by an error term ${\varepsilon}$; since ${\varepsilon }$ is small, we omit it from the rest of the analysis.
Using equation 1, we can decompose the slope of the yield curve into the slope of its expectations and risk-premia components:
2) ${\text{slope}\,y=\underbrace{\text{slope}~{{\pi }^{ \text{EP}}}+~\text{slope}~{{y}^{\text{*EP}}}}_{\text{slope}~{{y}^{\text{EP}}}}+\underbrace{\text{slope}~IRP+\text{slope}~RRRP}_{\text{slope}~TP}.}$
Fluctuations in each of these terms could be associated with different growth prospects. We explore this issue by using an estimated DTSM to construct these various components and then allowing these variables to have different impacts in a probit model that estimates the probability that the U.S. economy will enter a recession within the next year. The details of the analysis can be found in Benzoni and Chyruk (2018).7
We do not use the exact decomposition presented in equations 1 and 2. Because the expected monetary policy explanations focus on a shorter time frame than ten years, we use slope ${{{y}^{\text{EP}}}}$ terms that concentrate on near-term spreads. More specifically, for slope ${{{\pi }^{\text{EP}}}}$ we use the difference between the model’s forecast for inflation six quarters ahead and its projection of average inflation over the next three months; for slope ${{{y}^{*\text{EP}}}}$ we use the difference between the model’s six-quarter-ahead and current three-month forecast for real interest rates. For a variety of reasons, changes in attitudes toward risk appear more pronounced in the pricing of longer-term bonds.8 So for slope ${IRP}$ and slope ${RRRP}$, we use the difference between the ten-year and two-year ${IRP}$ and ${RRRP}$ terms from the DTSM model. Finally, along the lines of Harvey (1988) and Estrella and Hardouvelis (1991), we also control for current monetary policy by including the DTSM-implied estimate of the current real rate.9
We find that a monetary policy easing, either current or expected, is associated with an increase in the probability of a future recession. In particular, all else being equal, a decline in the spot real rate or a fall in the near-term spread in the real expected rate path boosts the model’s probability of recessions. The effects are statistically significant.
The spread in the expected inflation component does not improve the model fit. We thus exclude it from the baseline probit specification. This result is consistent with the interpretation that, over the post-1985 sample period, inflation expectations remained relatively stable even when recession risk was heightened. It is the expectation of future monetary policy, measured by changes in the slope of the expected real-rate path, that contains the recession signal.
Changes in long-term risk premia also contain predictive information.10 A fall in the ${IRP}$ slope increases the probability of a recession. Why might this be? In periods of low inflation, the fixed nominal cash flows from a nominal bond become more attractive, driving up the prices of these bonds and lowering their interest rate. In recent recessions, the risks of unexpectedly low inflation have increased relative to the risks of unexpectedly high inflation.11 Hence, if investors see higher odds of a recession, the long-term inflation risk premium in Treasury bonds will fall. In contrast, an increase in the long-term ${RRRP}$ spread is associated with an increase in the recession probability. One interpretation is that if investors see greater risk of recession, they will attribute higher value to short-term assets that they can easily liquidate to finance spending on goods and services. Hence, they will require higher compensation, i.e., a higher ${RRRP}$, to keep holding long-term securities. Note that the direction of the ${RRRP}$ spread is the opposite of conventional wisdom—a decline in the yield-curve slope due to a lower ${RRRP}$ spread is a signal of reduced, not higher, recession odds.
Figure 3 displays fitted probabilities for the sample period from 1985:Q1 to 2018:Q1 that the U.S. economy will enter a recession over the next year. The red line shows the recession probability estimated using the Benzoni and Chyruk (2018) model, while the blue line shows the fit of a probit model that includes the ten-to-two-year yield-curve spread as a single predictor of downturns (the “long-spread” model). In both models, the estimated probability increases before recessions. However, the red line exhibits more-pronounced peaks before each of the three recessions in the sample. Also, compared with the blue line, the red line downplays the risk of recession in the 1990s and in recent years. This indicates that the model in Benzoni and Chyruk (2018) provides better forecasts than the more traditional probit specification with a lone yield-curve slope predictor; in particular, a statistical test of equal predictive accuracy of the long-only model and the Benzoni–Chyruk model is rejected with a 1% ${p-\text{value}}$.12 In either case, as of the first quarter of 2018, the two models estimate the recession probability to be fairly small at around 17%.
Estimated recession probabilities, long-spread and Benzoni−Chyruk models
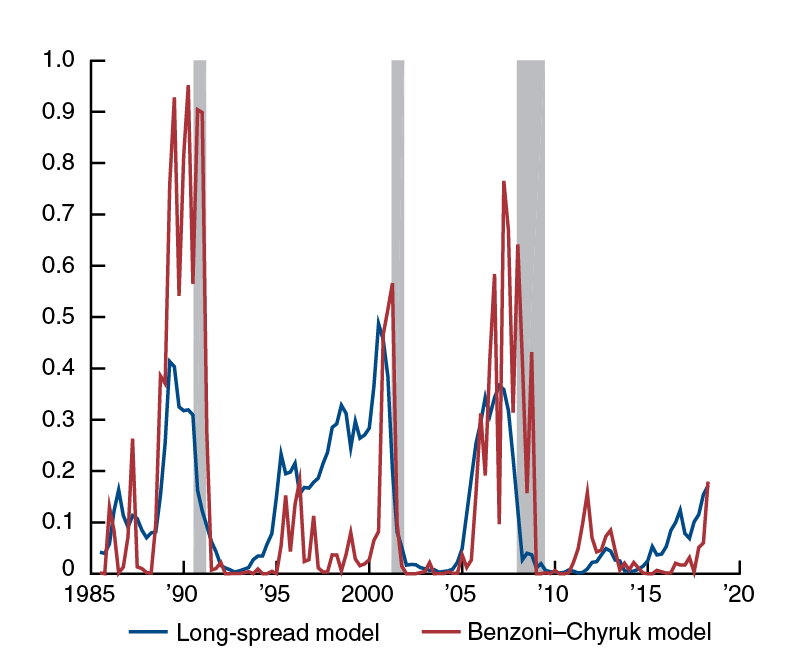
Source: Authors' calculations.
Conclusion
Why is an inverted yield-curve slope such a powerful predictor of future recessions? Many different variables determine the conditions and evolution of the economy, and the yield-curve slope summarizes them into a single indicator. Here we discuss our work in Benzoni and Chyruk (2018), which finds that a decomposition of the yield-curve slope into its expectations and risk-premia components helps disentangle the channels that connect fluctuations in Treasury rates and the future state of the economy.
In particular, we find that a monetary policy easing, reflected in either a lower current real-interest rate level or a decline in the expected real-rate spread, is associated with an increase in the probability of a recession within the next year. In contrast, a decrease in the slope of risk premia is associated with either a higher or lower recession probability, depending on the source of the decline. In recent years, a decrease in the inflation risk-premium slope has been accompanied by a heightened risk of a recession, while a lower real-rate risk-premium slope has been a signal of diminished recession probabilities. This means that not all declines in the yield-curve slope are bad news for the economy, and not all instances of steepening are good news either.13
Of course, the empirical results we have described in this article do not imply that a yield-curve inversion causes a recession. Rather, it could be that the slope itself fluctuates to reflect changing expectations about the economy, and these expectations are useful predictors of economic downturns.
Furthermore, our results hinge on a number of modeling assumptions. First, we rely on a specific DTSM to parse the expectations and risk premia term-structure components. Second, there are many possible specifications for probit models of recession probabilities. Our results are robust to a number of alternative modeling choices that we have examined, but certainly not all. The results we discuss here are based on a particular set of choices and are one piece of a broader work in progress aimed at gaining a better understanding of the relationship between the yield curve and the macroeconomy.
1 We thank Spencer Krane and Gene Amromin for encouraging us to write this Chicago Fed Letter and for providing very useful suggestions; we are also grateful to Cam Harvey and Glenn Rudebusch for their comments.
2 See, e.g., Reuben A. Kessel, 1965, “The cyclical behavior of the term structure of interest rates,” National Bureau of Economic Research, occasional paper, No. 91; Eugene F. Fama, 1986, “Term premiums and default premiums in money markets,” Journal of Financial Economics, Vol. 17, No. 1, pp. 175–196; and the following papers by Campbell R. Harvey: 1988, “The real term structure and consumption growth,” Journal of Financial Economics, Vol. 22, No. 2, pp. 305–333; 1989, “Forecasts of economic growth from the bond and stock markets,” Financial Analysts Journal, September/October, pp. 38–45; 1991, “The term structure and world economic growth,” Journal of Fixed Income, Vol. 1, pp. 4–17; and 1993, “The term structure forecasts economic growth,” Financial Analysts Journal, May/June, pp. 6–8. Also, Arturo Estrella and Gikas A. Hardouvelis, 1991, “The term structure as a predictor of real economic activity,” Journal of Finance, Vol. 46, No. 2, June, pp. 555–576; Arturo Estrella and Frederic S. Mishkin, 1998, “Predicting U.S. recessions: Financial variables as leading indicators,” Review of Economics and Statistics, Vol. 80, No. 1, February, pp. 45–61; Glenn D. Rudebusch, Brian P. Sack, and Eric T. Swanson, 2007, “Macroeconomic implications of changes in the term premium,” Federal Reserve Bank of St. Louis, Review, July/August, Vol. 89, No. 4, pp. 241–69; and Glenn D. Rudebusch and John C. Williams, 2009, “Forecasting recessions: The puzzle of the enduring power of the yield curve,” Journal of Business & Economic Statistics, Vol. 27, No. 4, pp. 492–503.
3 Note, however, the exception in the mid-1960s, when a negative yield-curve slope was not followed by a recession.
4 See, e.g., Michael D. Bauer and Thomas M. Mertens, 2018, “Information in the yield curve about future recessions,” FRBSF Economic Letter, Federal Reserve Bank of San Francisco, No. 2018–20, August 27, available online.
5 Eric Engstrom and Steve Sharpe, 2018, “The near-term forward yield spread as a leading indicator: A less distorted mirror,” Finance and Economics Discussion Series, Board of Governors of the Federal Reserve System, No. 2018–055, July. Crossref
6 The six-quarter-ahead forward rate is the (implicit) interest rate on a three-month Treasury bill six quarters in the future that is embedded in market pricing; it is calculated by looking at the difference between the current market price of Treasury securities maturing in seven quarters and the price of those maturing in six quarters.
7 Luca Benzoni and Olena Chyruk, 2018, “The yield-curve slope and economic activity,” Federal Reserve Bank of Chicago, working paper, forthcoming. The analysis uses the DTSM model developed in Andrea Ajello, Luca Benzoni, and Olena Chyruk, 2014, “Core and ‘crust’: Consumer prices and the term structure of interest rates,” Federal Reserve Bank of Chicago, working paper, No. 2014-11, November, available online, to extract expectation and risk-premia components from the U.S. Treasury yield curve.
8 For instance, the nominal two- and ten-year Treasury securities are highly liquid (e.g., Andrea Ajello, Luca Benzoni, and Olena Chyruk, 2012, “No-arbitrage restrictions and the U.S. Treasury market,” Economic Perspectives, Federal Reserve Bank of Chicago, Vol. 36, Second Quarter, pp. 55–74, available online). We confirm, however, that including near-term ${IRP}$ and ${RRRP}$ slopes in the probit model produces qualitatively similar results.
9 Prior to estimation, Benzoni and Chyruk (2018) remove a linear trend from all the explanatory variables included in the probit model.
10 This extends previous work by Andrew Ang, Monika Piazzesi, and Min Wei, 2006, “What does the yield curve tell us about GDP growth?,” Journal of Econometrics, Vol. 131, Nos. 1–2, March–April, pp. 359–403; Michael D. Bauer and Thomas M. Mertens, 2018, “Economic forecasts with the yield curve,” FRBSF Economic Letter, Federal Reserve Bank of San Francisco, No. 2018-07, March 5, available online; Michael D. Bauer and Thomas M. Mertens, 2018, “Information in the yield curve about future recessions,” FRBSF Economic Letter, Federal Reserve Bank of San Francisco, No. 2018-20, August 27, available online; Carlo A. Favero, Iryna Kaminska, and Ulf Söderström, 2005, “The predictive power of the yield spread: Further evidence and a structural interpretation,” working paper, Università Bocconi; James D. Hamilton and Dong Heon Kim, 2002, “A reexamination of the predictability of economic activity using the yield spread,” Journal of Money, Credit and Banking, Vol. 34, No. 2, pp. 340–60; Rudebusch, Sack, and Swanson (2007); and Jonathan H. Wright, 2006, “The yield curve and predicting recessions,” Board of Governors of the Federal Reserve System, Finance and Economics Discussion Series, No. 2006-7, who exploit a term-structure decomposition into its expected nominal rate path and term premium terms.
11 See, e.g., John Y. Campbell, Adi Sunderam, and Luis M. Viceira, 2017, “Inflation bets or deflation hedges? The changing risks of nominal bonds,” Critical Finance Review, Vol. 6, No. 2, pp. 263–301. Crossref
12 This is based on a nonparametric test of equal areas under the receiver operating characteristic (ROC) curves that evaluates the probability of detecting a recession against the probability of a false positive. For details, see Elizabeth R. DeLong, David M. DeLong, and Daniel L. Clarke-Pearson, 1988, “Comparing the areas under two or more correlated receiver operating characteristic curves: A nonparametric approach,” Biometrics, Vol. 44, No. 3, September, pp. 837–845. Crossref
13 In addition, other factors could confound the signal in the yield-curve slope. For example, central bank asset-purchase programs and a strong worldwide demand for safe assets could compress long-term U.S. Treasury yields. Hence, in such an environment a decline in the yield-curve slope might not have the significance that the historical record would suggest. See Board of Governors of the Federal Reserve System, 2018, “Minutes of the Federal Open Market Committee, July 31–August 1, 2018,” press release, Washington, DC, August 22, available online.


