

This article examines consumers’ borrowing behavior and debt levels in the wake of Hurricane Harvey. We find that high levels of flooding from Harvey were associated with modest increases in auto loan balances, but moderate decreases in mortgage balances. In general, the storm did not hurt consumers’ credit access according to the limited measures we investigate. These results are influenced by a number of factors, including federal disaster assistance, insurance payouts, and creditors permitting temporary postponements in loan payments, with such delays not being reported to credit bureaus.
When Hurricane Harvey made landfall on August 25, 2017, it became the first category 4 storm to strike Texas since 1961. In the days that followed, Houston and its surrounding area experienced record amounts of rainfall, which caused catastrophic flooding. An estimated 40,000 individuals took refuge in shelters, 300,000 structures were damaged, and a half million cars were flooded.1
Harvey was just one of several major (category 3 or higher) hurricanes to hit the U.S. in recent years. In terms of estimated total damages, four of the five costliest hurricanes in U.S. history have occurred in the past seven years, even after adjusting for inflation. Climate scientists have expressed concerns that this recent wave of devastating storms is not an anomaly, but rather part of a long-term trend. Given the toll that these storms can inflict, it is important to understand the effects of hurricanes on individuals’ financial well-being.2
In this article, we assess the impact that Hurricane Harvey had on the finances of people living in areas that were flooded. In our analysis, we focus our attention on auto loans and home mortgages. These forms of credit are particularly relevant for studying how individuals fare in the wake of a hurricane, given that flooding can damage vehicles and residences tied to these types of loans. We also examine credit scores and loan delinquency rates, which provide summary measures of consumers’ financial conditions.
We find that following Harvey, residents in flooded areas, on the whole, had temporary modest increases in auto debt relative to their counterparts in nonflooded areas. Additionally, we find that in general, residents in flooded regions moderately reduced their home mortgage balances. Previous research by Gallagher and Hartley3 examined the effects of flooding on the financial outcomes of New Orleans residents after Hurricane Katrina and found similar results. While these effects may seem minor, it is important to remember two things: First, the effects that can be measured using credit history data—which track borrowing levels and loan delinquencies—reflect the impact of the hurricane after any disaster aid disbursements, insurance payouts, and savings and retirement account drawdowns have been made. Second, since flood depth is only a proxy for flood damage, we are likely measuring the average effects of flooding among both people who faced severe damage and those with only mild or no damage.
Methodology and findings
The impact of flooding on consumers’ debt levels depends on the degree to which they are insured against flood damage due to a natural disaster. For instance, comprehensive private auto and federal flood insurance policies can provide consumers with funds to replace damaged cars or repair flooded homes. As discussed in a recent article by our Chicago Fed colleagues, several forms of federal financial assistance are in place for victims of natural disasters, including direct cash grants from the Federal Emergency Management Agency (FEMA) and low-interest-rate disaster loans from the U.S. Small Business Administration (SBA).4 Furthermore, creditors can mitigate the short-run negative impact of natural disasters on consumers’ credit scores (and, consequently, their credit access) by not reporting late payments to the credit bureaus.
We focus on residents of southeast Texas counties declared presidential disaster areas who were eligible for individual assistance from FEMA following Harvey.5 Data on individual consumers’ credit usage are from the Federal Reserve Bank of New York Consumer Credit Panel/Equifax (CCP) database—a 5% sample of all consumers with a Social Security number and a credit history. These data contain a quarterly snapshot of borrowing activity, the age of the borrower, and the census block where the borrower lives. To identify which census blocks within the presidential disaster declaration areas were flooded by Harvey, we use two spatial data sets produced by FEMA—one based on satellite imagery that shows if an area was flooded or not and another based on hydrological modeling that indicates the depth of flooding.6 We separate residents of the Harvey-affected counties first by whether they experienced no flooding or some flooding.7 Next, we separate the flooded residents into four groups of roughly the same size based on the depth of flooding where they lived (zero to one feet, one to two feet, two to three feet, and three or more feet). We use flood depth as a proxy for the amount of damage they received from the storm. We also use the Dallas–Fort Worth region, which was not inundated by Harvey, as a point of comparison.
Effects on consumer account balances
To examine the effects of Harvey on consumers’ financial well-being, we investigate changes in consumers’ credit account balances, originations, and closures. How a natural disaster like Harvey affects consumer credit balances depends on whether consumers own vehicles or homes damaged by flooding or wind and whether they are eligible for low-interest-rate SBA disaster loans. Auto loan balances would likely increase if consumers do not have enough money from savings to replace a damaged vehicle. However, damage to homes may lead to lower mortgage balances in some cases. If consumers are eligible for low-interest-rate SBA disaster home loans, they may switch from a traditional mortgage to an SBA disaster loan, which would get recorded in credit history data as paying off a mortgage and not entering into a new mortgage (because SBA disaster loans are not reported to the credit bureaus). We may also see mortgage balances fall if consumers use flood insurance proceeds to pay off their mortgages and then move into rental housing. Finally, a disaster’s impact on credit scores is ambiguous for a few reasons. First, some lenders and mortgage servicers offer some type of debt forbearance (allowing for a pause in loan payments) for a period of time after a natural disaster, with the additional benefit of not reporting the delayed payments to credit bureaus. As a result, credit scores will appear better than they otherwise would have been. Second, government disaster aid such as grants and low-interest-rate loans may provide enough flexibility for consumers both to overcome the adverse effects of the disaster and to restructure their debt in a way that allows them to improve their credit scores.
Auto loans
In the aftermath of Harvey, consumers in the most flooded areas (three or more feet) saw an average increase of $705 in their total debt balances, excluding mortgage and student loan accounts, whereas consumers in areas with no flooding saw an increase of just $209, on average. This disparity was driven primarily by increases in auto loan balances between the quarter before Harvey hit (2017:Q2) and the quarter after (2017:Q4). Consumers in the most flooded group who had auto loans before Harvey had an average spike of $777 in their auto loan balances. In contrast, consumers in the nonflooded group who had auto loans before the hurricane saw an average drop of $10 in their auto loan levels, and those in the Dallas–Fort Worth region saw an average increase of just $106.8
One explanation for the relatively larger average increase in auto balances among consumers in the most flooded areas is that they took out new loans with higher balances to replace cars damaged by the storm. Indeed, 29,200 new vehicles were purchased in the Houston metro area in October 2017 (shortly after Harvey)—up 30% from a year before.9 To estimate the number of consumers who replaced their cars, we consider the number of consumers who had an auto balance increase of $1,000 or more in the quarter immediately following Harvey. We find that 9% of consumers in the most flooded areas (representing more than 60,000 individuals) had an auto balance increase of $1,000 or more. These increases may be driven by both new and used vehicle purchases. The top 10% of auto balance changes represent increases in auto debt of more than $19,000—consistent with levels that might be needed to finance the purchase of a new car.
In Texas, lenders can pursue the remaining balance on an auto loan even after the vehicle has been repossessed. However, it is unlikely that many people were left with a flood-damaged car and no money to pay off the loan balance. This is because auto lenders typically require that borrowers have comprehensive auto insurance policies for the life of the loans. Comprehensive policies typically cover damage due to flooding. So it is likely that many people who had outstanding auto loans and whose vehicles were damaged by flooding received insurance payments to replace their vehicles. Overall, the flooding due to Harvey damaged a very large number of cars and resulted in a noticeable increase in consumer auto debt in the areas with the most flooding.10
Mortgages
Overall, consumers in the most flooded areas saw their total mortgage account balances decrease in the quarter after Harvey.11 Between the quarter before and the quarter after Harvey, the median change in mortgage balances was a decrease of about $2,000 for each of our groups in and around Houston and for our comparison group in Dallas–Fort Worth (specifically, in Dallas and Tarrant Counties). That said, over the same period, consumers in the most flooded areas saw their mortgage balances decline by about $3,000, on average, whereas residents in the nonflooded areas saw their mortgage balances decrease by only $427, on average. Over the same period, consumers in Dallas–Fort Worth actually saw a mean increase of $3,358 in their mortgage balances.
The average decrease in mortgage balances in the most flooded regions was driven by a spike in the rate of mortgage account closures.12 This spike could be due to borrowers selling damaged houses, using flood insurance payouts to pay off mortgages on damaged houses, or closing out private mortgages and switching to low-interest-rate SBA disaster loans. Six months after Harvey, the SBA had approved about $3.2 billion in low-interest loans for those affected by the hurricane.13 As illustrated in figure 1, the rate of mortgage closures roughly doubled in the quarter after Harvey for consumers in the most flooded areas. One quarter later, we also find a spike in the share of consumers who originated a mortgage (not shown). Taken together, these trends suggest that some consumers in areas heavily flooded by Harvey paid off mortgages on their damaged homes. Interestingly, these trends were seen in both the most flooded and no flooding groups. Notably, flooding is not the only cause of damage from hurricanes—property in nonflooded areas could have been damaged from high winds or other storm-related factors.
1. Mortgage closure rate
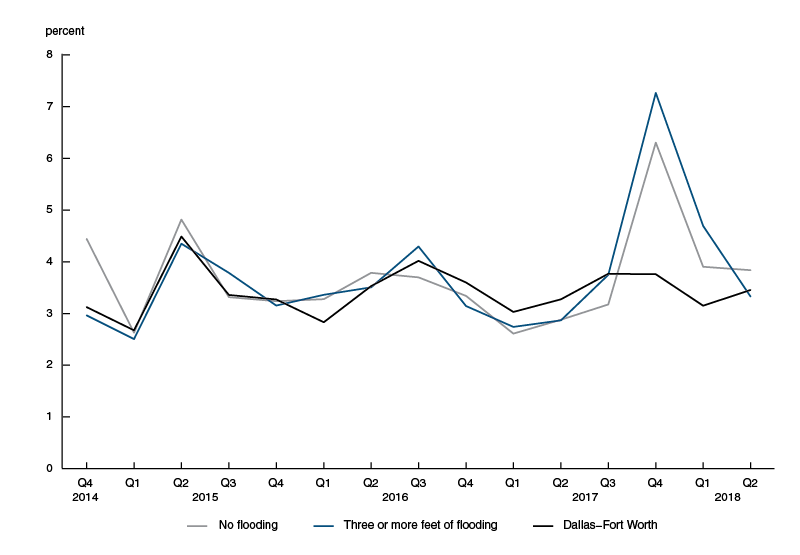
Sources: Authors’ calculations based on data from the Federal Reserve Bank of New York Consumer Credit Panel/Equifax (CCP); and Federal Emergency Management Agency.
Credit scores
After Harvey hit, some large lenders offered to waive customer fees and not report their late loan payments. Notably, Fannie Mae, Freddie Mac, and the Federal Housing Administration agreed to offer loan forbearance for homeowners in the affected region for extended periods—varying from 90 days to a full year.14 Consistent with these actions, we find that mortgage servicer data show late payments increased after Harvey, yet late payments in Equifax credit records fall after Harvey. Credit panel data from Equifax show a drop of about 2 percentage points in the share of consumers with past due accounts in and around Houston between 2017:Q2 and 2017:Q4 (figure 2). But mortgage data from Black Knight McDash show mortgage delinquency rates roughly doubling from July to October of 2017 for Harris County, where Houston is located and where flooding was the most severe (figure 3).
2. Share of consumers with a past due account
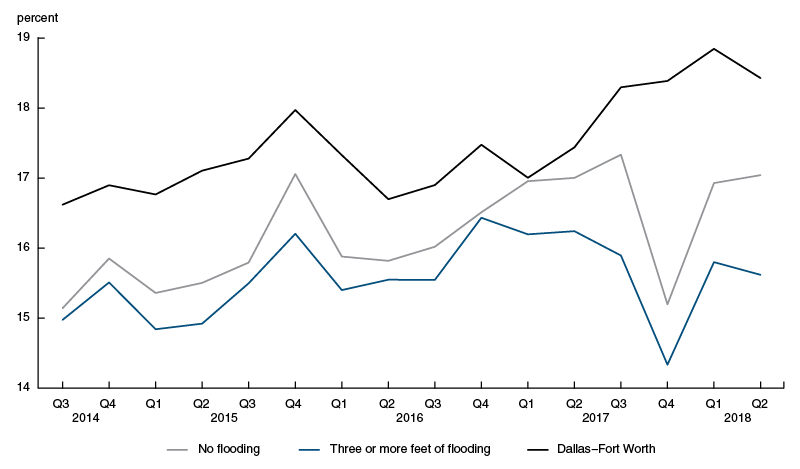
Sources: Authors’ calculations based on data from the Federal Reserve Bank of New York Consumer Credit Panel/Equifax (CCP); and Federal Emergency Management Agency.
3. Mortgage delinquency rate
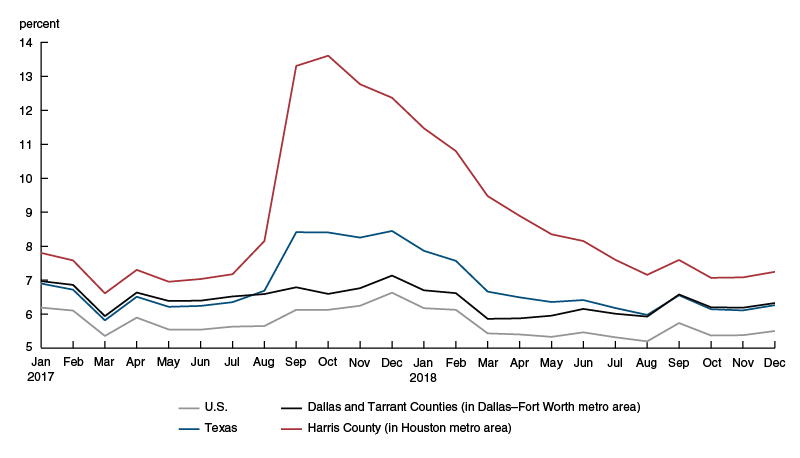
Source: Authors’ calculations based on data from Black Knight McDash.
These actions by lenders likely played a role in the recovery of the Houston metro area and certainly protected consumers’ credit scores from post-disaster declines. Although outstanding total balances in the most flooded group increased by an average of $705, credit scores for consumers in this group actually edged up, on the whole (though scores for consumers in Dallas–Fort Worth edged down), according to the CCP data.
The role of insurance and aid
While the effects of Hurricane Harvey on outcomes that can be measured in credit records may seem surprisingly small, recall that households may draw down savings and retirement accounts to offset the financial costs of recovery (a form of self-insurance). They also may receive payouts from flood, homeowners, or auto insurance policies or get governmental aid in the form of individual assistance grants from FEMA or low-interest-rate household disaster loans from the SBA. Unfortunately, we do not observe these types of insurance and aid payouts at the individual or household level. However, with the exception of self-insurance, we can estimate the size, on average, and get a sense of the share of the Harvey-affected population that received (or borrowed) money from these various sources.
In the aftermath of Harvey, FEMA approved about 370,000 individual and household assistance applications in Texas, amounting to about $1.6 billion in grants. This represents about $4,400 per applicant, according to our calculations. In general, FEMA encourages individual assistance applicants to also apply for low-interest-rate SBA disaster loans. In the 90 days following Harvey, $2.6 billion of low-interest-rate disaster loans had been approved for 30,000 businesses and residents (roughly $87,000 per loan). In January 2018, the Texas Department of Insurance estimated that the ultimate gross losses paid by automobile insurers because of Harvey would be $2.7 billion. The same losses for residential property insurers were estimated to be $2.5 billion. Assuming the same group of 370,000 affected individuals and households that received FEMA aid were at risk for auto and home damages implies that the average auto and home insurance payouts were roughly $7,200 and $6,700, respectively. These average payout amounts may seem low compared with the value of a car or a home, but they likely reflect the fact that not everyone owns a vehicle or home and that not all owners carry insurance that covers losses due to flooding or wind. Finally, the federal government’s National Flood Insurance Program (NFIP) estimated that it paid out over $8.5 billion in claims to those affected by Harvey in the first six months following the storm.15
Despite the large dollar figure for NFIP payouts, flood insurance coverage rates were not very high in the Houston metro area when Harvey struck. Indeed, after the storm, many news stories highlighted how large the flood insurance gap (the difference between the number of people eligible for federal flood insurance and the number who were actually enrolled) was in the Houston metro region. Just 17% of homeowners in the eight counties most directly affected by Harvey had flood insurance. The NFIP paid out about 76,000 claims due to Harvey in Texas, roughly a fifth of the number of FEMA grants. Although other channels for financial relief exist, flood insurance policies typically offer much higher payouts. The standard NFIP flood insurance policy covers up to $250,000 in rebuilding costs and up to $100,000 to replace personal property. The average NFIP payout in Texas due to Harvey was roughly $117,000.16
Concluding remarks
Consistent with prior research on consumer finances after natural disasters, we find that high levels of flooding due to Hurricane Harvey were associated with modest increases in auto loan balances and moderate decreases in mortgage balances. These observed changes in credit accounts were likely influenced by a number of factors. FEMA individual assistance grants and SBA disaster loans provided some financial relief for those living in a presidential disaster declaration zone; and lump-sum payouts from auto, home, and flood insurance policies helped defray the cost of damages. Further funds may have become available from people choosing to draw down their savings and retirement accounts. Loan forbearance offered by lenders may have helped some individuals maintain their credit access after the disaster.
Further study of the effects of natural disasters on consumer well-being is warranted given the potential for more storms like Harvey in the future. A more in-depth investigation of the ways in which public disaster grants and loans interact with private lending could help inform policymakers about the costs and benefits of either broadening or tightening various forms of aid to affected regions. We also need to develop a better understanding of flood insurance purchasing behavior. This could help answer whether low take-up rates of flood insurance are driven chiefly by financial factors (e.g., premiums being too high) or by behavioral factors (e.g., flood risk not being well understood by the public).
1 See this January 2018 Federal Emergency Management Agency (FEMA) blog post, and this May 2018 National Hurricane Center report. Details on hurricane categories 1–5 are available online.
2 The information in this paragraph is from a January 2018 National Hurricane Center report and a May 2019 Geophysical Fluid Dynamics Laboratory report.
3 Justin Gallagher and Daniel Hartley, 2017, “Household finance after a natural disaster: The case of Hurricane Katrina,” American Economic Journal: Economic Policy, Vol. 9, No. 3, August, pp. 199–228. Crossref
4 Alejandro Drexler, Andrew Granato, and Richard J. Rosen, 2019, “Homeowners’ financial protection against natural disasters,” Chicago Fed Letter, Federal Reserve Bank of Chicago, No. 409. Crossref
5 The 41 counties within the presidential disaster declaration zone eligible for individual assistance are listed on FEMA’s webpage regarding Harvey.
6 We identify the census block where each consumer in our sample resided at the end of the quarter preceding Harvey (2017:Q2) using the 2010 (and, in some cases, 2000) U.S. Census boundaries.
7 Census blocks are identified as flooded if their average flood depth is positive (i.e., at least one area of the block was flooded according to FEMA’s flood depth model). Blocks are identified as nonflooded if both the satellite imagery and hydrological model-based data sets show the block as not flooded. In cases where a block was detected as flooded via satellite but data on flood depth is missing, we drop the block from our analysis. Such areas account for just 2.3% of all consumers in our sample.
8 To get the average changes in auto loan balances, we take the difference between the 2017:Q4 and 2017:Q2 individual balances at the consumer level and then take the mean of these differences by flood depth group. We take the same approach to calculating the average (and median) changes in mortgage balances later on.
10 The information in this paragraph is from a December 2017 Texas Office of Consumer Credit Commissioner report and an August 2017 New York Times article.
11 Total mortgage balance refers to first mortgage loans, home equity installment loans, and home equity revolving loans. Also, see note 8 for details on how the average and median changes reported in this section are calculated.
12 We define a mortgage closure as a consumer who goes from having at least one mortgage account in the previous quarter to zero mortgage accounts in the current quarter.
14 The information in the first two sentences of this paragraph is from a Chase webpage and a RefiGuide.org article.
15 The information contained in this paragraph is from a September 2017 FEMA webpage; a November 2017 FEMA news release; a January 2018 Texas Department of Insurance report; and an August 2018 FEMA news release.
16 The information contained in this paragraph is from an August 2017 Washington Post article and FEMA statistics on significant flooding events, available online.


