

The Covid-19 pandemic has resulted in great economic and financial disruption. To better understand how financial hardships have varied across communities, we investigate credit card delinquencies across the states of the Federal Reserve’s Seventh District: Illinois, Indiana, Iowa, Michigan, and Wisconsin.1 While we find a slight increase of less than 1 percentage point in delinquency rates across the District overall following the onset of the pandemic, we find more pronounced increases of about 2 percentage points in low- and moderate-income (LMI) neighborhoods and about 3 percentage points in majority Black neighborhoods.
We focus on lower-income and majority Black neighborhoods because these neighborhoods have shown greater vulnerability to the employment and health effects of the pandemic.2 In the states of the Seventh District, 30.9% of census tracts had median incomes that were below 80% of the area median.3 These tracts are our LMI sample. In addition, 10.4% of census tracts had majority Black populations.
Credit cards are a common product across income levels and demographic groups, used to make essential household purchases and smooth out income shocks. About one-third of households in our District who say they have had difficulty paying expenses during the pandemic have relied on credit cards.4 Not making required credit card payments on time is a reflection of short-term financial hardship, and could negatively impact an individual’s credit score and overall financial health. Thus, if credit card delinquencies are on the rise, there would be both immediate and potentially longer-term consequences for households.
Our analysis draws on the primary sample of the Federal Reserve Bank of New York Consumer Credit Panel/Equifax (CCP) data. This data set is based on a 5% sample of all American citizens and permanent residents via a random selection of social security numbers. Thus, the data provide a representative depiction of individual debt holdings. We use these data to construct a quarterly panel of individuals in Illinois, Indiana, Iowa, Michigan, and Wisconsin from the first quarter of 2018 through the fourth quarter of 2020, including information on credit card balances, delinquency rates,5 and the census tract of borrowers, among other variables. We merge the data with census tract demographic and income characteristics using the U.S. Census Bureau’s 2014–18 five-year American Community Survey (ACS).6 We also include in the analysis the LMI status of a tract, as reported for the year 2020 by the Federal Financial Institutions Examination Council (FFIEC) and calculated from the 2014–18 five-year ACS. Finally, for robustness purposes, we calculate unemployment estimates at the census tract level using a combination of 2014–18 ACS demographic and occupational data and month-by-month public microdata from the Current Population Survey.7
Bankcards are the most widely held type of debt in the CCP data set, which also includes mortgages, home equity loans, student loans, auto debt, and other retail credit products. In 2020:Q4, 77.2% of individuals had an open credit card account, including 68.5% of individuals living in LMI neighborhoods, and 79.7% of those living in middle- and upper-income neighborhoods. The average monthly credit card balance in 2020:Q4 was $4,297. On average in the states of the Seventh District, card balances fell during the first two quarters of 2020 before rising in the second half of the year (see figure 1).
1. Average bankcard balances
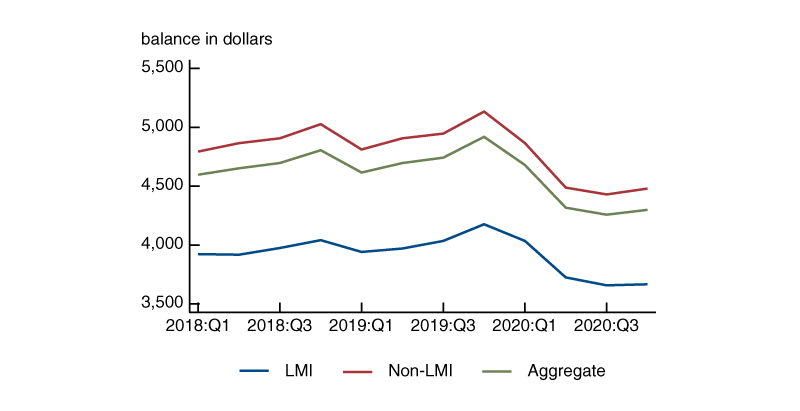
Sources: Authors’ calculations based on data from the Federal Reserve Bank of New York Consumer Credit Panel/Equifax (CCP) data and the American Community Survey 2014–18 five-year averages.
A review of credit card delinquency rates and balance information in recent quarters leads us to four key observations. First, the average credit card account balance has fallen for borrowers in LMI and non-LMI census tracts since the onset of the pandemic by about $326 and $238, respectively. Second, delinquency rates consistently run higher for cardholders in LMI neighborhoods than for those in middle- and upper-income neighborhoods and for cardholders living in majority Black neighborhoods relative to other neighborhoods. In 2018 and 2019, the average 90-plus day past-due rate was 12.9% for individuals in LMI neighborhoods versus 5.5% for individuals living in middle- to upper-income census tracts; and it was 19.2% in majority Black neighborhoods versus 6.4% in all other neighborhoods. Third, the reaction of the overall delinquency rate to the pandemic appears to be small. Overall delinquency averaged about 7.2% in 2018 and 2019. In the first quarter of 2020, the delinquency rate rose slightly, then declined in the subsequent three quarters. Fourth, as we describe in greater detail below, the reaction of the delinquency rate to the pandemic is more pronounced in LMI and majority Black neighborhoods. Other studies have found no increase in credit card delinquency rates during the pandemic, based on a different measure of delinquency that considers the share of accounts transitioning from current to noncurrent.8 Our article contributes to this literature by extending the analysis horizon through the fourth quarter of 2020 and considering alternative measures of delinquency.
Quantifying the delinquency change in LMI and majority Black neighborhoods
In order to more closely examine the effects of the pandemic on credit card holders in LMI and majority Black neighborhoods of the Seventh District, we conduct a difference-in-difference analysis.9 For this analysis, we consider the pandemic effect to begin in the first quarter of 2020 (which reflects delinquencies reported as of March 31, 2020) with a pre-pandemic period of 2018:Q1–2019:Q4 and a post-pandemic period of 2020:Q1–2020:Q4.10 In one model, we compare borrowers in LMI neighborhoods with those in non-LMI neighborhoods before and after the onset of the pandemic. In a second model, we compare borrowers in majority Black neighborhoods to those in non-majority Black neighborhoods before and after the onset of the pandemic. Based on this analysis, we see differences in the pre- and post-pandemic delinquencies in LMI versus non-LMI neighborhoods, as well as in majority Black versus non-majority Black neighborhoods.11 For the difference-in-difference estimate that examines LMI neighborhoods, we see an increase in the delinquency rate of about 0.7 percentage points across all neighborhoods after the pandemic, and an additional increase of about 1.2 percentage points (for a total increase of approximately 1.8 percentage points) that is specific to LMI neighborhoods. For the model examining majority Black neighborhoods, we see an increase in delinquencies of about 0.8 percentage points for all neighborhoods, and an additional increase of about 2.1 percentage points (for a total increase of 2.9 percentage points) that is specific to majority Black neighborhoods.12
Furthermore, we run a version of the difference-in-difference analysis including a control variable that estimates the unemployment rate at the census tract level. In this estimate, we use the Current Population Survey’s statewide unemployment rates for each combined occupation, gender, and ethno-racial group to which a worker might belong, and calculate what the unemployment rate would be in a census tract if those respective rates held true for each category of worker in that tract. We also run a version of the analysis including control variables for the share of workers employed in heavily affected industries, such as arts, entertainment, and recreation, and accommodation and food services, in each census tract. While these are imperfect estimates of potential exposure to the unemployment effects of the pandemic, we find that the LMI, majority Black, and pandemic effects remain robust with the additional control variables included in these models.
Figure 2 illustrates how credit card delinquency rates changed in the quarters preceding and following the onset of the pandemic. For borrowers in LMI neighborhoods, the average pre-pandemic delinquency rate was 12.9%, and the post-pandemic rate was 14.7%, an increase of approximately 1.8 percentage points. For borrowers in majority Black neighborhoods, the delinquency rate increased from 19.2% to 22.0%, an increase of 2.8 percentage points. The increase in delinquency rates for cardholders in LMI areas and for cardholders in majority Black neighborhoods occurred during the first quarter of 2020—which includes the month of March when the pandemic first took hold. Since March 2020, the delinquency rate has declined each quarter.
2. Individuals with bankcard delinquency by census tract characteristics
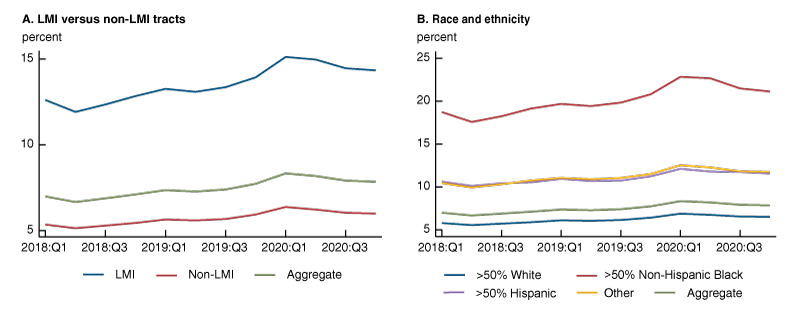
Sources: Authors’ calculations based on data from the Federal Reserve Bank of New York Consumer Credit Panel/Equifax (CCP) data and the American Community Survey 2014–18 five-year averages.
Analysis of geographic and neighborhood characteristics in places with larger delinquency increases
The average increases in delinquency for LMI neighborhoods and majority Black neighborhoods as measured in our difference-in-difference models are about 2 to 3 percentage points relative to a pre-pandemic base of 13% in LMI neighborhoods and 19% in majority Black neighborhoods. We also find that a small share of neighborhoods have experienced even larger average increases in the post-pandemic period. To describe this variation, we categorize neighborhoods based on their change in delinquency rate after the pandemic and examine differences in neighborhood characteristics across the groups. We find evidence of important differences between tracts that have a relatively large increase in bankcard delinquency and those that do not.
Figure 3 shows selected characteristics of neighborhoods categorized into four groups based on their change in delinquency rate: those with a decrease in delinquency, an increase of 0–2.5 percentage points, an increase of 2.5–5 percentage points, and an increase of more than 5 percentage points. Notably, the tracts with an increase in delinquency of 5 percentage points or more have a larger share of Black households and greater economic challenges. These tracts have lower educational attainment, a higher poverty rate, and higher receipt of TANF (Temporary Assistance for Needy Families Program) and SNAP (Supplemental Nutritional Assistance Program) benefits. They also had higher unemployment and lower labor force participation prior to the pandemic.
3. Change in credit card delinquency of census tracts, pre-pandemic versus post-pandemic
|
(percent, unless indicated otherwise) |
>5% |
2.5%–5% |
0%–2.5% |
<0% |
All |
|
Non-Hispanic White |
45.9 |
68.3 |
78.9 |
77.3 |
75.4 |
|
Non-Hispanic Black |
38.1 |
15.1 |
6.6 |
8.2 |
9.8 |
|
Percent Hispanic |
11.3 |
10.8 |
8.2 |
8.4 |
8.7 |
|
Median household income ($) |
39,505 |
53,584 |
70,083 |
69,380 |
66,203 |
|
Tracts that are LMI |
70.8 |
35.9 |
15.6 |
19.3 |
22.2 |
|
Bachelor’s degree or higher |
16.0 |
24.0 |
33.1 |
33.2 |
31.1 |
|
Poverty rate |
26.3 |
15.7 |
10.4 |
11.5 |
12.3 |
|
Receiving TANF or SNAP |
28.1 |
16.2 |
10.0 |
11.2 |
12.1 |
|
2014–18 unemployment rate |
6.6 |
4.3 |
3.1 |
3.3 |
3.5 |
|
2014–18 labor force participation rate |
59.5 |
63.4 |
65.8 |
65.3 |
65.0 |
|
Credit card delinquency rate in 2019:Q4 |
17.5 |
10.4 |
6.7 |
6.7 |
7.7 |
|
Credit card delinquency rate in 2020:Q4 |
21.2 |
11.9 |
7.0 |
5.6 |
7.8 |
|
Change in credit card delinquency, 2019:Q4–2020:Q4 |
7.6 |
3.5 |
1.1 |
–1.2 |
0.9 |
|
Number of census tracts in sample |
801 |
1,407 |
4,054 |
3,339 |
9,601 |
|
Number of CCP primary sample adults |
65,281 |
174,062 |
636,112 |
462,219 |
1,337,674 |
Sources: Authors’ calculations based on data from the Federal Reserve Bank of New York Consumer Credit Panel/Equifax (CCP) data and the American Community Survey 2014–18 five-year averages.
While individuals living in LMI census tracts experienced higher bankcard delinquency by about 2 percentage points on average, some areas have been seeing a larger increase. Across the Seventh District, about 14.7% of tracts experienced an increase of 2.5–5 percentage points, and about 8.3% of tracts experienced an increase of more than 5 percentage points. The share of tracts with the largest delinquency increase was greatest in Michigan and Indiana and smallest in Wisconsin and Iowa (see figure 4).
4. Share of census tracts by change in credit card delinquency, pre-pandemic versus post-pandemic
|
State |
>5% |
2.5% |
0%–2.5% |
<0% |
|
All |
8.3 |
14.7 |
42.2 |
34.8 |
|
Illinois |
8.7 |
15.7 |
42.4 |
33.2 |
|
Michigan |
10.7 |
15.0 |
39.3 |
35.0 |
|
Wisconsin |
2.9 |
8.7 |
45.2 |
43.2 |
|
Indiana |
10.2 |
17.5 |
41.7 |
30.7 |
|
Iowa |
5.1 |
14.7 |
47.1 |
33.1 |
Source: Authors’ calculations based on data from the Federal Reserve Bank of New York Consumer Credit Panel/Equifax (CCP) data.
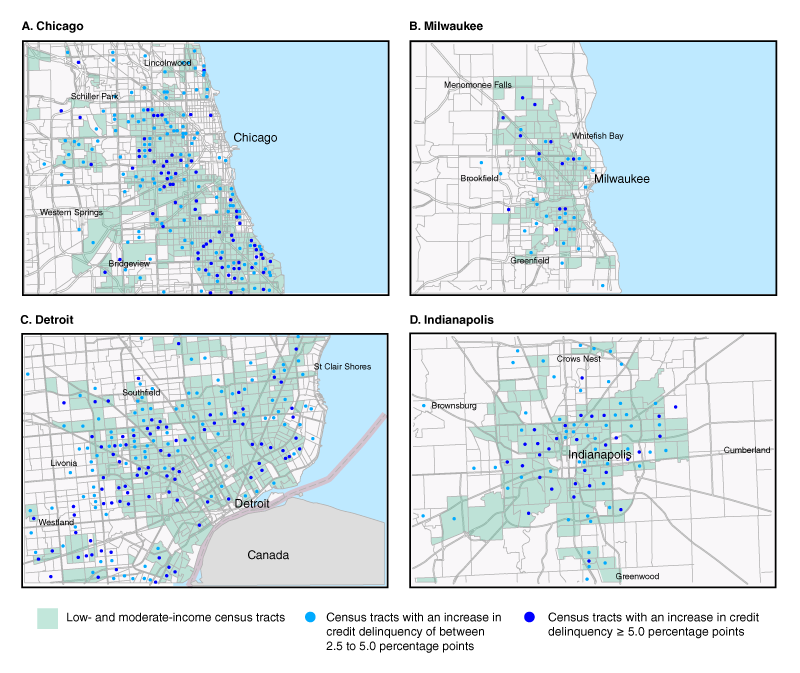
Taking a closer look at major urban areas in the District, shown in figure 5, there is a clear relationship between census tracts that are LMI (those shaded in green) and census tracts with a 5 percentage point or greater increase in delinquency following the onset of the pandemic (those marked with a darker blue circle). For example, in Wayne County, Michigan, while 49% of all census tracts are LMI, 82% of census tracts with large increases (5 percentage points or more) in delinquency are LMI, which reflects the concentration of increasing delinquency in LMI places. The pattern is equally striking for majority Black census tracts, which are 40% of all census tracts in Wayne County and 81% of all census tracts with large delinquency increases. A similar pattern holds for all four counties shown in figure 5.
5. Change in neighborhood credit card delinquency rates and LMI census tracts
Conclusion
In the context of stimulus payments, the CARES Act, and a decline in outstanding credit card debt, we detect modestly higher growth in credit card delinquencies for individuals in LMI and majority Black neighborhoods relative to comparison groups, even when we control for group-specific changes in the unemployment rate during the pandemic. The increase in delinquency occurred entirely in the first quarter of the pandemic and has gradually declined in each subsequent quarter, with delinquency rates drawing closer to pre-pandemic levels. Still, between 5% and 10% of census tracts, depending on the state, have average delinquency rates at least 5 percentage points higher during the post-pandemic period than they were before the pandemic. Further, we see a clear relationship between census tracts with a large increase in credit card delinquency and the income and demographic characteristics of those tracts. These findings highlight disparities in the immediate impact that the pandemic and closures took on the financial health of households in LMI and majority Black communities. A larger increase in delinquencies in LMI and majority Black zip codes informs potential policy and community development interventions to support the people and places most in need.
Notes
1 In the CCP data we use for our analysis, credit cards are labeled “bankcards.” This category consists of lines of revolving credit issued through a bank or credit union, which are typically unsecured and associated with a card that can be used with one of the major credit card networks.
2 Taz George, Robin Newberger, and Mark O’Dell, 2019, “The geography of subprime credit,” ProfitWise News and Views, Federal Reserve Bank of Chicago, No. 6, available online.
3 We specifically use the LMI identification provided in the 2020 Census files compiled by the Federal Financial Institutions Examination Council (FFIEC), available online.
4 U.S. Census Bureau, 2020, Week 17 Household Pulse Survey: October 14–26, Washington, DC, November 4, available online.
5 We calculate the delinquency rate as the percentage of cardholders with at least one delinquent 90-plus days (card) account.
6 More information is available online.
7 IPUMS-CPS, University of Minnesota, available online.
8 See Ryan Sandler and Judith Ricks, 2020, “The early effects of the COVID-19 pandemic on consumer credit,” Consumer Financial Protection Bureau, Office of Research, special issue brief, August, available online; Federal Reserve Bank of New York, Center for Microeconomic Data, Research and Statistics Group, 2021, “Quarterly report on household debt and credit: 2020:Q4,” February, available online; and Kim Eng Ky and Ben Horowitz, available online.
9 We discuss the general results here. Detailed results are available in the online appendix to this article, available online.
10 The results of the analysis are robust to setting the pandemic effect to begin in the second quarter of 2020 rather than the first quarter and to beginning the time series in either the first quarter of 2019 or the first quarter of 2018. The results are also robust to using 60-day delinquency rather than 90-day delinquency.
11 The race categories in figure 2 are mutually exclusive and exhaustive, and apply to neighborhoods rather than individuals. We consider it worth categorizing census tracts in this manner to get a sense of group representation in each tract, allowing us to see which groups are harder hit by the onset of the pandemic.
12 We also run a similar model examining majority Hispanic neighborhoods and find no statistically significant increase in delinquency specific to these neighborhoods following the onset of the pandemic.


