

Globalization, particularly through international trade in goods, has helped to foster the creation of tremendous amounts of wealth and prosperity across much of the globe while lifting sizable portions of the world’s population out of poverty. In particular, the latter half of the twentieth century delivered unprecedented rates of increased economic integration among many countries. Access to global markets supported the industrialization of emerging economies and opened up new markets for firms in wealthier countries. As a result of the expansion of international trade and competition, consumers in rich and poor countries alike gained in terms of greater purchasing power, better-quality products, and more product varieties.
Global trade relative to gross domestic product (GDP)—measured by imports plus exports as a share of final global expenditures—is a widely used measure of the openness of trade borders that is tracked closely by economic researchers and policymakers. In 1970, the volume of international trade as a percentage of final global expenditures was 19% (see figure 1, panel A). This means that every $100 spent on final purchases by households, firms, and governments was associated with $19 in international trade flows. The trade-to-GDP ratio shot up over the next four decades, peaking at 55% in 2008 just prior to the global recession. During the recession, the openness indicator dropped to 45% and subsequently remained nearly constant through 2015 at about 48%.
1. Openness and structural change
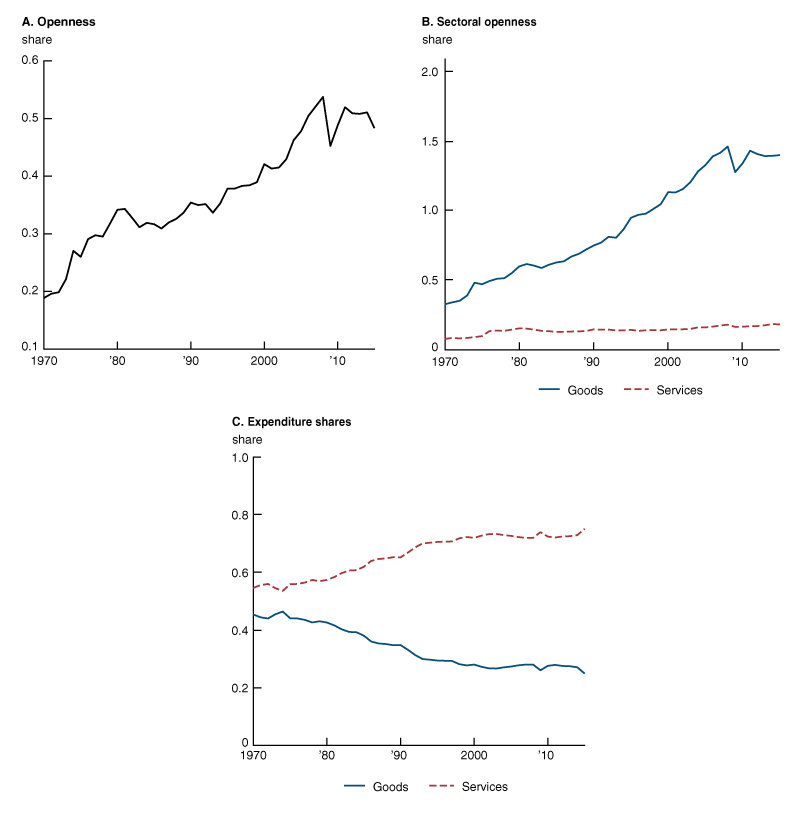
Source: Logan T. Lewis, Ryan Monarch, Michael Sposi, and Jing Zhang, forthcoming, “Structural change and global trade,” Journal of the European Economic Association.
What factors have contributed to the expansion of trade since 1970?
Contributions to growing international trade volumes came from multiple rounds of trade negotiations under the General Agreements for Tariffs and Trade (GATT) and the World Trade Organization (WTO). These negotiations led to substantial reductions in tariffs, quotas, and other trade barriers in goods and, to a lesser degree, in services. Also, standardization of shipping containers (a process that began to accelerate in the 1960s) significantly reduced transportation costs and spurred trade in goods.1 Moreover, the rise in vertical specialization—the splitting up of production stages across country borders to take advantage of production efficiencies—contributed to the increase in trade relative to GDP.2 Large regions of the world industrialized and joined the global trading system: the Asian Tigers (Hong Kong, Singapore, South Korea, and Taiwan) in the 1970s and 1980s, Eastern Europe in the 1990s following the collapse of the Soviet Union, and China in the early 2000s following its entry into the WTO.
The trend toward greater global openness appears to have stalled between 2011 and 2015. The slowdown in the growth of global trade that began in the wake of the 2008 global recession has raised questions about whether countries have been shifting toward more protectionist trade policies. (Protectionist policies restrict imports through tariffs, quotas, other trade barriers, and government regulations with the rationale often being protection of domestic industries and/or government revenue generation.) These protectionist policies would have the effect of limiting the scope for global trade-induced creation of wealth in the years to come. But before reaching a conclusion on the direction of protectionism, it is important to take a closer look at trade openness and see what other factors may be driving the slowdown.
Goods versus services expenditures and trade
Much of the spectacular rise in trade openness beginning in the 1970s was driven by increased openness in goods (tangible merchandise, including commodities such as wheat or oil, and manufactured products for either final consumption or as intermediate inputs). By contrast, services (intangible items, such as business services and health care) have had a significantly smaller increase in trade openness over the past four decades. International trade in goods as a share of final expenditures on goods rose from 33% in 1970 to 140% in 2015 (see figure 1, panel B); this goods share can exceed 100% because inputs can cross international borders many times before reaching the final consumer. The ratio of services trade to services expenditures and the growth therein were muted in comparison, rising from only 8% in 1970 to 18% in 2015.
Between 1970 and 2015, global economic activity underwent a structural change away from goods-producing activities into services-producing activities. Final global expenditures on services accounted for 58% of total expenditures in 1970, rising to 79% by 2015 (see figure 1, panel C). By contrast, final global expenditures on goods accounted for 42% of total expenditures in 1970 and trended downward to 21% by 2015. This change is particularly relevant because, as discussed earlier, services are traded substantially less than goods.
The structural change away from trade-intensive goods production into less-traded services production was driven largely by two forces. First, consumers increasingly allocated a greater share of expenditures toward nonessential services as their incomes grew.3 Consider a simple example: A consumer with little disposable income may prepare a meal at home so that expenditures go to pay for food. Conversely, a consumer with a higher level of income may dine out so that expenditures go to food plus the services provided by the chef and waitstaff. The additional service component implies a larger services share in expenditures as income grows. Second, prices of goods declined relative to services, resulting in services expenditures accounting for a larger share of total expenditures by both households and firms given that goods and services are complementary. This latter phenomenon occurred because 1) productivity advances, such as automation, were greater in goods than in services, leading to faster declines in the cost of producing goods, and 2) trade costs rapidly declined in the goods sector.
Not surprisingly, international trade volumes were affected by the structural change as final purchases veered more toward less-traded services. The question is: By how much did the structural change away from goods-producing activities into services impede the growth in trade openness? A recent research paper by Lewis et al.4 provides an answer: Structural change had dampened the change in global trade openness by 15 percentage points by 2015, which is about one-half of the observed increase in global trade openness from 1970 to 2015.
Analytics and model
The authors explain that openness of trade borders is shaped by sectoral trade openness and sector expenditure shares (see equation 1). Specifically, total trade as a fraction of final global expenditures is shaped by the importance of trade in goods and services relative to final global expenditures and expenditures in goods and services relative to final global expenditures, as follows:
\[1)\frac{Trad{{e}_{t}}}{Ex{{p}_{t}}}\,\,=\,\,\frac{Trad{{e}_{gt}}}{Ex{{p}_{gt}}}\,\,\times \,\,\frac{Ex{{p}_{gt}}}{Ex{{p}_{t}}}\,\,+\,\,\frac{Trad{{e}_{st}}}{Ex{{p}_{st}}}\,\,\times \,\,\frac{Ex{{p}_{st}}}{Ex{{p}_{t}}}\,,\] where $\frac{Trad{{e}_{t}}}{Ex{{p}_{t}}}$ is total trade (imports plus exports) as a share of final global expenditures or “openness” in a given time t, $\frac{Trad{{e}_{gt}}}{Ex{{p}_{gt}}}\,\,\times \,\,\frac{Ex{{p}_{gt}}}{Ex{{p}_{t}}}$ is the share of goods trade in total goods expenditures weighted by the importance of goods expenditures in final global expenditures, and $\frac{Trad{{e}_{st}}}{Ex{{p}_{st}}}\,\,\times \,\,\frac{Ex{{p}_{st}}}{Ex{{p}_{t}}}$ is the share of services trade in total services expenditures weighted by the importance of services expenditures in final global expenditures.
To advance the understanding of these interrelationships, Lewis et al. use a general equilibrium model to capture how shifts in consumption preferences over time affected trade. Their model is multi-country (26 countries and the “rest of the world”), uses two sectors (goods and services), and covers the period 1970–2015.5 Their approach incorporates the notion that countries have differences in efficiency in the production of various goods and services, as well as differences in trade costs, which together determine countries’ comparative advantages in trade.
The researchers use their model to conduct counterfactuals by holding expenditure shares of goods and services at their 1970 levels in order to identify the impact that structural change has had on openness. They also conduct counterfactuals on the impact of holding trade costs fixed (shipping costs and tariffs) at 1970 levels to understand the impact these barriers have had on openness. Moreover, they estimate future openness based on their assumptions of global trends in structural change and trade costs.
Research findings
Lewis et al. find that in the absence of persistent structural change since 1970, global trade as a share of final global expenditures would have reached 64% by 2015; this compares to the much lower actual trade-to-expenditure ratio of 48% (see figure 2). In other words, global openness would have been one-third higher by 2015 without the structural change toward greater services expenditures. The gap between the counterfactuals (represented by the dashed line in figure 2) and the actual data (solid line) widened especially in the 1990s and the early 2000s. This points to structural change having the greatest drag on openness during this period. Also, the authors compare the impact that structural change had on reducing global trade to the impact that declining trade costs had on increasing trade. They found that structural change held back trade by roughly half the magnitude that reductions in trade costs had boosted trade over the past four decades.6
2. Openness: Data and counterfactual
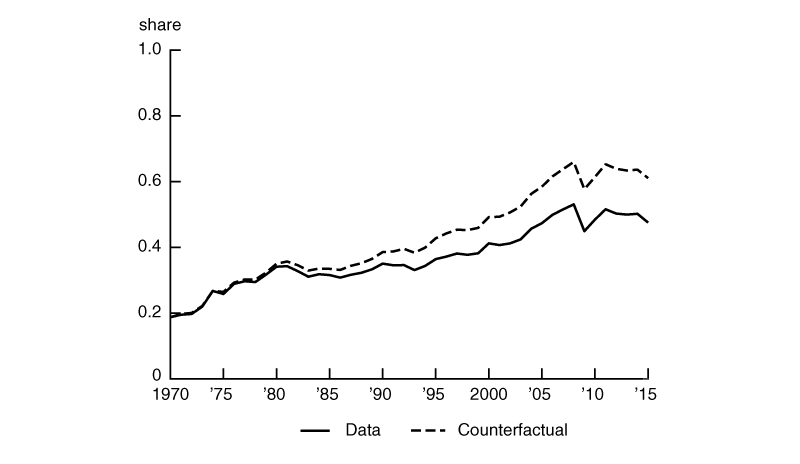
Source: Logan T. Lewis, Ryan Monarch, Michael Sposi, and Jing Zhang, forthcoming, “Structural change and global trade,” Journal of the European Economic Association.
For each of the 26 countries examined, openness based on counterfactuals (with expenditure shares fixed at 1970 levels) was higher than the actual data. This indicates that structural change affected trade in all 26 countries. For some countries (e.g., Sweden, Greece, and Mexico), the counterfactual level of openness was not much greater than the actual data because these countries experienced less structural change away from goods and toward services. By contrast, in countries that had a higher growth in their services expenditure share (e.g., Belgium-Luxembourg, Japan, and India), counterfactual levels of openness were much greater than the openness measure based on actual data.
Lewis et al. expect structural change to continue in the future as a result of further technical progress and income growth. In the absence of any large reductions in trade costs over time, the authors show that future global openness is likely to decline from 48% in 2015 to 40% by 2060 purely as a result of continued structural change (see the black dotted line in figure 3). The authors also put forth an alternative scenario to show what would happen if trade costs continued to fall. Specifically, assuming a continued 1.5% decline in trade costs per year would provide a substantial boost to trade and openness (see the blue dotted and the red dashed lines representing trade openness with reductions of trade costs in goods and services, respectively, in figure 3). While declining trade costs boost openness in either sector, openness boosted by trade-cost reductions in services would eventually overtake openness boosted by trade-cost reductions in goods because of the shift in expenditures toward services over time.
3. Projection of trade openness

Source: Logan T. Lewis, Ryan Monarch, Michael Sposi, and Jing Zhang, forthcoming, “Structural change and global trade,” Journal of the European Economic Association.
Interpretations and relevance for future trade policy
The paper’s findings imply two important takeaways. The first concerns how to interpret the sharp slowdown in global trade following the 2008 global recession. One important contributing factor is that declining trade costs have historically boosted global trade volumes, yet developed countries have already reduced barriers to trade in goods to historically low levels and are running out of capacity to reduce them further. Another central factor is that structural change from goods to services continues to be a drag on trade growth (although this drag has not been stronger since the global financial crisis of 2008). The authors explain that, in light of these two underlying contributing factors, the slowdown in trade growth since 2008 does not necessarily reflect heightened trade protectionist measures.
The second takeaway concerns trade policy implications. In order for openness to increase, or even remain constant, trade growth needs to accelerate not only to offset but to overcome the forces arising from structural change. Since there are limits to further trade liberalization in goods sectors, modern trade policy will aim (and is aiming already) to bring down trade costs in services by negotiating on aspects such as intellectual property rights, international common law, and e-commerce. Global consumers stand to benefit tremendously from these policies as global competition can drastically reduce prices and increase the quality of services. Consumers in higher income countries will benefit the most because services constitute a very large share of their final expenditures. By contrast, developing countries stand to benefit more from further liberalization of goods trade because goods constitute a high proportion of their final expenditures.
Conclusion
In summary, while global trade as a fraction of GDP may have peaked, trade in goods and services will continue to provide a substantial source of economic growth and welfare gains for both developed and developing countries in the years ahead. The research by Lewis et al. highlights the importance of structural change in influencing global openness, a factor that has been little studied in the literature thus far. The authors provide the important finding that the reduction in openness that has occurred since the global recession of 2008 can be attributed in part to ongoing structural change and the difficulty in reducing trade costs of goods further. Given their finding, the leveling off of global openness seen in the data does not necessarily point to increased trade protectionism.
Notes
1 Further details on the importance of standardization of shipping containers for global trade can be found in Tim Harford, 2017, “The simple steel box that transformed global trade,” BBC News, January 9, available online.
2 An analysis of vertical specialization and trade can be found in Kei-Mu Yi, 2003, “Can vertical specialization explain the growth of world trade?,” Journal of Political Economy, Vol. 111, No. 1, February, pp. 52–102. Crossref
3 Compared to goods, services have a higher income elasticity, which generates a positive correlation between income and the services expenditure share.
4 Logan T. Lewis, Ryan Monarch, Michael Sposi, and Jing Zhang, forthcoming, “Structural change and global trade,” Journal of the European Economic Association. Also, Logan T. Lewis, Ryan Monarch, Michael Sposi, and Jing Zhang, 2020, “Structural change and global trade,” Federal Reserve Bank of Chicago, working paper, No. 2020-25. Crossref
5 The authors combine data mainly from the following sources: the World Input–Output Database (WIOD), the International Monetary Fund’s Direction of Trade Statistics (DOTS) database, the World Bank’s World Development Indicators (WDI), and the United Nations’ National Accounts Main Aggregates Database.
6 The authors find that declining trade costs since 1970 added 27 percentage points to the ratio of trade to expenditure by 2015.


