

The fraction of Americans switching their jobs has been increasing at a fast pace in the past 18 months, reaching its highest level on record. According to the U.S. Department of Labor, more than 4.5 million people voluntarily left their jobs in November 2021—the largest figure in the past two decades. This period has been dubbed the Great Resignation. At the same time, wages and salaries have accelerated considerably and by the end of 2021, inflation had hit its highest level since 1982.
Research has established a strong and positive relationship between the share of employed workers quitting their jobs (quit rate) and the rate of wage and price inflation.1 Periods of time when the quit rate increases often predate periods of higher inflation. This positive relationship between quit rate and inflation may be surprising at first, because we might expect that a higher propensity of employed workers to search for new jobs would expand the supply of labor, lowering labor costs.
However, recent research has shown that competition among employers to hire or retain workers may explain the positive relationship between job-to-job mobility and inflation.2 The idea is as follows: By applying for jobs in a different firm, employed workers can elicit wage competition between the current employer and the new candidate employer. The firm that intends to poach the worker from their current employer has to offer a sufficiently large wage to make the offer attractive. And if a worker is particularly valued by their own employer, they may be offered a pay raise that is necessary to retain them in their current job. In this context, if employed workers search more, wage competition among employers increases, leading to an increase in inflationary pressures; if they search less, wage competition falls and inflationary pressures decrease.
In this Chicago Fed Letter, we construct a new, and more comprehensive, measure of labor market slack (following recent work in Faccini and Melosi, 2021) that takes into account the effects of on-the-job search (search by employed workers) on wage competition and inflation in addition to the role of unemployment. By labor market slack, we mean an indicator of the inflationary pressures coming from the labor market. Using this novel measure of labor market slack, we find that the recent brisk surge in the propensity to search on the job has contributed to raising inflation by around 1 percentage point during most of 2021.
The new measure of labor market slack
The labor market has always played a central role in theories of wage and price inflation. However, the emphasis has typically been on the role played by the unemployment rate. The idea that the unemployment rate is related to wages is one that goes back at least to the 1950s. The rationale is that the unemployment rate measures the scarcity of labor, and thus should be inversely related to its price, i.e., the wage. However, the traditional type of economic analysis in this area (based on the Phillips curve) ignores the role of employed workers altogether and, thereby, the role of the Great Resignation in explaining the recent surge in wages and prices.
Our new measure of slack depends on three factors: the unemployment rate, the share of employed workers looking for jobs, and the degree of labor market misallocation. We can explain the role played by each of these three components in determining labor market slack as follows. Those workers who are unemployed represent a cheap pool of labor because they do not have a salary to anchor their wage negotiations. As a result, their bargaining power is low. Hence, an increase in unemployment entails an increase in labor market slack.
On the other hand, slack falls when the share of employed workers looking for jobs rises, i.e., the labor market becomes tighter when more of the employed look for jobs. Intuitively, by obtaining an offer from another firm, workers can get a salary raise, either from their current employer through negotiation or from a new employer. Hence, a higher rate of on-the-job search increases negotiated wages. And to the extent that this increase in wages is not fully met by an increase in productivity, wage inflation will also generate price inflation.
The extent to which an increase in the share of workers looking for jobs generates inflationary pressures also depends on the degree of labor misallocation, which is large when most workers are employed in jobs where they have low productivity (we’ll call these bad jobs) and fewer workers are employed in jobs where they have high productivity (we’ll call these good jobs). Indeed, workers employed in bad jobs are relatively cheap to hire since their bargaining power is relatively low. Clearly, a prospective employer needs to offer a higher wage to be able to successfully poach a worker employed in a good job relative to the case where the same worker is employed in a bad job. Hence, workers employed in bad jobs represent a relatively cheap source of labor and, thus, labor market slack tends to increase as the share of mismatched workers rises.
According to recent research, this novel and more comprehensive concept of labor market slack can be estimated using aggregate labor market flows (see box 1)—namely, the unemployment-to-employment rate (UE) and the employment-to-employment rate (EE). The UE rate is the ratio of the unemployed workers who find a job in a given period of time relative to the total stock of unemployed workers; the EE rate is the ratio of the workers who change their employer to the total number of employed people.
Box 1. Estimating labor market slack using labor market flows
Assuming that the UE rate proxies for the arrival rate of job opportunities both for the unemployed and the employed job seekers, we can show that the ratio of the EE flow rate to the UE flow rate is defined as follows:
\[\frac{E{{E}_{t}}}{U{{E}_{t}}}={{S}_{t}}\times P\left( {{M}_{t}} \right),\]
where St denotes the share of employed workers who are searching for a new job (in short, the on-the-job search rate) and P (Mt) stands for the probability that employed workers switch their jobs conditional on receiving an offer. This probability depends on the degree of labor misallocation (Mt) because if more workers are employed in bad jobs, external job offers are more likely to be accepted, all else being equal. As we show, the Great Resignation is a period of time when the extraordinarily rapid growth in job-switching (EE flows) cannot be accounted for by the dynamics of the arrival rate (proxied by UE flows) or a deterioration in the quality of jobs ( Mt) alone. Rather, it is a time when the rising propensity of employed workers to search on the job (St) drives the increasing wedge between EE and UE rates.
We estimate the rate of on-the-job search from the joint behavior of UE and EE flow rates. Given some assumptions on the initial share of good and bad jobs, and on the chances of finding good jobs, we can estimate the implicit evolution of the share of bad jobs in the economy, which allows us to quantify the probability that employed workers switch jobs, conditional on receiving an offer.3
Research has shown that the rate of on-the-job search is found to increase in recessions and to fall during expansions. Interestingly, the on-the-job search rate hits its record low at the end of the previous decade, providing an explanation for the puzzling shallow wage growth and the puzzling low inflation rate observed throughout the latest decade. The on-the-job search rate constructed using the UE and EE flow rates in our model closely mimics the same rate constructed using the Survey of Consumer Expectations—a large survey data set administered by the Federal Reserve Bank of New York—in the available period from March 2014 through March 2020.
Job-to-job mobility during the pandemic
In this article, we apply this methodology to estimate labor market slack and its drivers over the pandemic recession and the ensuing recovery. Our objective is to quantify to what extent the heightened search efforts of the employed have contributed to reducing slack in the U.S. labor market since the onset of the pandemic. We then use the same model as in Faccini and Melosi (2021) to evaluate the implications for inflation.4
Panels A and B of figure 1 show the dynamics of the UE and EE rates we observe in the data. Panel C reports the implied rate of on-the-job search. At the onset of the pandemic, both the UE and the EE rates fell. However, the former dropped more dramatically than the latter, implying an increase in the rate of on-the-job search. In the summer of 2020, the rise in the UE rate was not backed by a commensurate rise in the EE rate, which stagnated around a relatively low value. These patterns imply a fall in the share of workers searching on the job in the summer of 2020.
1. The U.S. labor market during the pandemic
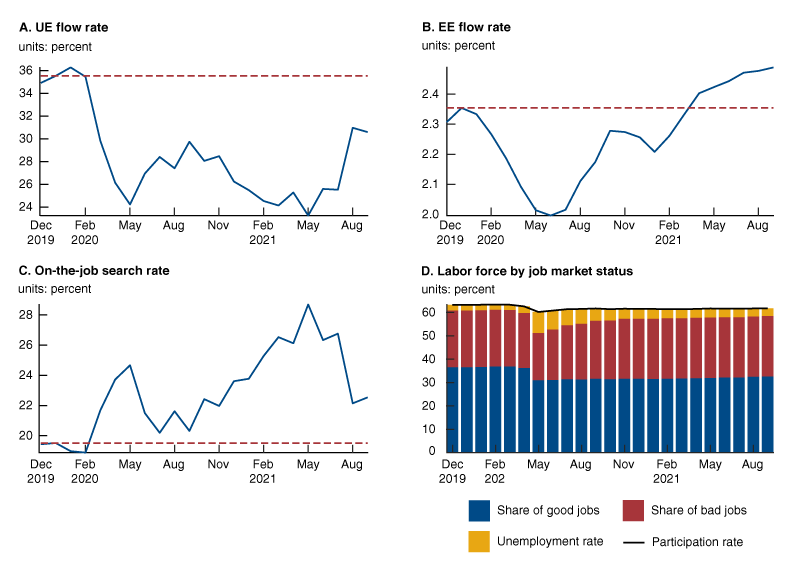
Sources: The UE flow rate is computed using U.S. Bureau of Labor Statistics (BLS) data. The EE flow rate is computed using labor market flows from the U.S. Census Bureau’s Current Population Survey. The series for the EE flow rate is corrected as suggested by Fujita, Moscarini, and Postel-Vinay (2021). The civilian unemployment rate and the participation rate are computed by the BLS.
The rapid growth in the EE rate from June 2020 through May 2021 is the phenomenon dubbed the Great Resignation. The rapidly growing job-to-job flow was accompanied by a declining UE rate, and the estimated share of employed job seekers rose sharply as a result. In the third quarter of 2021, the sharp rise in the UE rate combined with a deceleration of the EE rate leads to a fall in the estimated rate of on-the-job search, which nevertheless remains above its pre-pandemic levels—denoted by the horizontal red dashed line.
In panel D, we show the dynamics of the labor force decomposed by job market status. The black line denotes the labor force participation rate, which fell in 2020 and still had not recovered by the end of the sample. The observed unemployment rate—denoted by the yellow bars—increased at the onset of the pandemic and recovered fairly quickly in the subsequent months.
The blue and red bars denote workers employed in good and bad jobs, respectively, so the sum of the two reflects the total employment rate. The figure reveals that after an initial drop in employment, the bad jobs were relatively quick to recover, as many workers who became unemployed during the pandemic recession took a first step back onto the job ladder. While the stock of good jobs had not recovered by the end of the sample, it did not keep declining during the first phase of the recovery; in this respect its behavior has been different from the previous three recessions (as shown in Faccini and Melosi, 2021). What has sustained the creation of good jobs during the pandemic recovery has been the quick fall in unemployment and the rapid creation of bad matches, which in turn leads to the formation of better jobs as employed workers search for new opportunities and move up the job ladder.
The Great Resignation, labor market slack, and inflation
The unemployment rate, the share of bad jobs, and the rate of on-the-job search reported in figure 1 are the three inputs of the generalized measure of slack that is plotted by the blue line in panel A of figure 2. This blue line shows the estimated behavior of the novel measure of labor market slack in the pandemic period relative to its level estimated in February 2020—the month preceding the onset of the pandemic in the United States. The red line is the measure of labor market slack that would have occurred if the rate of on-the-job search had remained constant at its value of February 2020. Therefore, the vertical differences between the blue line and the red line isolate the effects of the changes in the rate of on-the-job search on labor market slack in every month.
2. Labor market slack and its inflationary consequences
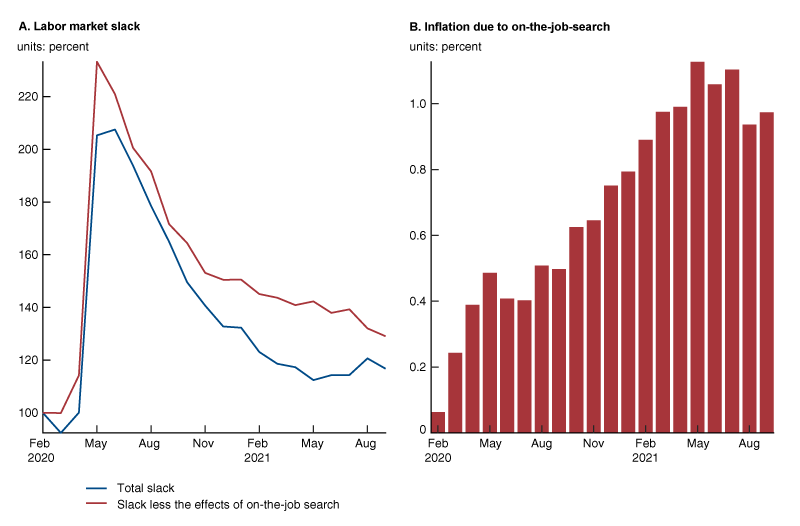
Source: Authors’ calculations based on UE and EE flow rates from the U.S. Bureau of Labor Statistics.
Slack increases with the pandemic recession, driven by the surge in the rate of unemployment. However, over the first months of the pandemic crisis, the fast-growing on-the-job search rate lowers the peak in labor market slack. Throughout 2021, the heightened job-to-job mobility—the Great Resignation—persistently contributes to reducing labor market slack.
To assess the implications of this diminished slack for inflation, we feed the calibrated model by Faccini and Melosi (2021) with the changes in the rate of on-the-job search estimated from March 2020 onward and look at the resulting changes in the inflation rate. The results of this exercise are shown in panel B of figure 2.5 According to our estimates, the Great Resignation increased the rate of inflation by up to 1.1 percentage points. Interestingly, the contribution to inflation built up from the onset of the pandemic crisis. This inflationary pressure plateaued at its peak of May 2021 and then declined slightly in September 2021. Of course, there is a lot of uncertainty about the magnitude of these inflationary effects, which are estimated using a theoretical model based on a number of simplifying assumptions about the functioning of the economy.
Implications for inflation in the longer run
Will these inflationary pressures driven by the heightened job-to-job mobility persist? It is impossible to answer this important question with confidence, given the high uncertainty about the drivers behind the recent labor market trends. We therefore limit ourselves to speculating about what factors could influence the persistence of these inflationary pressures.
Research suggests that in the past 30 years the on-the-job search rate has followed a clear countercyclical pattern. This pattern is likely to reflect compositional changes in the propensity of employed workers to search on the job, as well as the need of employed workers to respond to countercyclical income risk. These forces will lower the on-the-job search rate as the economic recovery matures. Similarly, a high on-the-job search rate and the resulting inflationary pressure may not persist if the Great Resignation turns out to be driven by short-run issues related to the ongoing pandemic, such as employees’ need for more flexibility to deal with the virus and childcare or their need to leave heavily impacted sectors for healthier industries with plenty of job openings (Aaronson, Lewers, and Sullivan, 2021).
However, to the extent that the Great Resignation reflects a more profound change in how workers value their bond to their jobs, the ongoing inflationary pressures might continue for a longer time. Persistent inflationary pressures may also arise from the increasing popularity of remote working, which can expand the range of job opportunities for employed workers beyond their geographic location.
Conclusion
By applying for jobs in a different firm, employed workers can spur wage competition between the current employer and prospective employers. As a result, labor becomes more expensive to retain or to hire, effectively corresponding to a tighter labor market from the perspective of employers. Using a theoretical model, we quantify to what extent the heightened search efforts of the employed have contributed to reducing slack in the U.S. labor market since the onset of the pandemic. We find that the tighter labor market during the pandemic gradually contributed to raising the rate of inflation. More research on the reasons behind the desire to change jobs among U.S. workers will be needed to determine how persistent these inflationary pressures are likely to be.
Notes
1 See Jason
Faberman and Alejandro Justiniano, 2015, “Job switching and wage growth,” Chicago Fed
Letter, Federal Reserve Bank of Chicago, No. 337, and Giuseppe Moscarini and Fabien Postel-Vinay,
2017, “The relative power of employment-to-
employment reallocation and unemployment exits in predicting wage growth,” American Economic Review, Vol. 107, No. 5, pp. 364–368, (subscription).
2 This mechanism is studied by the literature that studies New Keynesian models with on-the-job search (Giuseppe Moscarini and Fabien Postel-Vinay, 2019, “The job ladder: Inflation vs. reallocation,” Yale University and University College London, mimeo, October; Renato Faccini and Leonardo Melosi, 2021, “Bad jobs and low inflation,” Federal Reserve Bank of Chicago, working paper, No. WP-2020-09). These models rest on the sequential auction bargaining protocol introduced by Fabien Postel-Vinay and Jean-Marc Robin, 2002, “Equilibrium wage dispersion with worker and employer heterogeneity,” Econometrica, Vol. 70, No. 6, November, pp. 2295–2350. In this article, we follow Faccini and Melosi (2021) to estimate the share of workers searching on the job using aggregate unemployment-to-employment and employment-to-employment flow rates consistently with their model. In Moscarini and Postel-Vinay (2019), this share does not vary over time and thereby does not affect the dynamics of labor market slack.
3 The beginning of our sample is April 1990—far back enough to ensure that the assumption on the initial share of good and bad jobs is totally inconsequential for our findings. Following an approach that is standard in the literature (Moscarini and Postel-Vinay, 2019), the probability of finding a good match is calibrated by targeting a fraction of good jobs in the model steady state equal to 67%, which is the share of employment for the top 10% U.S. firms by employment size in the year 2000. More details about the calibration of the model are provided in Faccini and Melosi, 2021.
4 We compute the UE flow rate by applying the methodology introduced by Robert Shimer, 2005, “The cyclical behavior of equilibrium unemployment and vacancies,” American Economic Review, Vol. 95, No. 1, pp. 25–49, to labor market flow data provided by the U.S. Bureau of Labor Statistics (BLS). This rate cannot be computed for April 2020. So for that month, we assume that the rate is half what it was in the previous month. The EE rate is computed using the Current Population Survey (CPS) and making the correction advocated by Shigeru Fujita, Giuseppe Moscarini, and Fabien Postel-Vinay (2021), “Measuring employer-to-employer reallocation,” Federal Reserve Bank of Philadelphia, working paper, No 21-22. We extend the time series of the EE rate back to April 1990 by splicing it with the quit rate measured by Steven J. Davis, R. Jason Faberman, and John Haltiwanger, 2012, “Labor market flows in the cross section and over time,” Journal of Monetary Economics, Vol. 59, No. 1, pp. 1–18. The unemployment rate and the participation rate are the civilian unemployment rate and the participation rate released by the BLS.
5 By using the model, we take into account the dynamic effects associated with the heightened job-to-job mobility. For instance, an increase in the on-the-job search rate leads more workers to switch to good jobs, reducing labor misallocation and labor market slack.


