

Inflation remains high, and it is critical to understand the components of inflation. Inflation in core goods has declined over much of the past year. Inflation in housing services remains high, but the growth in rental rates of units available for rent has fallen in recent months. This suggests measured inflation in housing services, which includes rents on both occupied and vacant units, is likely to moderate over the coming year as rents on occupied units catch up to those of vacant units.1 That leaves core services excluding housing services, which accounts for more than half of core consumption expenditures. Inflation in this sector has remained elevated over the past year. Understanding why core inflation remains elevated and when it is likely to recede thus requires understanding what is happening in core non-housing services.2
Much analysis suggests that a tight labor market is contributing to inflationary pressures: Aggregate wage growth has been high; labor force participation for some groups of workers, especially older workers, is below pre-pandemic levels; and job vacancies are high relative to the size of the labor force. The sector in which concern about continued high inflation is greatest—services excluding housing—is relatively labor intensive, suggesting a tight labor market may be contributing to inflationary pressures in that sector.
This Chicago Fed Letter focuses specifically on wage growth and its potential for identifying inflationary pressures. We make two arguments, both of which are well known among economists but which we apply to services excluding housing. First, economic theory suggests that inflationary pressures depend on how nominal wage growth compares with productivity growth. We show that growth in unit labor costs in non-housing services—wage growth minus labor productivity growth—has indeed been higher in the past year than before the pandemic. This supports the idea that service providers may be facing pressure to raise their prices, given how their costs have risen.
Second, we revisit previous work on whether growth in unit labor costs helps to forecast future inflation. Several papers have now demonstrated that, at least in the aggregate, unit labor costs are not very helpful for forecasting inflation once we account for lagged inflation—certainly not as good as inflation is for forecasting growth in unit labor costs. We largely confirm these findings using up-to-date data for both the aggregate economy and non-housing services.
These results do not mean that labor costs are irrelevant for pricing decisions. Labor costs are clearly important for pricing, especially in labor-intensive sectors. One explanation for our finding that unit labor costs may not be especially helpful for forecasting inflation is that the wages firms pay their workers adjust more slowly than the prices firms charge for their goods and services. This tends to make unit labor costs a lagging indicator of inflation. Even when inflation depends on expectations of future unit labor costs, so that labor market tightness remains a source of inflationary pressures, lagged unit labor costs may not be a useful bellwether for future inflation given how price inflation may be reacting to future cost increases. Waiting until the growth in unit labor costs has subsided to determine that inflationary pressures have abated runs the risk of missing when inflationary pressures actually eased.
Nominal wage growth and changes in unit labor costs
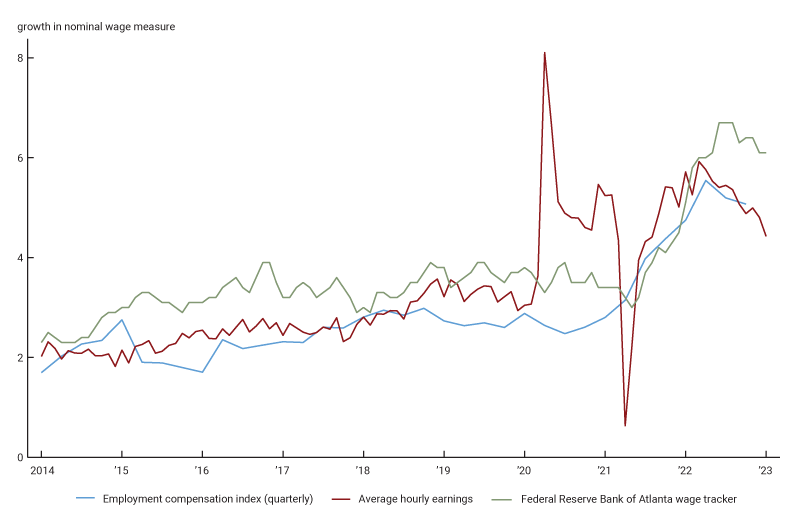
As has been well documented, worker compensation has increased rapidly in the past year. One illustration of this is figure 1, which extends data reported in Powell (2022). The 12-month change in average hourly earnings of private sector workers, the 12-month change in the Federal Reserve Bank of Atlanta’s wage tracker, and the four-quarter change in the employment cost index for workers in the private sector are all higher now than prior to the pandemic.
1. Nominal wage growth, aggregate measures
Growth in nominal wages need not translate into higher production costs if labor productivity increases at the same rate as wages. Employers would have to pay their workers higher wages, but their workers would also produce more goods and services. A better measure of whether firms face higher costs is unit labor cost, or the nominal wage wt at date t divided by real labor productivity, meaning the ratio of real output Yt to hours worked Lt. The question is whether unit labor costs have also been growing more rapidly in the past year than in the pre-pandemic period, specifically in non-housing services.
Let $\unicode{x03C0} _{t}^{ulc}$ denote the growth in log unit labor costs, i.e., \[\unicode{x03C0} _{t}^{ulc}=\ln ({{w}_{t}}/{{w}_{t-1}})-\text{ln}({{Y}_{t}}/{{Y}_{t-1}})+\text{ln}({{L}_{t}}/{{L}_{t-1}}).\]
We use data on value-added output for all private service-producing industries, from which we subtract value added for housing services. These value-added measures record the dollar value of output produced in a given sector for either intermediate use in other sectors or for final consumption, minus the amount paid for inputs produced in other sectors. We then compute the growth in real value-added output of non-housing services by using the value-added deflator for all services minus the deflator for value added in housing services times the share of housing value added in the value added of all services. We also assemble data on hours and wages in private service-producing industries. For hours, we use the hours of production and nonsupervisory employees on nonfarm payrolls in private service-providing industries, which is available for a longer period than for all workers. Since there are no data on hours specifically in housing services, we cannot net these from total hours. However, the share of these in total hours worked in the service sector is likely small (and is zero for housing services from owner-occupied housing). Finally, we use two measures of wages, average hourly earnings of production and nonsupervisory workers and the total compensation measure from the employment cost index, both for workers in private service-providing industries.
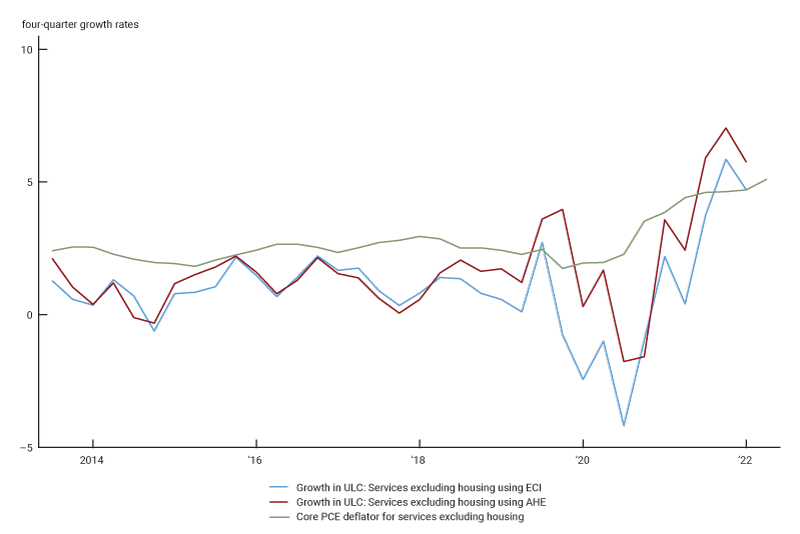
Figure 2 plots the implied $\unicode{x03C0} _{t}^{ulc}$ for non-housing services, reported as four-quarter changes to be comparable to figure 1. Unit labor costs in the non-housing service sector grew at a faster rate over the past year than before the pandemic. That is, nominal wage growth has exceeded productivity growth by a larger margin on average over the past year than before the pandemic. For comparison, figure 2 also shows the four-quarter change in inflation for core PCE (personal consumption expenditures) services excluding housing. The cost increases we show may have created inflationary pressures as service providers felt compelled to offset them by raising prices.
2. Growth in unit labor costs in non-housing services and core non-housing services inflation
Sources: U.S. Bureau of Economic Analysis and authors’ calculations based on data from the U.S. Bureau of Economic Analysis and U.S. Bureau of Labor Statistics.
Unit labor costs and forecasting aggregate inflation
We now turn to the question of whether growth in unit labor costs is helpful in predicting future inflation. This question has been extensively analyzed. Papers by Gordon (1988), Mehra (1991), Campbell and Rissman (1994), Emery and Chang (1996), Hess and Schweitzer (2000), Hu and Toussaint-Comeau (2010), Bidder (2015), and Peneva and Rudd (2017) find that there is at best weak evidence that aggregate unit labor costs help to predict aggregate price inflation.3 Others, including Knotek and Zaman (2014) and more recently O’Trakoun and Merone (2022), look at whether nominal wage inflation as opposed to growth in unit labor costs can predict inflation. They also find little evidence that nominal wage growth predicts inflation, although O’Trakoun and Merone find that nominal wage growth may have helped forecast inflation in services since the pandemic.
We first look at whether growth in aggregate unit labor costs helps predict aggregate inflation using updated data that includes the pandemic and then turn to data on non-housing services. The framework we use is due to Hu and Toussaint-Comeau (2010), which in turn builds on Campbell and Rissman (1994). Let $\unicode{x03C0} _{t}^{p}$ denote price inflation. Consider the following system of equations for the change in price inflation, and the change in the growth of unit labor costs $\unicode{x03C0} _{t}^{ulc}-\unicode{x03C0} _{t-1}^{ulc}:$
\[\unicode{x03C0} _{t}^{p}-\unicode{x03C0} _{t-1}^{p}={{\unicode{x03B1} }^{p}}+{{\unicode{x03B2} }^{p}}\left( \unicode{x03C0} _{t-1}^{p}-\unicode{x03C0} _{t-1}^{ulc} \right)+\sum\limits_{j=1}^{4}{\unicode{x03B3} _{j}^{p}\left( \unicode{x03C0} _{t-j}^{p}-\unicode{x03C0} _{t-j-1}^{p} \right)+\sum\limits_{j=1}^{4}{\unicode{x03BB} _{j}^{p}}}\left( \unicode{x03C0} _{t-j}^{ulc}-\unicode{x03C0} _{t-j-1}^{ulc} \right)+\unicode{x03B5} _{t}^{p}\]
\[\unicode{x03C0} _{t}^{ulc}-\unicode{x03C0} _{t-1}^{ulc}={{\unicode{x03B1} }^{ulc}}+{{\unicode{x03B2} }^{ulc}}\left( \unicode{x03C0} _{t-1}^{p}-\unicode{x03C0} _{t-1}^{ulc} \right)+\sum{_{j=1}^{4}}\unicode{x03B3} _{j}^{ulc}\left( \unicode{x03C0} _{t-j}^{p}-\unicode{x03C0} _{t-j-1}^{p} \right)\sum{_{j=1}^{4}\unicode{x03BB} _{j}^{ulc}}\left( \unicode{x03C0} _{t-j}^{ulc}-\unicode{x03C0} _{t-j-1}^{ulc} \right)+\unicode{x03B5} _{t}^{ulc}.\]
Note that this specification considers changes in inflation and the growth in unit labor costs. Some of the papers that have looked at the same question have looked at the levels of inflation and growth in unit labor costs. For a discussion of some of the reasons for using changes in these variables, see Hu and Toussaint-Comeau (2010).
Each equation contains four terms, as well as the catch-all error terms $\unicode{x03B5} _{t}^{p}$ and $\unicode{x03B5} _{t}^{ulc}.$ The first two, ${{\unicode{x03B1} }^{p}}$ and ${{\unicode{x03B1} }^{ulc}},$ are intercepts. The last two imply that the change in inflation and the change in the growth in unit labor costs may depend on lagged changes in inflation and lagged changes in the growth in unit labor costs. If changes in the growth of unit labor costs help predict changes in inflation, the coefficients $\unicode{x03BB} _{j}^{p}$ would be statistically different from zero. Likewise, if changes in inflation help predict changes in the growth in unit labor costs, the coefficients $\unicode{x03B3} _{j}^{ulc}$ should be statistically different from zero.
Finally, the second term in each equation, $\unicode{x03C0} _{t-1}^{p}-\unicode{x03C0} _{t-1}^{ulc},$ represents an error correction term. Including this term assumes, as appears to be the case in the data, that the ratio of the price to unit labor costs, which is known as the markup, tends to grow at a constant rate over time. In that case, if the growth in the markup deviated from its long-run rate, either inflation or the growth in unit labor costs (or both) would adjust to ensure that markups kept growing at their long-run rate. If inflation adjusts, we should see ${{\unicode{x03B2} }^{p}}\lt0.$ If labor costs adjust, we should see ${{\unicode{x03B2} }^{ulc}}\gt0.$
In short, unit labor costs help predict changes in inflation if either the coefficients on lagged changes in the growth of unit labor costs or the coefficient on the markup term are nonzero in the equation for the change in inflation. Inflation helps predict changes in the growth in unit labor costs if either the coefficients on lagged changes in inflation or the coefficient on the markup term are nonzero in the equation for the change in the growth of unit labor costs.
Hu and Toussaint-Comeau (2010) estimated the system above using the GDP (gross domestic product) deflator and unit labor costs for the nonfarm business sector starting in 1960:Q1 and 1984:Q1, respectively, until 2009:Q2.4 We consider three different measures of inflation—the GDP deflator, the PCE deflator, and the core PCE deflator—using data between 1984:Q1 and 2022:Q4. Figure 3 reports the p-values of tests that the respective coefficients differ from zero. A coefficient is significantly different from zero at the 5% level if the p-value is below 0.05. We cannot reject the null that the coefficients on lagged unit labor costs are all zero in the inflation equation or the null that the coefficients on lagged inflation are all zero in the unit labor cost equation. That is, $\unicode{x03BB} _{j}^{p}$ and $\unicode{x03B3} _{j}^{ulc}$ do not appear to be significantly different from zero. The coefficients on the error-correction term suggest that when growth in the markup deviates from its long-run rate, it is unit labor costs that adjust rather than inflation. That is, $\unicode{x03B2} _{j}^{p}$ does not significantly differ from zero, while $\unicode{x03B2} _{j}^{ulc}$ clearly does. To mitigate the effects of the Covid pandemic, we changed the sample period to either end in 2019:Q4 or to omit the first three quarters of the pandemic. The results for the PCE deflator and core PCE deflator were similar. For the GDP deflator, we still could not reject that $\unicode{x03B2} _{j}^{p}$ was different from zero. For the lagged changes in the growth rate of unit labor costs, the p-values were 0.02 and 0.07 when we ended the sample early and dropped the first three quarters of the pandemic, respectively. We also tried adding an unemployment gap term and relative import prices in the two equations, which did not substantially change the results.
3. P-values for the null that coefficients equal 0, aggregate data, 1984:Q1–2022:Q4
| Price inflation | Growth in ULC | |||
|---|---|---|---|---|
| ${{\unicode{x03B2} }^{p}}$ | $\left\{ \unicode{x03BB} _{j}^{p} \right\}_{j=1}^{4}$ | ${{\unicode{x03B2} }^{ulc}}\left\{ \unicode{x03B3} _{j}^{ulc} \right\}_{j=1}^{4}$ | ||
| GDP deflator | 0.99 | 0.67 | 0.00 | 0.30 |
| PCE deflator | 0.24 | 0.64 | 0.00 | 0.39 |
| Core PCE deflator | 0.20 | 0.42 | 0.00 | 0.37 |
Unit labor costs and forecasting inflation in non-housing services
Next, we turn to the non-housing service sector: Do changes in the growth of unit labor costs help predict changes in inflation for non-housing services? Results for the aggregate may not hold for individual sectors. For example, Rissman (1995) finds that unit labor costs in manufacturing and retail trade can predict inflation. However, she focuses on aggregate inflation measures rather than inflation in the same sector. Brauer (1997) finds evidence that compensation growth in services can help predict price inflation for particular services. However, he does not look at unit labor costs, nor does he use a formal statistical test. Finally, as noted above, O’Trakoun and Merone (2022) find some evidence that wage growth may have helped to predict inflation in services, although they do not look at unit labor costs.
Unfortunately, value-added measures of output are only available from 2005:Q1. To have longer time series that are comparable to those we use for aggregate data requires a proxy measure of unit labor costs before 2005. The National Income and Product Accounts (NIPA, produced by the U.S. Bureau of Economic Analysis) offer a long time series on the sale of final services produced. This measure omits services that are produced as intermediate inputs outside the service sector and includes the value of intermediates used by the service sector but produced in other sectors. It also includes government consumption expenditures on services, such as education and national defense, that are produced by the government. We subtract government consumption expenditures from this measure, as well as the value of housing services consumed, to arrive at a measure of non-housing services consumed by the private sector.5 We then convert these nominal values into real values using the PCE services deflator minus inflation in housing services times the share of housing in services consumption. In short, our measure of productivity growth before 2005:Q1 uses an output measure that omits the net flow of intermediate goods between services and the rest of the economy as well as private services purchased by the government sector. If these missing terms are not too large and tend to grow at the same rate as value added, final sales of non-housing services should serve as a reasonable proxy for the growth rate in value added when this data is not available. We confirm that the two series have grown at the same rate on average since 2005:Q1 and are highly correlated. The series on final services also appears to be less volatile than value added, suggesting that the components of value added we omit tend to be more volatile than value added as a whole.
Turning to data on prices in the service sector, we use two different inflation measures for services, the PCE services deflator minus inflation in housing services times the share of housing in services consumption and the core PCE services deflator minus inflation in housing services times the share of housing in core services. As evident in figure 2, prices of core non-housing services over the past year increased before the growth of unit labor costs in this sector, in line with the notion that unit labor costs are typically a lagging indicator.
We estimate the same system of equations as for the aggregate data. Our results for both measures of nominal wage growth are reported in figure 4. As with the aggregate data, we cannot reject the null that neither lagged unit labor costs nor a temporarily high markup help to predict high inflation going forward at conventional significance levels. A temporarily high markup still predicts higher growth in unit labor costs rather than higher inflation. When we change the sample period to mitigate the effects of data from the pandemic, the results are the same as when we use average hourly earnings as our measure of nominal wage growth. When we use the employment cost index instead, the p-values for whether the coefficients on lagged changes in the growth of unit labor costs are different from zero are 0.05 and 0.06. However, the coefficients on these lagged terms are all negative, meaning that higher growth in unit labor costs predicts slower inflation growth. We thus find no support in the sectoral data and model specifications we use for the idea that more rapid growth in unit labor costs can help predict higher inflation.
4. P-values for the null that coefficients equal 0, sectoral data, 1984:Q1–2022:Q3
| Price inflation | Growth in ULC | |||
|---|---|---|---|---|
| ${{\unicode{x03B2} }^{p}}$ | $\left\{ \unicode{x03BB} _{j}^{p} \right\}_{j=1}^{4}$ | ${{\unicode{x03B2} }^{ulc}}\left\{ \unicode{x03B3} _{j}^{ulc} \right\}_{j=1}^{4}$ | ||
| Employment cost index | ||||
| PCE services deflator | 0.33 | 0.42 | 0.00 | 0.85 |
| Core services deflator | 0.31 | 0.42 | 0.00 | 0.72 |
| Average hourly earnings | ||||
| PCE services deflator | 0.82 | 0.38 | 0.00 | 0.33 |
| Core services deflator | 0.77 | 0.28 | 0.00 | 0.18 |
Interpretation and takeaways
We conclude with a brief interpretation of our results and some key takeaways. We find that unit labor costs do not provide significant help forecasting changes in inflation, but inflation does help forecast changes in the growth of unit labor costs. Our results mirror findings for the aggregate economy from multiple studies. These results suggest that unit labor costs are a lagging indicator: Inflation helps predict growth in unit labor costs rather than the other way around. Such patterns are consistent with macroeconomic models in which wages adjust more slowly than prices. In these models, inflation is a forward-looking variable that depends on expected future marginal costs. If prices adjust more quickly than wages, inflation will rise when firms expect higher wage growth in the future. Inflation would then move ahead of, and thus help forecast, the growth in unit labor costs. Since wages adjust more slowly, growth in unit labor costs would not be useful for forecasting future inflation. Sbordone (2002) was among the first to confirm the predictions of these models with aggregate data.
Although lagged growth in unit labor costs does not help to forecast changes in inflation, this does not mean that the labor market is unimportant for inflation or that lower inflation does not require growth in unit labor costs to fall eventually. Shocks in the labor market that lead firms to expect higher nominal wage growth in the future, and thus higher growth in unit labor costs, do lead to higher inflation in standard macroeconomic models. The point is that if wages are slower to adjust than prices, unit labor costs will rise after inflation rather than vice versa.6
Finally, since growth in unit labor costs does not predict inflation, one has to be careful in using unit labor costs to identify inflationary pressures. Given the lagging nature of unit labor costs, using the slowdown in the growth in unit labor costs to identify when inflationary pressures have abated may overestimate the point at which inflationary pressures truly eased.
We thank Dan Sullivan for helpful comments and suggestions and Parker Snipes for excellent research assistance.
Notes
1 Adams et al. (2022) look at whether the change in rents for new leases have predictive power for rental inflation as measured by the Consumer Price Index (CPI), which is the same measure used in the Personal Consumer Expenditures (PCE) price index. They conclude it does, but that the index for new leases and existing leases may not be cointegrated in the way theory suggests.
2 In his November 30, 2022, speech, Federal Reserve Chair Jerome Powell highlighted the role of core services excluding housing in contributing to inflation as measured by the core PCE deflator.
3 Ghali (1999) does find evidence that unit labor costs help forecast inflation, but these findings are unusual in the literature.
4 Some have proposed using trend unit labor costs rather than the raw labor cost to eliminate noise in measured productivity. When Peneva and Rudd (2017) use the trend of unit labor costs measure we use, they find limited pass-through from wages to inflation after the 1980s. Work using nominal wage growth that is not affected by noise in the measure of productivity also finds wages are not especially helpful in forecasting inflation. We therefore choose to use the raw data.
5 Data on the value of final services comes from table 1.2.5 of the National Income and Product Accounts. Data on government consumption expenditures comes from table 1.5.5. Data on housing services comes from table 2.4.5U.
6 Empirical evidence summarized in Nakamura and Steinsson (2013) reports the median time between price changes is on the order of four to five months for any change in the posted price and seven to eight months if we exclude temporary sales. By contrast, evidence on wages in Grigsby, Hurst, and Yildirmaz (2021) suggests wage changes for both hourly and salary workers are heavily concentrated at 12-month intervals, with a non-negligible share of changes occurring at 24 months. Bils and Klenow (2004) report that the median time between price changes is longer for services than for goods, although even for services the time is often shorter than 12 months.
References
Adams, Brian, Lara P. Loewenstein, Hugh Montag, and Randal J. Verbrugge, 2022, “Disentangling rent index differences: Data, methods, and scope,” Federal Reserve Bank of Cleveland, working paper, No. 22-38, December. Crossref
Bidder, Rhys, 2015, “Are wages useful in forecasting price inflation?,” FRBSF Economic Letter, Federal Reserve Bank of San Francisco, 2015–33, November 2, available online.
Bils, Mark, and Peter J. Klenow, 2004, “Some evidence on the importance of sticky prices,” Journal of Political Economy, Vol. 112, No. 5, October, pp. 947–985. Crossref
Brauer, David A., 1997, “Do rising labor costs trigger higher inflation?,” Current Issues in Economics and Finance, Federal Reserve Bank of New York, Vol. 3, No. 11, September, available online.
Campbell, Jeffrey R., and Ellen R. Rissman, 1994, “Long-run labor market dynamics and short-run inflation,” Economic Perspectives, Federal Reserve Bank of Chicago, Vol. 18, No. 2, pp. 15–27, available online.
Emery, Kenneth M., and Chih-Ping Chang, 1996, “Do wages help predict inflation?,” Economic Review, Federal Reserve Bank of Dallas, First Quarter, pp. 2–9, available online.
Ghali, Khalifa H., 1999, “Wage growth and the inflation process: A multivariate cointegration analysis,” Journal of Money, Credit and Banking, Vol. 31, No. 3, part 1, August, pp. 417–431. Crossref
Gordon, Robert J., 1988, “The role of wages in the inflation process,” American Economic Review: Papers and Proceedings of the One-Hundredth Annual Meeting of the American Economic Association, Vol. 78, No. 2, May, pp. 276–283, available online.
Grigsby, John, Erik Hurst, and Ahu Yildirmaz, 2021, “Aggregate nominal wage adjustments: New evidence from administrative payroll data,” American Economic Review, Vol. 111, No. 2, February, pp. 428–471. Crossref
Hess, Gregory D., and Schweitzer, Mark E., 2000, “Does wage inflation cause price inflation?,” Federal Reserve Bank of Cleveland, policy discussion paper, No. 1, April, available online.
Hu, Luojia, and Maude Toussaint-Comeau, 2010, “Do labor market activities help predict inflation?,” Economic Perspectives, Federal Reserve Bank of Chicago, Vol. 34, No. 2, pp. 52–63, available online.
Knotek, Edward S., II, and Saeed Zaman, 2014, “On the relationships between wages, prices, and economic activity,” Economic Commentary, Federal Reserve Bank of Cleveland, No. 2014-14, August 19. Crossref
Mehra, Yash P., 1991, “Wage growth and the inflation process: An empirical note,” American Economic Review, Vol. 81, No. 4, September, pp. 931–937, available online.
Nakamura, Emi, and Jón Steinsson, 2013, “Price rigidity: Microeconomic evidence and macroeconomic implications,” Annual Review of Economics, Vol. 5, August, pp. 133–163. Crossref
O’Trakoun, John, and Brennan Merone, 2022, “Are services serving up a wage-price spiral?,” Macro Minute, Federal Reserve Bank of Richmond, blog, November 15, available online.
Peneva, Ekaterina V., and Jeremy B. Rudd, 2017, “The passthrough of labor costs to price inflation,” Journal of Money, Credit and Banking, Vol. 49, No. 8, December, pp. 1777–1802. Crossref
Powell, Jerome H., 2022, “Inflation and the labor market,” speech at the Brookings Institution, Hutchins Center on Fiscal and Monetary Policy, Washington, DC, November 30, available online.
Rissman, Ellen R., 1995, “Sectoral wage growth and inflation,” Economic Perspectives, Federal Reserve Bank of Chicago, Vol. 19, No. 4, pp. 16–28, available online.
Sbordone, Argia M., 2002, “Prices and unit labor costs: A new test of price stickiness,” Journal of Monetary Economics, Vol. 49, No. 2, March, pp. 265–292. Crossref


