We present evidence on how financial conditions since late 2021 have compared to previous periods when the Federal Reserve tightened monetary policy. To account for differences in the pace and extent of tightening, we estimate linear regression models that capture the typical behavior of various financial variables given the changes in the fed funds rate experienced during previous tightening cycles. Using these models, we project a path for each financial variable based on the path of policy tightening observed during this cycle. We find little evidence that the pass-through of policy rates to financial conditions has been unusually weak, providing some reassurance that the tighter policy of the last two and a half years has acted to reduce inflation as intended.
In assessing the appropriate level of monetary policy, a crucial consideration is the extent to which the level of short-term interest rates passes through to broader financial conditions. As a case in point, between early 2022 and late 2023, the Fed’s primary monetary policy body, the Federal Open Market Committee (FOMC) raised the federal funds rate (FFR) by over 500 basis points, and it has since held it steady at a relatively high level for a year. During this time, long-term Treasury yields have risen considerably on net, but other financial variables have seemingly been slower to respond or have even showed signs of easing. For example, broad indexes of U.S. stock prices increased over 15% on net between early 2022 and July 2024, while most private credit spreads narrowed. These observations may lead one to wonder whether monetary policy has transmitted to financial conditions as effectively as in the past.
In this Chicago Fed Letter, we provide evidence on how financial conditions since late 2021 have compared to previous periods when the Federal Reserve has tightened monetary policy. To account for differences in the pace and extent of tightening across episodes, we regress various financial indicators on the path of the fed funds rate. We use the regressions to project a path of each financial variable, given the path of policy tightening observed during this cycle, and check whether the actual values in this cycle were significantly tighter or looser than these projections.
We find that most financial conditions this cycle have tightened at least as much we would have expected based on historical experience. Long-term interest rates, including those on Treasury securities and mortgages, have been significantly above their historically predicted paths for most of the last two years. Lending standards have been much tighter than we would have forecast, and loan growth has been weaker. And, while equity and home prices have risen, consistent with an improvement in household wealth and thus a loosening of financial conditions, those net increases have not been dramatically greater than in previous cycles. The main exception to the tighter-than-normal pattern is in corporate credit spreads, which have narrowed significantly more than we would have expected. However, this credit-spread narrowing has not been sufficient to offset the rise in underlying risk-free rates, so that firms’ borrowing costs have still increased more than in previous cycles.
While these results do not, by themselves, suggest whether policy has been appropriate to meet the FOMC’s objectives of stable prices and maximum sustainable employment, they are consistent with a pass-through of policy rates to financial conditions that has continued to be at least as strong as in the past. This finding may provide some reassurance that the aggressive monetary tightening the FOMC has undertaken over the last two and a half years has acted to bring the economy into better balance and reduce inflation as intended.
Methodology
We begin by isolating monetary tightening cycles using monthly data on the effective federal funds rate (FFRt) since 1954. Such cycles are straightforward to identify beginning in the 1990s, when the FOMC began announcing formal interest rate targets. Prior to that time, the FFRt was volatile, and we have to adopt a rule for identifying periods of continuous tightening that smooths out some of the month-to-month noise. The rule we use is as follows:
- We consider there to be a “material change” in FFRt if the sum of the three monthly changes from month t – 1 through month t + 1 is greater than 25 basis points (bps). This distinction helps us ignore month-to-month noise.
- We say that month t is in a tightening cycle if there is either a positive material change in month t or the previous material change and the next one (regardless of how far apart they are) are both positive.
- We require tightening cycles to last for at least eight consecutive months.
This results in 14 tightening cycles since 1954. These cycles have an average length of 23 months, with an average total increase of 4.0 percentage points in the fed funds rate.1
If all tightening cycles proceeded at the same rate and lasted the same amount of time, comparing the behavior of financial variables across them would be a trivial exercise; we could simply line them up and look at the range of previous outcomes over similar periods after each cycle began. Because each cycle differs in its timing and pace, however, matters are slightly more complicated.
The effects of changes in the policy rate on financial variables are unlikely to be entirely contemporaneous. In some cases, they involve the well-known lags associated with policy pass-through. To understand the typical amount of policy pass-through on financial variables, we regress various financial indicators on changes in the fed funds rate and its lags during previous policy-tightening episodes.2 Specifically, for any variable of interest $y_t$, we estimate:
\[\unicode{x00394} {{y}_{t}}=\unicode{x03B1} +{{\unicode{x03B2} }_{0}}{{\unicode{x00394} }^{1}}FF{{R}_{t}}+{{\unicode{x03B2} }_{1}}{{\unicode{x00394} }^{3}}FF{{R}_{t-1}}+{{\unicode{x03B2} }_{2}}{{\unicode{x00394} }^{4}}FF{{R}_{t-4}}+{{\unicode{x03B2} }_{3}}{{\unicode{x00394} }^{8}}FF{{R}_{t-8}}+{{\varepsilon }_{t}},\]
where we define ${{\unicode{x00394} }^{n}}{{x}_{s}}\equiv {{x}_{s}}-{{x}_{s-n}}.$3 Because it may be the case that monetary transmission behaves asymmetrically, we estimate these models using data only from the tightening cycles we identified, not from periods when policy rates were declining or constant.
Given that the relationship between each financial variable and the federal funds rate may have changed over time—especially over such a long period—we allow for a break point in this model. By doing this, we allow for the coefficients, and thus the predicted co-movement between the federal funds rate and our financial variables, to change once over the sample period. Specifically, we estimate models using data as far back in time as each series is available, and we use the algorithm of Bai and Perron (2003) to estimate whether there is a break date and, if so, at which point in time it is most likely. If there is a break detected, we use the post-break coefficients, as we expect more recent tightening cycles to be more reflective of expected pass-through in the current cycle. Otherwise, we use the coefficients estimated from the full period.4 We then apply those coefficients to the data since the start of the current tightening cycle in March 2022 to create a projected path of each financial variable. Effectively, these projections are out-of-sample forecasts. We end our projections in July 2024.
It is important to be clear about the interpretation of this exercise. We are constructing conditional expectations of financial indicators given a particular path of the funds rate—and that is the only thing we are conditioning on. Obviously, many other variables may differ across tightening episodes, including the rate of inflation and the performance of the real economy. Our results do not control for such factors. Another important variable we omit is expectations for the future. Policy expectations matter for forward-looking financial markets, and those expectations vary considerably in cycles depending on the FOMC’s forward guidance and other factors.5
One implication of these caveats is that our results should not be interpreted as causal. We will not be able to say for sure that monetary policy has had a larger or smaller impact on any given variable than in the past. But we will be able to say whether financial conditions are behaving similarly to the way they have behaved in previous tightening cycles, given the path of policy. By performing this analysis across different series, we can also use the results to identify which segments of financial markets have performed unusually, which may help to pinpoint the mechanisms behind any anomalous behavior.
Results from individual series
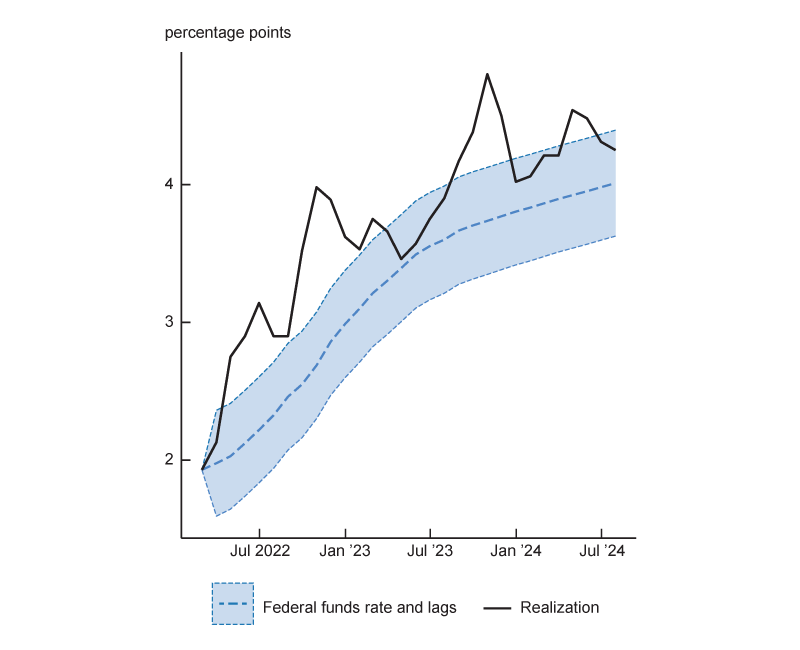
Figure 1 shows the results for the ten-year Treasury yield and the 30-year fixed mortgage rate. The blue lines in the figure are the predictions of these variables based on historical experience and the recent path of policy, together with 95% confidence intervals. The black lines are the series we have actually observed since the end of 2021. In both cases, we find that long-term interest rates have consistently exceeded what the model would have predicted. Because long-term Treasury rates are benchmarks for many private borrowing costs, this is likely to imply that the cost of credit has generally been tighter than we would have expected this cycle, a point we will return to below.
1. Interest rate realizations and model predictions
A. Ten-year Treasury yield
B. 30-year fixed mortgage rate
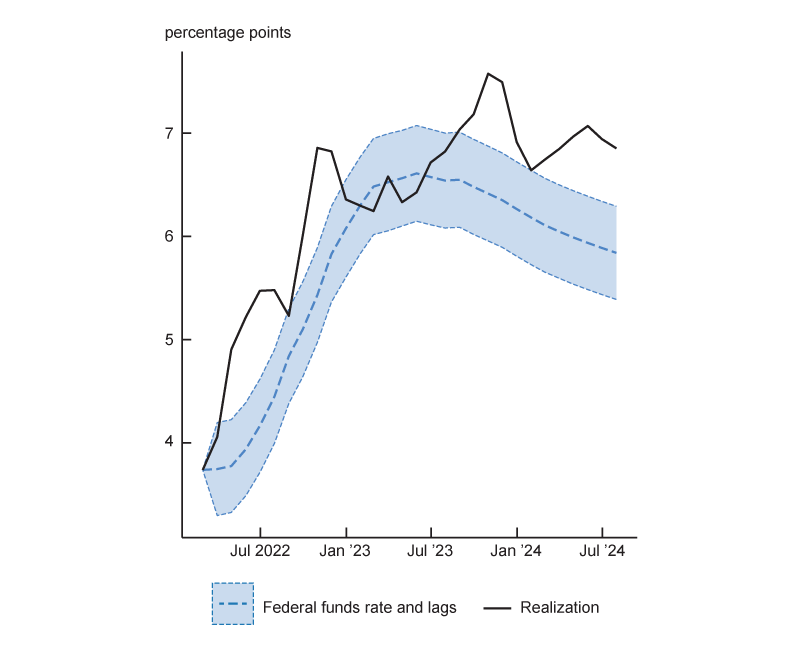
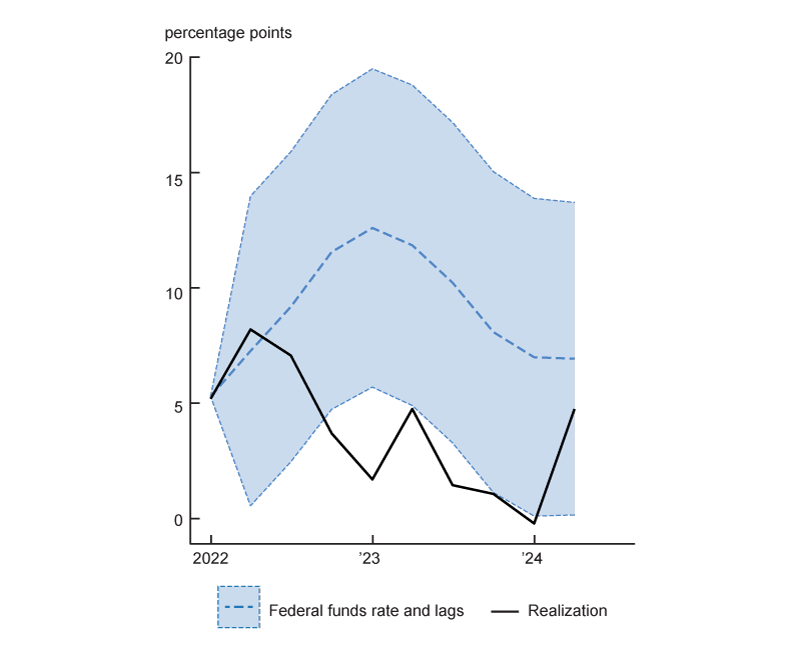
Figure 2 shows the results for some variables related to banking conditions: the net fraction of banks reporting tightening in commercial lending in the Senior Loan Officer Opinion Survey (SLOOS) and the rate of overall loan growth at banks.6 In both cases, the results show a dramatic tightening of conditions relative to expectations. Moreover, both of these series reflect quarterly changes in banking conditions, so that the cumulative discrepancies for bank conditions are quite large. Results for other categories in the SLOOS and for the individual components of loan growth (not shown) display similar patterns.
2. Banking conditions and model predictions
A. Nonfinancial business loan growth
B. SLOOS commercial and industrial standards
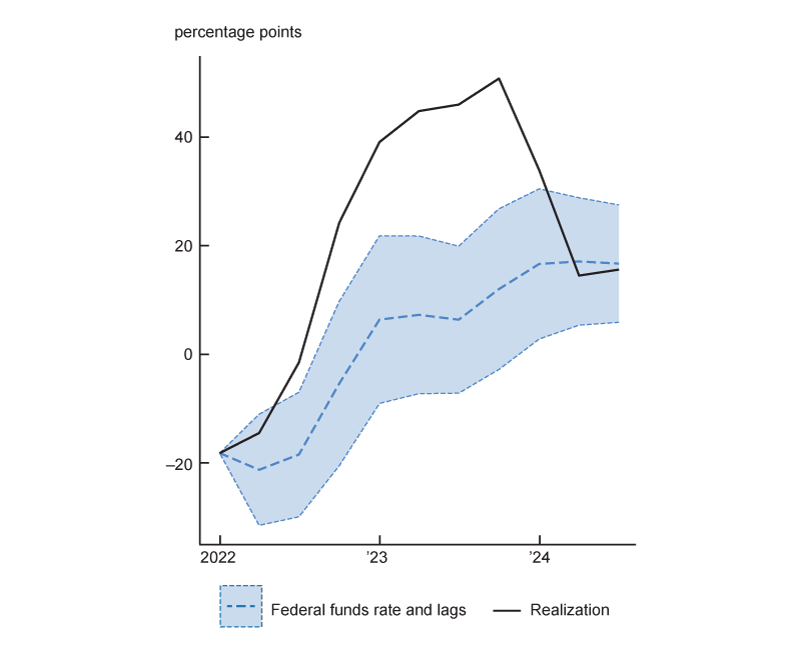
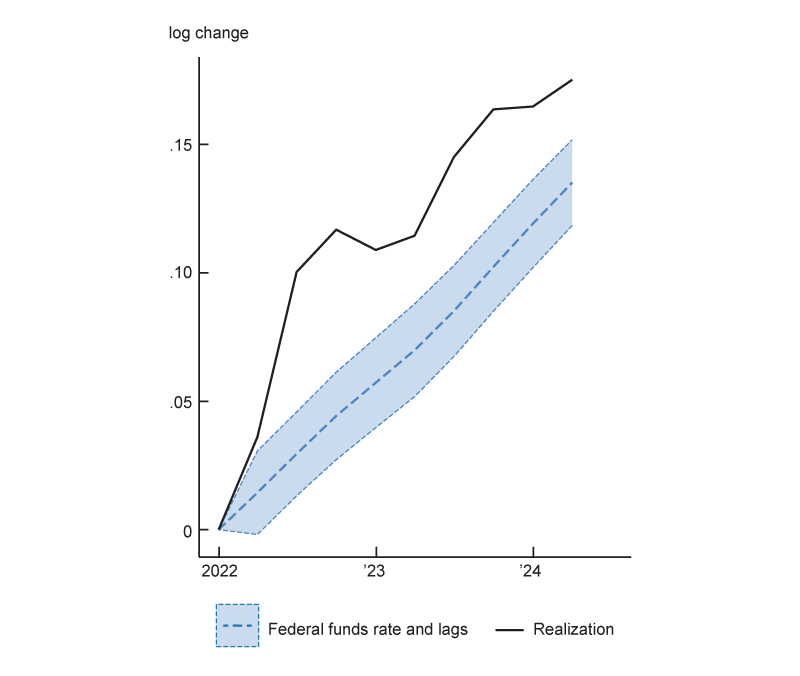
Figure 3 shows two variables related to household wealth: the level of the S&P 500 index of equity prices and the Case–Shiller U.S. National Home Price Index. Equities generally underperformed historical expectations during the first year or so of this policy tightening but outperformed through July 2024. Thus, on net, the level of stock prices in mid-2024 is about where we would have expected it to be, given the amount of tightening the FOMC has put in place. House prices have risen slightly faster than historical experience predicts, but the net discrepancy as of mid-2024 is relatively modest, at about 4 percentage points. When we use inflation-adjusted house prices (not shown), the difference is even smaller and statistically insignificant.7
3. Household wealth indicators and model predictions
A. Stock market

B. Home price
Finally, figure 4 shows the results for corporate credit spreads. Here, the story is somewhat different. AAA spreads typically decline somewhat during tightening cycles (presumably reflecting the same economic strength that is leading monetary policy to tighten), but this time the decline has been more dramatic—50 basis points, on net, since the beginning of the cycle. Similarly, the BAA spread has declined 53 basis points, while the model would have predicted it to widen a bit.8 Even so, we note that the negative gap in credit spreads, relative to model-based expectations, has on average been smaller than the positive gap in Treasury yields shown in figure 1. This implies that the all-in costs of credit for borrowers in the bond market have generally risen more than would have been predicted historically. Again, this is consistent with tighter-than-expected financial conditions.
4. Corporate bond spreads and model predictions
A. AAA spread
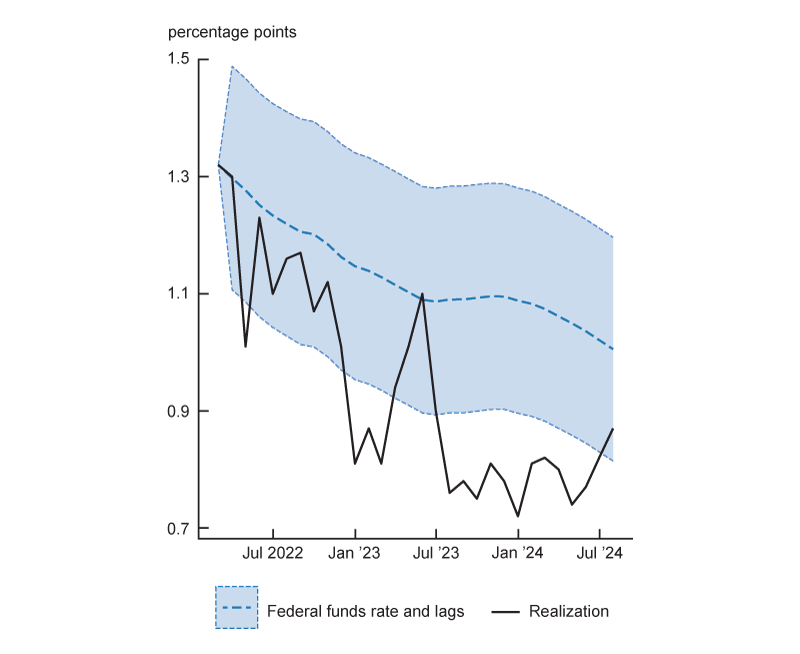
B. BAA spread

Results from financial conditions indexes
One may also ask what aggregate financial conditions look like, relative to what we would expect historically. For this purpose, we turn to two measures of broad financial conditions, the Federal Reserve Bank of Chicago’s National Financial Conditions Index (NFCI; see Brave and Butters, 2011), and the Federal Reserve Board’s Financial Conditions Impulse on Growth (FCI-G) Index (Ajello et al., 2023). We run the same regressions on these aggregated series as for the individual financial variables.
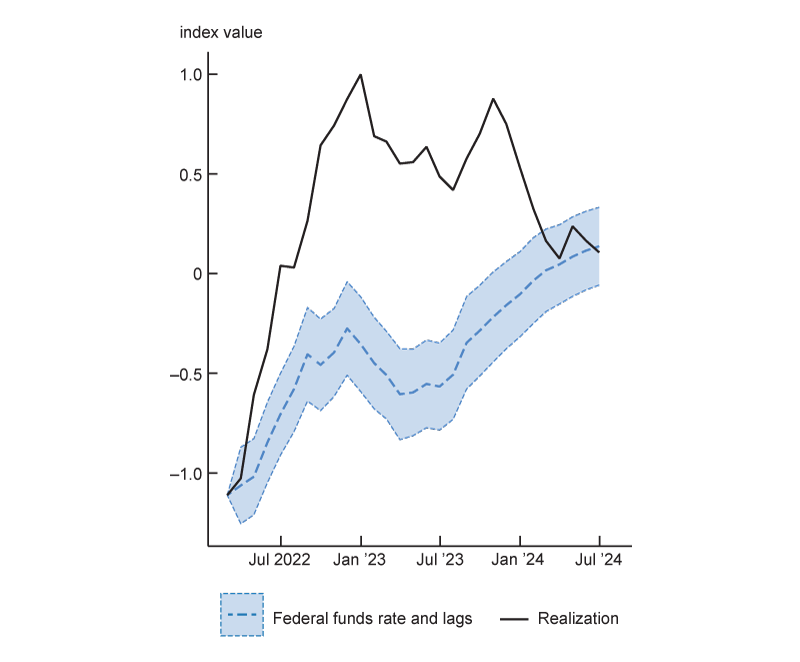
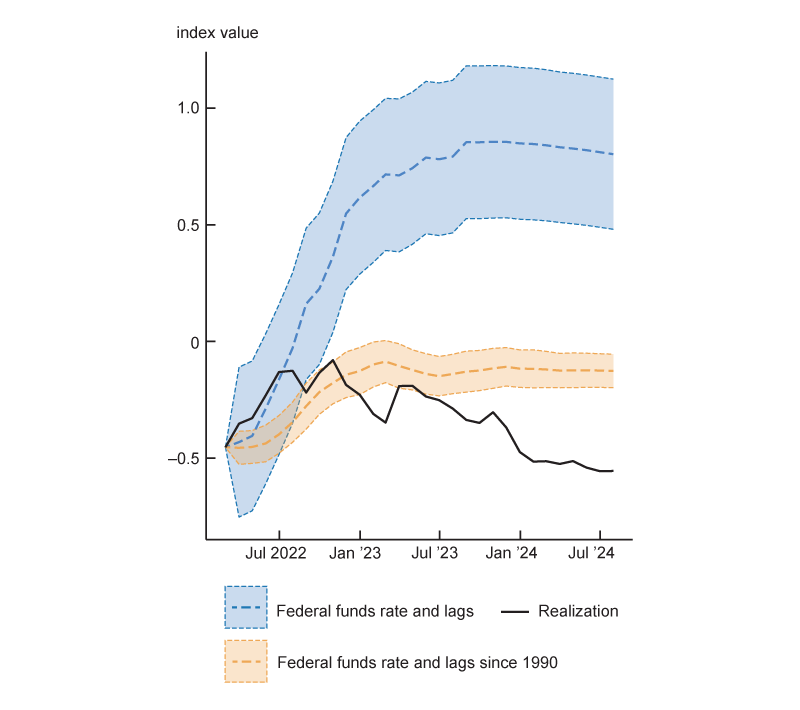
The results, shown in figure 5, display some striking differences. The FCI-G indicates that financial conditions have been considerably tighter than the model-based expectations over most of the post-2021 period, while the Chicago NFCI indicates that they have been much looser. This difference in results can be traced to several sources.
5. Financial conditions indexes and model predictions
A. Financial Conditions Impulse on Growth Index (FCI-G)
B. National Financial Conditions Index (NFCI)
First, given the different approaches used to construct these two indexes, the differences in outcomes make sense in light of the results in individual series presented earlier. The FCI-G index places a lot of weight on the levels of longer-term interest rates. As noted earlier, these have generally been above what historical experience would have predicted over this cycle.9 In contrast, the aggregate NFCI places relatively little weight on the level of risk-free rates but substantial weight on corporate credit spreads, as well as on highly correlated series, such as spreads in short-term funding markets. Indeed, when we look at the subindexes of the NFCI (not shown), we find large discrepancies in the “risk” and “credit” components, where most credit-spread-related variables are contained, while the “leverage” component, which does not contain these variables and places more weight on changes in long-term Treasury rates, is about in line with historical experience.
Second, the NFCI is available back to the 1970s, and our regressions use this full series of data. However, the FCI-G is only available after 1990. The NFCI is notably more volatile in the 1970s and early 1980s than afterwards, suggesting that the comparison across sample periods may not be appropriate. When we run the NFCI model on the same sample used for the FCI-G, its performance this cycle is closer to what the model predicts, as shown in orange in the figure.10
Finally, the different constructions of these two financial conditions indexes reflect their different emphasis in interpretation. The FCI-G is meant to capture how financial conditions are likely to stimulate or restrain macroeconomic activity. The NFCI, on the other hand, is meant to speak more to financial stability concerns, so it places a greater emphasis on measures of risk aversion, fragility, and illiquidity in financial markets. Indeed, that index does well in predicting financial crises.11 Thus, it is not necessarily inconsistent to observe that one index should be “tighter” than historical experience, while the other is “looser.” It is possible to reconcile those two results by concluding that there was both a greater degree of restraint on the real economy than in a typical tightening cycle and less stress in the financial system accompanying that restraint.
Conclusion
We present evidence on how financial conditions since late 2021 have compared to previous periods when the FOMC tightened monetary policy, using a simple regression framework that predicts the path of financial indicators based on the path of the fed funds rate during such periods. Overall, we find little evidence that the pass-through of policy rates to financial conditions has been atypically weak. The main exception is for corporate credit spreads, which have narrowed more than usual during this cycle. However, this credit-spread narrowing has not been sufficient to offset the rise in underlying risk-free rates, so that firms’ borrowing costs, like those of households, have still increased more than in previous tightening episodes. While these results should not be interpreted as causal effects of monetary policy and do not, by themselves, suggest whether policy has been appropriate to meet the FOMC’s objectives, they may nonetheless provide some reassurance that the tighter monetary policy of the last two and a half years has passed through to financial conditions and acted to reduce inflation as intended.
Notes
1 For comparison, assuming the most recent tightening cycle concluded in August 2023, it lasted 17 months and involved an FFR increase of 5.25 percentage points. We also ran our model using the alternative definition of tightening cycles in Forbes, Ha, and Kose (2024), with no qualitative differences in the results.
2 Including lags in these regressions may also help to capture perceived momentum in the pace of policy tightening, which could be an important factor driving expectations of the future path.
3 For the home price and stock market variables, we use log differences instead of level differences.
4 The only two break points we find in the models for the displayed series are in July 1979 for the 30-year mortgage rate and March 1979 for the Home Price Index.
5 As a robustness check, we also conditioned the regressions on future levels of the FFR, in addition to lags. The results were not substantially different from those we report below, with one exception that we note
6 For ease of exposition, we report the results for lending as growth rates, rather than accumulating as we do for the other series.
7 It is also worth noting that sales volumes in the housing market have been particularly thin this cycle, so that the information content of the price series may have changed.
8 Although it is not entirely clear what has driven these departures from past experience, we note that corporate balance sheets have generally remained quite healthy over the past three years, while risk assets have generally seen strong investor demand.
9 The weightings of financial indicators in the FCI-G are based on their relative estimated medium-run effects on gross domestic product (GDP), as reflected in the Board’s macroeconomic models. Long-term rates are important in those models because of their effects on household and firm borrowing costs. Equity and house prices also play a role, but as shown earlier, those variables have not been far out of line with historical experience. Finally, FCI-G also places some weight on the exchange value of the dollar. We have not shown that variable here, but we find that it has also generally been tighter than expected.
10 As stated in note 5, we also ran specifications including the future fed funds rate path, in addition to lags (not shown). After controlling for changes in the expected path of policy in this way, the remainder of the gap between the orange and black lines in figure 5 disappears, so that the NFCI in the most recent cycle is almost exactly what the model would have predicted.
11 See Brave and Butters (2012).


