

"If all the assets were sold and all the debts repaid, the value which would be left over is equal to the bank’s equity…..The more capital there is, this means the bank can absorb more losses on its assets before it becomes insolvent."
—The Financial Times lexicon
Introduction
The financial crisis and recession of 2008-2010 made the availability of capital a significant area of concern for community banks, and led many of these institutions to seek out sources to rebuild their equity.1 The need for capital may have been even greater for some minority-owned financial institutions. Minority-owned depositories are a small subset of financial institutions, most of which are also community banks, reflecting either black, Hispanic, Asian, or Native American ownership, or majority minority board members and a mission to serve minority populations. Regulators have long supported the existence of minority-owned institutions as a way to promote the economic viability of minority and underserved communities.2
The markets that many minority-owned banks serve were hit hard by the financial crisis in 2008. Following the recession that resulted, minority banks had a higher ratio of nonperforming loans than non-minority-owned peers, a lower share of core deposits, and higher expenses relative to income.3 An average of 4 percent of the sector failed per year between 2009 and 2011 (23 minority-owned banks in all) compared to about 2 percent of community banks (about 400 community banks in all). In addition, more than a third of the minority-owned institutions that received federal financial assistance through the Troubled Asset Relief Program (TARP) had yet to repay the full investment as of January 2018, compared to about 18 percent of community banks that still owed TARP funds. In 2016, the last year of this analysis, we count 153 minority-owned banks extant, compared to 212 in 2008.4 The number of black-owned banks in particular fell from 42 banks in 2008 to 25 in 2016. (As of December 2017, we count 149 minority-owned banks.)
The particular hurdles facing minority business owners’ access to capital have been well documented.5 Much of the literature on this topic addresses barriers to debt capital, including less use of bank credit, smaller bank loans, lower credit scores, and higher rates of loan denials. But researchers have also found minority business owners have less equity capital. Studies show, for example, that relatively low levels of wealth among Hispanics and blacks have contributed to lower business creation rates relative to their representation in the U.S. population; and that the largest single factor explaining racial disparities in business creation rates is differences in (personal) asset levels. Among new businesses, the average black-owned business has around $500 of outside equity at founding, compared to more than $18,500 for the average white-owned business.6 And on the investor side, a recent study on diversity within investment firms finds a very small percentage (3 percent to 9 percent) of mutual funds, hedge funds, private equity funds, and real estate funds owned by minorities and women.7 These data points, in conjunction with the criteria that at least 51 percent of the voting stock (or the majority of board seats) at minority-owned banks be held by minority individuals, help motivate a discussion on the availability of equity for minority-owned banks.
The analysis that follows explores capital access in the context of recapitalization efforts at minority-owned financial institutions. We use the bank reporting form, “Changes in Bank Equity Capital” (Schedule RI-A in the Consolidated Report of Conditions and Income), supplemented with data on TARP participation and capital market issuances from SNL Financial, to highlight the methods by which minority banks added to equity capital before, during, and after the financial crisis. The FDIC’s 2012 report on “Capital Formation at Community Banks” provides a template for this work. In the analysis below, we drill down on the main components of equity change contained in Schedule RI-A to shed light on potential differences in sources of capital for minority-owned institutions and community banks with assets under $10 billion,8 and to examine whether these sources differ within the MDI sector. This exercise allows us to better understand the channels by which minority banks succeeded in raising new capital after the financial crisis, and to identify the trends and policies that might improve capital access in the future.
Components of change to bank equity
The calculation of ‘change in equity’ for a bank is based on five main categories, including: income, dividends, the sale or redemption of (preferred or common) stock of that bank, the value of shares issued from purchasing another bank or business, transfers from or to the parent company, and other income related to securities holdings and other financial instruments.9
1. Net income
Net income has been by far the most common source of new capital for both banks with assets under $10 billion (a.k.a. community banks) and minority-owned institutions. (Positive) net income contributes to capital insofar as the cumulative income of a firm after dividends is retained earnings, and retained earnings are accounted for as part of shareholder equity. Between 2006 and 2016, an average of 87 percent of community banks, and 68 percent of minority-owned banks, reported positive earnings (table 1). The economic downturn in 2008 took a heavy toll on earnings, however, and therefore on the main source of new equity for these institutions. Many of these banks reported losses in 2008, 2009, and 2010. In 2009, for example, minority banks in the aggregate experienced a loss of roughly 2 percent (expressed as a ratio of earnings against risk-weighted assets), compared to less than a half percent for the community bank sector (figure 1A). Otherwise put, net income (before dividends) contributed to about 56 percent of the change in equity at minority-owned banks between 2006 and 2016, compared to about 90 percent of equity change at community banks (table 2).
Table 1. Components of equity change: Share of banks

Table 2. Share of change in equity, by category
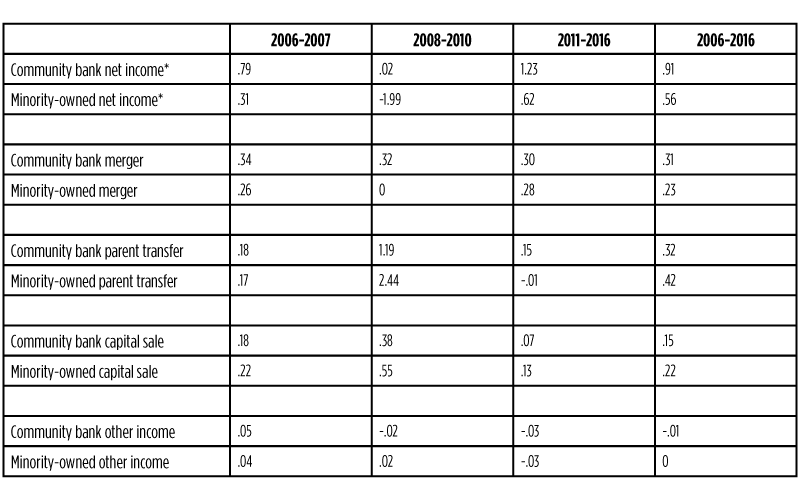
Figure 1A. Net income/risk-weighted assets

Figure 1B. Net income/risk-weighted assets (minority-owned)

Another trend since the 2008 recession has been greater divergence in earnings within the minority sector (figure 1B). Hispanic-owned banks posted the largest losses in 2008, 2009, and 2010, ranging between 2 percent and 3 percent of risk-weighted assets, while losses were about 1 percent of assets for black-owned banks, and between under a half of a percent and 1 percent for Asian-owned banks. Native American-owned banks had slight profits in 2008 and 2010. Yet (surviving) black-owned banks continued to post losses in every year after 2010. In contrast, (surviving) Hispanic- and Asian-owned banks reported positive earnings in each year between 2011 and 2016.
2. Mergers
Merger activity has also resulted in some notable differences in equity growth at minority-owned versus community banks, even as less than 5 percent of banks with assets under $10 billion were involved in a completed “business combination” in any given year between 2006 and 2016. First, the share of acquisitions was slightly lower among minority-owned banks, at 4 percent or less per year. Further, about 30 percent of acquisitions from minority-owned banks were classified as government assisted between 2006 and 2016, compared to about 13 percent of acquisitions by non-minority community banks. Since mergers in the “Changes in Bank Equity” calculation are defined as the acquisition or absorption of one healthy insured institution by another, merger activity added nothing to the change in equity among minority banks between 2008 and 2010 (the slight gain in 2008 was offset by losses in 2009 and 2010). In contrast, mergers were responsible for 32 percent of the change in equity at community banks during these years. Even when “healthy” minority banks were acquired, much of the contribution to equity went towards banks in the non-minority sector (figure 2). Of the minority banks that closed (and did not receive FDIC assistance) and were acquired between 2006 and 2016, just over half (54 percent) were acquired by another minority-owned institution.10
Figure 2. Share of minority bank acquisitions by other minority-owned banks

3. Transfers from parent entities
Transfers from parent holding companies have been another major source of new equity for both community and minority-owned banks, particularly for the latter during the last recession. Parent transfers take place when a holding company transfers capital to a subsidiary bank, including proceeds from the sale of stock or debt from that holding company. The text responses listed in call reports explain these transfers in terms such as “capital infusion,” “capital injection,” and, during the financial crisis, as “investment of TARP funds into bank.”11 Transfers from parents made up about 32 percent of the total equity raised by banks with assets under $10 billion between 2006 and 2016, and more than 40 percent of equity raised by minority-owned banks.12 During the recession years of 2008 and 2009, more than $33 billion was transferred from holding companies to (non-minority) community banks, and more than $3 billion was transferred to MDI subsidiaries. Put differently, community banks would have had about $1.2 million less in capital (on average per bank), and minority banks about $9 million less (on average per bank), had it not been for transfers from parent holding companies.
Given the importance of parent holding companies in capital-raising efforts, an analysis of institutions at the holding company level would seem to offer a better vantage point from which to understand the nature of these contributions. Holding company reports include a field labeled “advances to subsidiaries,” which captures the amount of investments in and advances to subsidiaries during the reporting period.13 In 2009, during the financial crisis, about 10 percent of holding companies with assets under $10 billion reported investments and advances to subsidiaries, the highest share of institutions that did so between 2006 and 2016 (figure 3). Among minority-owned depositories, the share of holding companies that reported payments to subsidiaries also peaked in 2009 at 20 percent, and then spiked again in 2014 at 11 percent of banks.
Figure 3. Percent of holding companies that made payments for investments in and advances to subsidiaries

Analyses of parent-level reports face limitations, however, insofar as sector-wide reports do not include information for thrift holding companies prior to 2012. Thus many (formerly-OTS-regulated) parent companies that made investments in their thrift subsidiaries prior to and during the financial crisis are not visible in the FR Y-9C (see footnote 14). Instead, to supplement bank- and holding-company level reports of parent transfers, we compare money received from government recapitalization programs during the financial crisis, as well as capital market transactions available through SNL Financial, at community and minority-owned institutions.
3a. Parent transfers of TARP and SBLF funds
In October 2008, the Treasury created the Capital Purchase Program (CPP) under TARP to provide Tier 1 capital to banks. TARP was channeled to the holding companies of institutions that could demonstrate overall financial strength and long-term viability,14 but many of those that received funds indicated their intention to downstream the money to their subsidiary depository institutions.15 For institutions that participated in the CPP, Treasury received an ownership interest in the form of nonvoting senior preferred shares, and in return, issued funds that qualified as a component of Tier 1 capital.
In all, 626 non-minority community banks and/or affiliated holding companies (where the assets of the bank were less than $10 billion) received CPP, summing to about $16 billion (table 3). This was about 8 percent of all banks with assets under $10 billion in 2009 (based on matching each holding company with one bank subsidiary). A total of 39 minority-owned banks/holding companies received $2.2 billion in TARP, which was 19 percent of all minority-owned banks. This included more than 30 percent of black-owned banks and more than 20 percent of Asian-owned banks, although more than half of the TARP disbursement to minority-owned institutions went to three Hispanic-owned banks (figure 4).
Table 3. TARP participation

Figure 4. TARP disbursement

Some TARP recipients had the opportunity to improve payback terms by switching into the Treasury’s Community Development Capital Initiative (CDCI) Program in February 2010.16 Thirty percent of minority banks exchanged their CPP funds for lower-cost CDCI funds, compared to just 5 percent of community banks. (Thus, 27 minority-owned banks that received the CPP TARP money did not exchange it for CDCI.) The minority-owned institutions received a total of $108 million in CDCI funds, about a quarter of the combined equity capital of the minority bank CDCI recipients. In all, TARP infusions summed to 123 percent of the total change in bank equity at minority-owned institutions between 2008 and 2010. By comparison, TARP money amounted to 43 percent of the total change in equity at non-minority community banks between 2008 and 2010. As an aside, no minority-owned banks that received CPP capital also participated in the Small Business Lending Fund.17 Just two (non-TARP receiving) minority-owned institutions participated in the program, compared to 278 community banks.
3b. Parent transfers of subordinated debt
Another source of capital downstreamed via parent transfers from holding companies was “debt securities subordinated to deposits,” a.k.a. subordinated debt. Traditionally, subordinated debt has enabled banks to increase regulatory capital while preserving ownership interests. On bank balance sheets, the debt appears as surplus in the capital account and counts as a component of Tier I capital.18
A small number of institutions received TARP funds by way of subordinated debt, including two minority-owned institutions (a combined $14.9 million) and 55 community banking institutions. Much more prevalent was subordinated debt sold to private buyers. Trust Preferred Securities (TruPS), a type of subordinated debt, was widely used as a way to build Tier 1 capital at both community and minority-owned banks prior to the financial crisis.19 Although no new TruPS issuances were made after 2010, holding company reports show that about 20 percent of holding companies (with less than $10 billion in assets), and more than a third of minority-owned holding companies (whose information appears in the BHC dataset), made payments on outstanding TruPS between 2006 and 2016.20
Since 2011, the share of community bank institutions that issued subordinated debt has been smaller (we count 61 unique institutions in 2015), but the combined sale has exceeded $5 billion and has allowed some banks to pay back their TARP funds. In the most recent years of this analysis, improvements in earnings and credit quality at banks (holding companies) have enabled more institutions to participate in this type of capital-raising.21 Minority-owned institutions have been less active in the subordinated debt market than other community banks, however. Just two minority-owned banks issued subordinated debt in 2016, totaling $150 million. Nearly all new debt securities issuances made by minority-owned institutions over the 2006-2016 period were from Asian-owned institutions.
Table 4. Issuance of subordinated debt

4. Sale of capital stock
Finally, the “sale or purchase of capital stock” has been another important contributor to the change in equity, although a more complete understanding of this activity requires a consideration of stock sales at the holding company level as well. The sale or purchase of capital stock, as reported on the change in equity schedule, captures stock purchases/sales made directly by banks.22 Measuring just these flows, between 12 percent and 16 percent of community banks in any given year reported positive (>0) transactions in this line item, with these transactions contributing to 15 percent of the change in equity for non-minority community banks. For minority-owned institutions, the share of banks that reported positive transactions for “the sale or purchase of capital” was even higher, with stock transactions contributing to 22 percent of the change in equity over the period.
But given that stock sales took place by both banks and bank holding companies, we again supplement our analysis with data on capital market transactions to appreciate the extent to which the totality of stock sales contributed to the change in capital. Whether as “follow-ons,” IPOs, or private placements, common stock transactions totaled approximately $53 billion across non-minority community banking institutions between 2006 and 2016 (figure 5A). This was more than 20 percent of the overall change in equity for non-minority banks, with most (90+ percent) issued at the holding company level (and to the extent these proceeds were downstreamed, would have appeared as a parent transfer). The sale of (non-TARP) preferred shares totaled $7.7 billion between 2006 and 2016, and was also dominated by issuances from holding companies. Together, the sale of stock (as captured in SNL Financial) far exceeded the $16 billion that community banks received through the TARP program.
Figure 5a. Banks with assets under $10B: Common and preferred stock issuance ($000)

Common and preferred stock transactions by minority-owned banks and their holding companies were proportionately similar, equaling about 26 percent of the cumulative change in equity of minority banks between 2006 and 2016. But we also see some notable differences compared to other community banks. With issuances of $1.5 billion of common and $1.2 billion of (non-TARP) preferred stock by minority-owned institutions, total stock sales were much closer to the $2.2 billion TARP allocation for minority institutions (figure 5B). Likewise, minority-institution stock sales were almost evenly divided between common and preferred shares between 2006 and 2016, perhaps reflecting the fact that issuing common stock could dilute minority ownership. Further, a higher proportion of the common-stock transactions, 69 percent, were made via private placement, compared to 47 percent of common stock sales from non-minority banks.
Figure 5b. Minority-owned banks: Common and preferred stock issuance ($000)

In addition, stock-raising activities did not take place uniformly across the minority bank sector. Two-thirds of minority-bank common stock raises involved Asian-owned depositories, although these banks made up less than half of the minority-owned banks between 2006 and 2016 (table 5). Black-owned institutions overrepresented in common and preferred stock sales in terms of numbers of institutions (these banks made up 19 percent of the sector between 2006 and 2016), but black-owned banks raised proportionately less private capital in terms of the dollar amounts. It was for black-owned and Hispanic-owned banks that TARP made up the largest share of their external capital raises (table 6).
Table 5. Share of banks raising external capital

Table 6. Type of external capital raised (share of total)

Summary and implications
This analysis finds various differences in the ways in which minority-owned institutions and their non-minority counterparts built their capital following the financial crisis and 2008 recession. Minority-owned institutions, as a group, experienced larger losses during and after the financial crisis, requiring these entities to rely more on external methods to bolster capital compared to community banks and their holding companies. For community banks, parent transfers made up 32 percent of the change in equity between 2006 and 2016, capital sales made up 15 percent, acquisitions (mergers) made up 30 percent, and retained earnings (net income minus dividends) made up 22 percent. For minority banks, parent transfers made up 42 percent of the dollar value of the change in equity, capital sales made up 22 percent, and retained earnings made up 13 percent. Indeed, of the 117 minority-owned banks that operated continuously from 2006 to 2016, only about 20 percent never raised capital through stock sales or transfers from parent holding companies. The same could be said for far more – 45 percent – of non-minority community banks that operated continuously throughout the period.
Further analysis shows variation in capital-raising within the minority banking sector. Retained earnings at Asian-owned banks contributed to an even larger share of new equity than for community banks more generally. At the same time Asian-owned banks were disproportionately represented in the sale of common stock (compared to their minority-owned peers). Profitability returned to Hispanic-owned banks in 2011, after large losses during the financial crisis, but these banks were minimally active in capital markets transactions. Black-owned banks as a group retained no income (i.e., net income minus dividends) in every year from 2007 to 2016, making them even more dependent on parent transfers (via TARP) and stock sales as a way to increase equity over the period. These differences within the minority bank sector may reflect other characteristics of these institutions (i.e. asset size, geographic location, etc.), and not be attributable to different ethnic ownership.
One take-away from this study relates to the heterogeneity of the minority-owned bank sector, a focus which has emerged in other recent research on MDIs,23 and therefore the idea that a single set of recommendations for raising capital is not likely to apply across different institutions. The proliferation of Asian-owned banks has reflected, in part, the emergence of new financial resources made available through the expansion of transnational connections. As Wei Li and co-authors note in their 2017 paper, some Asian-owned banks have benefited from capital investments by Chinese immigrants who arrived as part of a new wave from mainland China, and who began to join the boards of these institutions in the mid-2000s.24 Thus, some banks were able to raise millions of dollars after the financial crisis – as much as $60 million for a single institution – based on “community support for ethnic-focused banks.”25 Preferred Bank’s $77 million preferred private-placement stock sale, which was the only minority-bank stock issuance in 2010, took place even as the bank operated under a consent order.26
However, community-held resources have not always been sufficient for keeping community-focused banks in business. Broadway Bank of Los Angeles succeeded in raising capital during the financial crisis, but much of this came from a fellow minority-owned institution in the Los Angeles area, Nara Bank (now part of BBCN Bancorp), as well as from the nonprofit National Community Investment Fund.27 A handful of other black-owned institutions that received investment from community members, such as Capitol City Bank & Trust Company, that received more than $1 million from its board of directors in addition to large infusions from community leaders,28 and Covenant Bank that received more than $1 million from its CEO,29 were ultimately closed by the FDIC. Pan American Bank in California received investment from a coalition of other minority-owned institutions,30 but was subsequently sold to a non-minority bank.
These within-sector differences underscore another major take-away from this analysis: the importance of profitability in order to grow equity. This finding is admittedly definitional since positive earnings feed directly into the capital account. But profitability drives outcomes in the other major ‘equity change’ categories as well. Earnings projections (and future profitability) are important to prospective debtholders who want to know whether a bank has the cash flow to service its debt, particularly uncollateralized subordinated debt. Earnings similarly affect the ability to attract stock purchasers, as bank investors often base their buying decisions on expected changes to PE ratios. Thus, earnings, as well as stock liquidity, factor into the ability of minority-owned banks to attract new shareholders.
To be sure, high relative returns are not the only way for MDIs to attract investors. Some investors have been incentivized by CRA considerations, such as Goldman Sachs and Morgan Stanley that invested $55 million in Carver Bank (New York) in 2011; Goldman Sachs, JPMorgan Chase, Chicago-based Northern Trust, Citigroup, and others, which invested seed capital in Urban Partnership Bank; and Fulton Financial and Bryn Mawr Bank that invested in United Bank of Philadelphia.31 Another potential set of investors fall into the category of “impact investors” that have a mission to consider social as well as financial return. In addition, some (would-be) investors are looking to buy a majority share of these banks. This was the case at Illinois Service Federal in Chicago, which received an investment from the black-owned Groupe Nduom of Ghana in 2016.32 MDIs (or their shareholders) are often reluctant to seek out this latter option, however, since doing so means giving up control of the business and, in some cases, losing their identification as a minority-owned institution.
In 2018, the question of capital access may not be as pressing for community and minority-owned institutions as it was during and immediately following the 2008 recession. The FDIC’s quarterly report shows that at year-end 2017, 99.4 percent of all insured institutions met or exceeded the requirements for the highest regulatory capital category, as defined for Prompt Corrective Action purposes.33 Likewise, banks have been given a fair amount of runway to prepare for implementation of the final Basel III rules for Tier 1 common equity capital required by January 2019. But to the extent some minority-owned banks pursue a mission to serve underserved customers, and revenues and profits are below that of (non-mission) peers, the need to raise capital on short notice may never be far off. At the start of 2018, a higher percentage of minority-owned banks (compared to community banks generally) had yet to repay outstanding TARP funds,34 and a higher share of TARP disbursements to minority banks were classified as “losses.” For the six minority-owned banks that still owed CDCI money as of April 2018 (four of which were black-owned banks), rates are set to jump from 2 percent to 9 percent after 2018. Going forward, as minority-owned depositories look to raise capital, their challenge will be in aligning investor expectations with the missions of their institutions.
NOTES
1Conference of State Bank Supervisors, 2011, “Community Banks and Capital: Assessing a Community Bank’s Need and Access to Capital in the Face of Market and Regulatory Challenges,” December.
2See https://www.federalreserve.gov/newsevents/pressreleases/other20080618a.htm; https://www.fdic.gov/news/news/financial/2002/fil0234.html; and https://www.occ.treas.gov/topics/bank-management/minority-depository-institutions/index-minority-depository-institutions.html.
3Toussaint-Comeau, Maude, and Robin Newberger, 2017, “Minority-Owned Banks and Their Primary Local Market Areas,” Economic Perspectives, Federal Reserve Bank of Chicago, Vol. 41. No. 4.
4We do not count banks whose FDIC certification (identification) numbers are for banks in Guam and Puerto Rico.
5Robb, Alicia, and Robert Fairlie, 2010, “Disparities in Capital Access between Minority and Non-minority-owned Businesses: The Troubling Reality of Capital Limitations Faced by MBEs,” U.S. Department of Commerce, January.
6Robert Fairlie, Alicia Robb, and David T. Robinson, 2016, “Black and White: Access to Capital among Minority-Owned Startups,” SIEPR discussion paper, No. 17-03, Stanford Institute for Economic Policy Research, December.
7Lerner, Josh, and Bella Research Group, 2017, “Diversifying Investments: A study of ownership diversity in the asset management industry,” Executive Report, Knight Foundation, May, available at https://knightfoundation.org/press/releases/new-report-reveals-low-levels-of-diversity-in-asset-management-industry-despite-similar-investment-performance-at-women-and-minority-owned-firms.
8According to Federal Reserve supervision manuals, community banking organizations include state member banks, bank holding companies, and savings and loan holding companies with assets of $10 billion or less. (See https://www.federalreserve.gov/boarddocs/supmanual/supervision_cbem.htm.) The Federal Reserve System, the Office of the Comptroller of the Currency (OCC), and the FDIC each use different definitions to identify what constitutes a community bank. The OCC also defines community banks by asset size, with an asset cutoff of $1 billion. The FDIC has developed a functional definition of community banks, outlined in the 2012 FDIC Community Banking Study, that aggregates the assets of banks under a single holding company charter; excludes banks where more than 50 percent of assets are held in specialty charters like credit cards or industrial loan companies; and includes banks with certain minimum loan-to-deposit ratios and core deposit ratios.
9The calculation is equity balance at beginning of period + net income + sales or purchase of capital + mergers and absorptions + restatements for accounting or errors + transfers from parent – dividends + other comprehensive income. ‘Other comprehensive income’ captures unrealized gains and losses on available-for-sale securities, foreign currencies, and cash flow hedges. See https://www.ffiec.gov/pdf/FFIEC_forms/FFIEC031_FFIEC041_201803_i.pdf. In the years of this analysis, changes to “other comprehensive income” had a smaller effect (in the aggregate) on changes to equity capital because of the positive/negative swings from year to year.
10For more information on acquisition accounting at community banks, see “Chapter 6: Capital Formation at Community Banks” in the FDIC Community Banking Study (2012), available at https://www.fdic.gov/regulations/resources/cbi/report/cbsi-6.pdf.
11See Schedule RI-E (Explanations), TEXT4498, and TEXT4499, “Other transactions with parent holding company.”
12In 2014 and 2015, one minority institution reported large negative parent transfers in the form of dividend payments back to the parent company.
13The FR Y-9C Consolidated Report of Condition and Income contains consolidated financial data on U.S. bank holding companies. The FR Y-9C is completed on a quarterly basis. The top-tier holding company also submits a separate quarterly report known as the FR Y-9LP, prepared on an unconsolidated basis. The FR Y-9C and the FR Y-9LP filing threshold (minimum required asset size) was increased from $150 million to $500 million in March 31, 2006, and then to $1 billion in June 2015. Holding companies with total consolidated assets of less than $1 billion file the Parent Company Only Financial Statements for Small Holding Companies (FR Y-9SP). This report is filed semiannually as of the last calendar day of June and December. See Dafna Avraham, Patricia Selvaggi, and James Vickery, “A Structural View of U.S. Bank Holding Companies,” FRBNY Economic Policy Review, July 2012.
14United States Government Accountability Office, 2008, “Troubled Asset Relief Program: Additional Actions Needed to Better Ensure Integrity, Accountability, and Transparency,” December, available at https://www.gao.gov/new.items/d09161.pdf.
15Bank holding companies reported receipt of TARP CPP on FR Y-9C Schedule HC-M, item 24.a, “Issuances associated with the U.S. Department of Treasury Capital Purchase Program: Senior perpetual preferred stock or similar items,” in line item BHCKG234 and BHCKG235. For the FR Y-9SP small bank holding companies, TARP CCP appears in Schedule SC-M, in line item BHSPG234 and BHSPG235. CDCI appears in line item BHSP 3283. On bank-level financial statements, TARP funds that are downstreamed from parents appear in “Additional Tier 1 capital instruments plus related surplus” on Schedule RC (item #23), where banks report the portion of noncumulative perpetual preferred stock and related surplus, and any other capital instrument and related surplus that satisfy all the eligibility criteria for additional Tier 1 capital instruments in section 20(c) of the regulatory capital rules of the institution’s primary federal supervisor. Of note, though, the TARP portion of this account is not identified as such.
16The CDCI program enabled the Treasury Department to invest lower-cost capital into mission-driven community development financial institutions (CDFIs). The terms of the CDCI program included a 2 percent dividend payment on preferred shares for the first eight years and a 9 percent dividend payment thereafter. An eligible community development institution would have been a bank, thrift, or credit union certified by the Treasury as targeting more than 60 percent of its small business lending and other economic development activities toward underserved communities. The total investment amount for the CDCI was approximately $570 million for 84 institutions. Funding was completed in September 2010 and included CDFI-certified credit unions. (See https://www.treasury.gov/initiatives/financial-stability/TARP-Programs/bank-investment-programs/cdci/Pages/status.aspx.).
17The SBLF was another government program created in 2010 from which the Treasury could make capital investments in qualified banks and community development loan funds to increase the availability of credit for small business. An institution was not eligible for the SBLF program if it was on the FDIC’s problem bank list (or similar list) or had been removed from that list in the previous 90 days. Generally, this included any bank with a composite CAMELS rating of 4 or 5. (See Overview of the Small Business Lending Fund at https://www.treasury.gov/resource-center/sb-programs/Documents/SBLF_Fact_Sheet_Final.pdf).
18Bybel, Nicholas, Jr., G. Philip Rutledge, and Mark Worley, 2009, “Capital-Raising Strategies for Community Banks,” Bybel Rutledge LLP. Subordinated debt issued directly from a bank (subsidiary) is counted in the bank’s Tier 2 capital.
19In 1996, the Federal Reserve approved the inclusion of minority interest in the form of trust preferred securities in a bank holding company’s Tier 1 capital (Conference of State Bank Supervisors). Trust Preferred Securities work by a bank holding company creating a separate trust, having that trust issue preferred stock to investors, then having the holding company take in all of the proceeds from the issuance of those preferred shares, and in turn issuing subordinated debt to the trust that has the same terms as the trust’s preferred stock.
20TruPs payments can been seen on Consolidated Financial Statements for Holding Companies (FR Y-9C) on Schedule HC, in PC-B Memoranda, “Notes payable to special purpose subsidiaries that issued trust preferred securities” (BHCPC255 or BHSPC255). Under Section 171 of the Dodd Frank Act, depository institution holding companies with less than $15 billion in consolidated assets as of December 2009, or organized in mutual form as of May 2010, are exempt from phase-out of TruPS from Tier 1 capital. These, and cumulative perpetual preferred stock, are now grandfathered in Tier 1 capital (consistent with being limited to 25 percent of Tier 1 capital elements). See Board of Governors of the Federal Reserve System, Federal Deposit Insurance Corporation, Office of the Comptroller of the Currency, “New Capital Rule Community Bank Guide,” July 2013. See https://www.fdic.gov/regulations/examinations/supervisory/insights/siwin10/trust.html.
21See “Capital Raising in 2016: Subordinated Debt on the Rise,” Wisconsin Banker, March 2016, available at http://www.ambfg.com/wp-content/uploads/2016/03/Capital-Raising-in-2016_WIBanker32016.pdf; and Andrew J. Fitzgerald, 2015 “Banks Increasingly Use Sub Debt to Raise Capital,” BankDirector.com, October 19, available at http://www.bankdirector.com/issues/analyst-forum/banks-increasingly-use-sub-debt-to-raise-capital.
22This line-item includes the sale of the institution's perpetual preferred stock or common stock; exercise of stock options, conversion of convertible debt, limited life preferred stock, or perpetual preferred stock into common stock or perpetual preferred; redemption and retirement of perpetual preferred stock or common stock; and capital related transactions involving the institution's employee stock ownership plan.
23Kashian, Russell D., Fernanda Contreras, and Claudia Perez-Valdez, “The Changing Face of Communities Served by Minority Depository Institutions: 2001-2015,” working paper draft, posted on Partnership for Progress website and available at https://www.communitybanking.org/~/media/files/communitybanking/2016/session1_paper4_kashian.pdf; and Li, Wei, Lucia Lo, and Eva Zhang, “Minority Depository Institutions at the Dawn of the 21st Century,” working paper, available at https://www.fedpartnership.gov/federal-reserve-resources.
24Li, Wei, Lucia Lo, and Jinwen Xu, 2017, “U.S. Minority Depository Institutions at the Dawn of the Twenty-First Century,” Papers in Applied Geography, Vol. 3 - Issue 3-4: Races, Ethnicity, and Places, Published online: 10 August, available at https://www.fedpartnership.gov/federal-reserve-resources.
25Witkowski, Rachel, 2010, “Local Investors Bolster Asian-American Banks,” American Banker, July 1, available at https://www.americanbanker.com/news/local-investors-bolster-asian-american-banks.
26Witkowski, Rachel, 2010, “Local Investors Bolster Asian-American Banks,” American Banker, July 1, available at https://www.americanbanker.com/news/local-investors-bolster-asian-american-banks.
27White, Ronald D., 2015, “Broadway Financial banks on customers in underserved areas of L.A.", Los Angeles Times, February 8, available at http://www.latimes.com/business/la-fi-stock-spotlight-broadway-20150209-story.html.
28WFXL Fox31 News Team, 2012, “SunTrust puts investment into Capitol City Bank,” from a press release issued by Capitol City Bank, May 15, available at http://wfxl.com/news/local/suntrust-puts-investment-into-capitol-city-bank.
29Lotus, Jean, 2013, “Forest Park Mall success led to Covenant Bank,” Forest Park Review, April 16, available at http://www.forestparkreview.com/News/Articles/4-16-2013/Forest-Park-Mall-success-led-to-Covenant-Bank.
30American Banker, July 23, 2014, Vol. 179, Issue 113, pp. 27-27. 1p.
31Mekeel, Tim, 2017, “Fulton Financial buys 19.9% of small Philadelphia bank with minority-community focus,” LancasterOnline, March 23, available at http://lancasteronline.com/business/local_business/fulton-financial-buys-of-small-philadelphia-bank-with-minority-community/article_fb1e304e-0fba-11e7-a931-97a91b055c8b.html.
32Yerak, Becky, 2016, “Black-owned bank to be overhauled by new investor,” June 20, available at http://www.chicagotribune.com/business/ct-black-owned-banks-illinois-0621-biz-20160620-story.html.
33FDIC Quarterly, available at https://www.fdic.gov/bank/analytical/quarterly/2017-vol114.html.
34Bailout Recipients compiled by ProPublica (http://projects.propublica.org/bailout/list/index).


