

Read our AgLetter Insights Q&A with author David Oppedahl for further insights into Seventh District farmland values and agricultural credit conditions described in this issue of AgLetter.
Summary
In the first quarter of 2024, the Seventh Federal Reserve District’s farmland values saw a 4 percent increase from a year ago—the smallest year-over-year gain in three and a half years. In addition, “good” farmland values in the District rose 2 percent from the fourth quarter of 2023 to the first quarter of 2024, according to the survey responses of 141 District agricultural bankers. Demand to purchase farmland was lower in the three- to six-month period ending with March 2024 than in the same period ending with March 2023. Plus, the amount of farmland for sale and the number of farms and the amount of acreage sold were down during the winter and early spring of 2024 compared with a year earlier. Annual cash rental rates for District farmland saw an increase of 2 percent in 2024—much slower growth than that of the previous three years. A sizable majority of responding bankers (76 percent) forecasted District farmland values to be stable during the second quarter of 2024, while 7 percent forecasted them to be higher and 17 percent forecasted them to be lower.
District agricultural credit conditions weakened a bit during the first quarter of 2024. Repayment rates for non-real-estate farm loans were lower in the January through March period of 2024 compared with a year ago, and the renewals and extensions of these loans were higher. In the first quarter of 2024, demand for non-real-estate loans relative to a year ago was up for the second consecutive quarter, while the availability of funds for agricultural lending was down from a year earlier once again. At 76.1 percent, the average loan-to-deposit ratio in the first quarter of 2024 was up considerably (2.1 percentage points) from the previous quarter. The amount of collateral required by banks across the District was somewhat higher than a year earlier. By the end of the first quarter of 2024, the District’s average nominal interest rates on farm operating, feeder cattle, and farm real estate loans had pulled back a little from near their highest levels since the second quarter of 2007. Yet, average real interest rates for all three types of farm loans kept rising in the first quarter of 2024, reaching their highest levels since the third quarter of 2009.
Farmland values
With their smallest year-over-year increase (4 percent) since the third quarter of 2020, District farmland values exhibited a continued deceleration in their growth in the first quarter of 2024. Agricultural land values increased 2 percent in the first quarter of this year from the fourth quarter of last year (see table and map below), matching their growth in the final quarter of 2023 from the third quarter. After being adjusted for inflation with the Personal Consumption Expenditures Price Index (PCEPI), the year-over-year gain in District farmland values for the first quarter of 2024 was just above 1 percent (the 16th consecutive quarter of real year-over-year growth).
Percent change in dollar value of “good” farmland
| January
1, 2024 to April 1, 2024 |
April
1, 2023 to April 1, 2024 |
|
|---|---|---|
| Illinois | +1 | +5 |
| Indiana | 0 | * |
| Iowa | +1 | 0 |
| Michigan | * | * |
| Wisconsin | +3 | +10 |
| Seventh District | +2 | +4 |
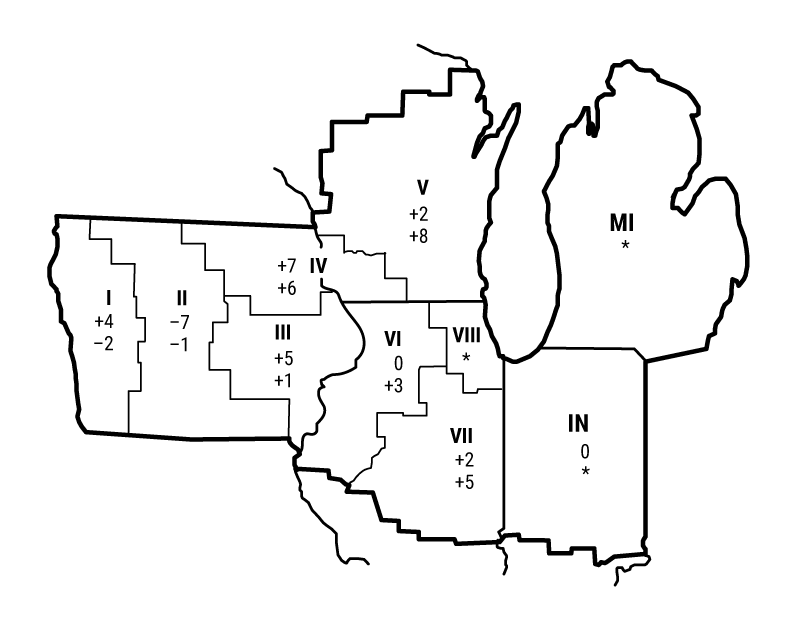
Top: January 1, 2024 to April 1, 2024
Bottom: April 1, 2023 to April 1, 2024
For the three- to six-month period ending with March 2024 relative to the same period ending with March 2023, 19 percent of the survey respondents reported higher demand to purchase farmland and 26 percent reported lower demand. Despite this ebbing demand for agricultural ground, a Wisconsin banker reported that “farmland prices continue to rise slightly, mostly due to lack of land for sale.” Indeed, there was a smaller amount of land for sale during the most recent winter and early spring compared with a year ago (14 percent of the responding bankers reported more farmland was up for sale in their areas and 42 percent reported less). Likewise, the number of farms and the amount of acreage sold were also down in the winter and early spring of 2024 relative to a year earlier. According to survey participants, the share of acres purchased by farmers in the three- to six-month period ending with March 2024 was down relative to that in the corresponding period ending with March 2023, implying that the share of acres purchased by investors was edging up in parts of the District.
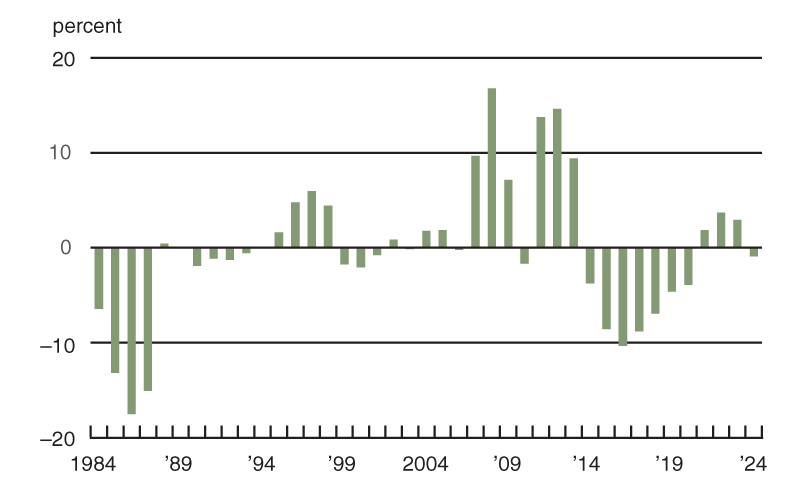
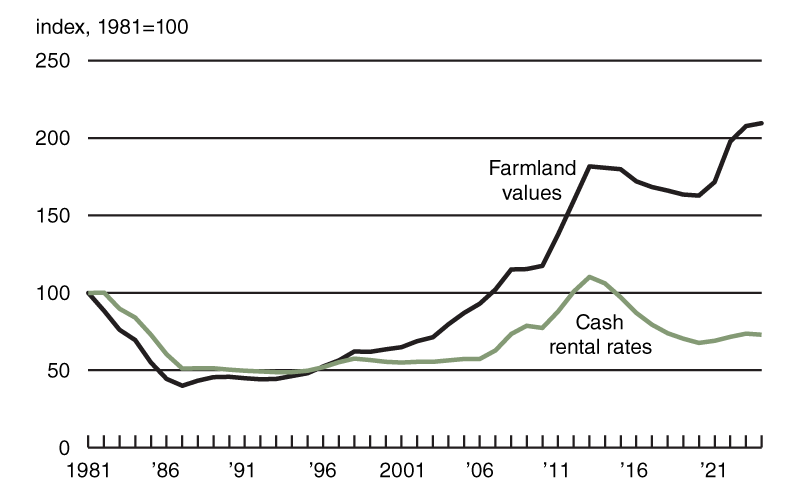
With cash rentals accounting for around 78 percent of District agricultural land operated by someone other than the owner, changes in their terms are a key indicator of agricultural conditions. Cash rental rates for District farm acres increased by 2 percent from 2023 to 2024, which was the fourth positive yearly change in a row. For 2024, average annual cash rents for farmland were unchanged in Illinois and were up 4 percent in Indiana, 1 percent in Iowa, and 6 percent in Wisconsin (not enough survey responses were received from bankers in Michigan to report a numerical change for that state). However, after being adjusted for inflation with the PCEPI, District cash rental rates were actually down 1 percent in 2024 from the previous year (see chart 1). This small annual decrease in real cash rents followed three consecutive annual increases. In real terms, the index of farmland cash rental rates had peaked in 2013 (see chart 2); after decreasing slightly in 2024, the index of real cash rental rates was 34 percent below its level in 2013. By contrast, after increasing somewhat in the first quarter of 2024, the index of real farmland values was 15 percent above its previous peak, which it had reached in 2013 and then surpassed in 2022 (again, see chart 2). The implication seems to be that relatively stronger demand to own farmland than to lease it has kept farmland values moving higher, despite the falling earnings potential of farmland (represented by cash rental rates).
1. Annual percentage change in Seventh District farmland cash rental rates adjusted by PCEPI
2. Indexes of Seventh District farmland adjusted by PCEPI
Sources: Author's calculations based on data from Federal Reserve Bank of Chicago surveys of farmland values; and U.S. Bureau of Economic Analysis, Personal Consumption Expenditures Price Index (PCEPI), from Haver Analytics.
Lagging cash rental rates could be emblematic of declining prices for farm products, which have spurred concerns about a fall in farm earnings from 2023’s above-average levels. According to data from the U.S. Department of Agriculture (USDA), prices received by farmers in March 2024 were down 5 percent from a year ago and prices for crops that month were down 16 percent from a year earlier (see final table). In contrast, prices for livestock and associated products in March 2024 were up 5 percent from a year ago. But notably, while cattle and hog prices did move higher relative to a year ago, dairy and egg prices floundered. An Illinois banker noted that “high interest rates and low commodity prices are taking away interested parties,” leading to fewer bidders at farm auctions.
Credit conditions
In the first quarter of 2024, agricultural credit conditions for the District showed some signs of weakening. As of April 1, 2024, the average nominal interest rates on operating loans (8.44 percent), feeder cattle loans (8.45 percent), and agricultural real estate loans (7.57 percent) were higher than their levels of a year ago, but they were slightly lower than in the previous two quarters. With that said, after being adjusted for inflation using the PCEPI, average interest rates on all three types of these farm loans were up again in the first quarter of 2024 and were last higher in the third quarter of 2009.
The index of repayment rates for non-real-estate farm loans (78) was down from a year ago for the second consecutive quarter; only 2 percent of responding bankers observed higher rates of repayment for the first quarter of 2024 relative to the first quarter of 2023, and 24 percent observed lower rates. Also, 26 percent of the survey respondents reported higher levels of loan renewals and extensions over the January through March period of 2024 compared with the same period last year, while just 1 percent reported lower levels of them. Furthermore, bankers reported 13 percent, on average, of their farm borrowers having more carryover debt (loans not paid off at the end of the growing season and subsequently carried over into the next one) in 2024 than in 2023. The share of loans guaranteed by the USDA’s Farm Service Agency (FSA) in the portfolios of the reporting banks across the District was nearly 7 percent.
At 136, the index of demand for non-real-estate farm loans indicated strong demand in the first quarter of 2024; for that quarter, 49 percent of the responding bankers noted higher loan demand compared with a year ago and 13 percent noted lower demand. The index of funds availability was 78; 4 percent of the survey respondents reported their banks had more funds available to lend than a year earlier, while 26 percent reported their banks had less. In line with these index readings, the District’s average loan-to-deposit ratio jumped up to 76.1 percent in the first quarter of 2024; this substantial increase was reflective of less working capital and the need for additional borrowing by farms. This latest level was nearly 4 percentage points below the average level desired by survey respondents.
Credit conditions at Seventh District agricultural banks
| Interest rates on farm loans | |||||||
| Loan demand | Funds availability | Loan repayment rates | Average loan-to-deposit ratio | Operating loansa |
Feeder cattlea |
Real estatea | |
|---|---|---|---|---|---|---|---|
| (index)b | (index)b | (index)b | (percent) | (percent) | (percent) | (percent) | |
| 2023 | |||||||
| Jan–Mar | 78 | 102 | 123 | 70.3 | 7.97 | 7.93 | 7.14 |
| Apr–June | 77 | 83 | 105 | 72.8 | 8.24 | 8.19 | 7.33 |
| July–Sept | 81 | 72 | 100 | 74.3 | 8.50 | 8.47 | 7.70 |
| Oct–Dec | 106 | 69 | 92 | 74.0 | 8.51 | 8.49 | 7.60 |
| 2024 | |||||||
| Jan–Mar | 136 | 78 | 78 | 76.1 | 8.44 | 8.45 | 7.57 |
Looking forward
According to an Iowa banker, “projections for 2024 show most farmers breaking even or going backwards in equity and working capital.” This view seemed widespread in the District, as survey respondents forecasted that the overall volume of farm non-real-estate loans would rise in the District during the April through June period of 2024 relative to the same period of 2023 (40 percent of the responding bankers expected a higher loan volume, while 10 percent expected a lower volume). In particular, operating, feeder cattle, and FSA-guaranteed loans were anticipated to have higher volumes relative to a year earlier. In contrast, surveyed bankers forecasted a decline in the District’s farm real estate loan volume in the second quarter of 2024 from a year earlier. Another Iowa banker stated that “with the lower grain prices, we can sense a little caution with spending on land and machinery.”
In the first quarter of 2024, 59 percent of survey respondents considered farmland to be overvalued, while just 1 percent considered it undervalued. Even so, responding bankers generally expected farmland values to be unchanged in the second quarter of 2024: 7 percent of these bankers forecasted agricultural land values to increase, 76 percent forecasted them to be stable, and 17 percent forecasted them to decrease. So, once again, the consensus among survey participants was for District farmland values to be steady in the next quarter.
Selected agricultural economic indicators
| Percent change from | |||||
|---|---|---|---|---|---|
| Latest period | Value | Prior period | Year ago | Two years ago | |
| Prices received by farmers (index, 2011=100) | March | 122 | 1.5 | –5 | –4 |
| Crops (index, 2011=100) | March | 100 | –1.2 | –16 | –17 |
| Corn ($ per bu.) | March | 4.36 | 0.0 | –35 | –34 |
| Hay ($ per ton) | March | 183.00 | –3.2 | –21 | –8 |
| Soybeans ($ per bu.) | March | 11.80 | –0.8 | –21 | –23 |
| Wheat ($ per bu.) | March | 6.01 | –5.5 | –28 | –39 |
| Livestock and products (index, 2011=100) | March | 145 | 2.3 | 5 | 8 |
| Barrows & gilts ($ per cwt.) | March | 62.70 | 6.8 | 2 | –16 |
| Steers & heifers ($ per cwt.) | March | 188.00 | 3.3 | 13 | 32 |
| Milk ($ per cwt.) | March | 20.70 | 0.5 | –1 | –19 |
| Eggs ($ per doz.) | March | 2.26 | –5.0 | –19 | 42 |
| Consumer prices (index, 1982–84=100) | March | 312 | 0.6 | 3 | 9 |
| Food | March | 328 | 0.1 | 2 | 11 |
| Production or stocks | |||||
| Corn stocks (mil. bu.) | March 1 | 8,347 | N.A. | 13 | 8 |
| Soybean stocks (mil. bu.) | March 1 | 1,845 | N.A. | 9 | –5 |
| Wheat stocks (mil. bu.) | March 1 | 1,087 | N.A. | 16 | 6 |
| Beef production (bil. lb.) | March | 2.11 | –2.7 | –12 | –16 |
| Pork production (bil. lb.) | March | 2.25 | –5.1 | –10 | –8 |
| Milk production (bil. lb.) | March | 19.6 | 7.7 | –1 | –1 |
| Agricultural exports ($ mil.) | February | 15,720 | 5.5 | 3 | 1 |
| Corn (mil. bu.) | February | 211 | 27.0 | 64 | –19 |
| Soybeans (mil. bu.) | February | 193 | –11.7 | –2 | 39 |
| Wheat (mil. bu.) | February | 68 | 27.4 | –1 | 0 |
| Farm machinery (units) | |||||
| Tractors, 40 HP or more | March | 6,619 | 26.4 | –4 | –13 |
| 40 to 100 HP | March | 4,333 | 25.3 | –7 | –20 |
| 100 HP or more | March | 2,286 | 28.5 | 1 | 5 |
| Combines | March | 389 | 7.2 | –23 | 12 |
SAVE THE DATE
The Federal Reserve Bank of Chicago will hold a conference about inputs to Midwest farming on December 3, 2024.
Additional information about this event will become available online in the
coming months.


