

Farmland values
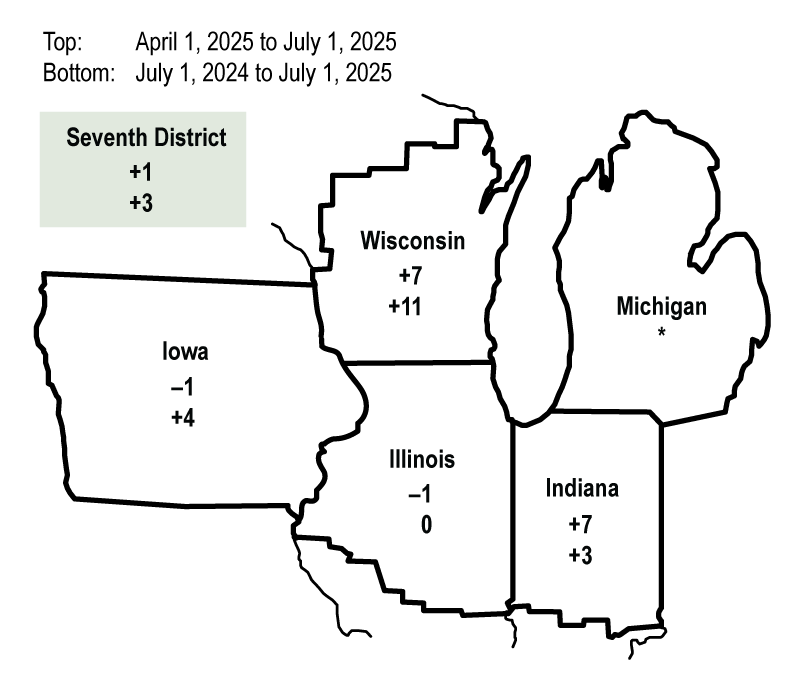
Farmland values for the Seventh Federal Reserve District rose 3% in the second quarter of 2025 from a year earlier, marking the largest year-over-year gain since the first quarter of 2024. Values for “good” agricultural land were 1% higher in the second quarter of 2025 relative to the first quarter, according to survey responses from 98 District agricultural bankers. Indiana, Iowa, and Wisconsin agricultural land values exhibited year-over-year increases of varying degrees; meanwhile, Illinois farmland values were unchanged on a year-over-year basis (see figure 1). In real terms (after being adjusted for inflation with the Personal Consumption Expenditures Price Index, or PCEPI), there was a year-over-year increase of 1% in District agricultural land values. This was the first positive year-over-year change in real farmland values for the District since the first quarter of 2024. Indiana and Wisconsin bankers cited real estate development as contributing to higher farmland values. For Indiana, there was also mention of investment activity, including solar and wind projects, factoring into rising agricultural land values.
1. Percent change in dollar value of “good” farmland
Credit conditions
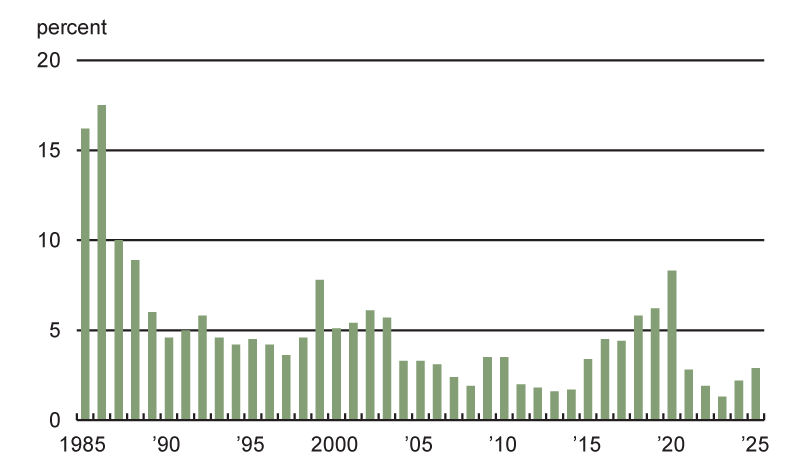
Agricultural credit conditions for the District were slightly weaker in the second quarter of 2025 than a year ago. The share of farm loans with “major” or “severe” repayment problems in the District’s agricultural loan portfolio (as measured in the second quarter of every year) was 2.9% in 2025, up from last year’s level of 2.2% and the highest reading since 2020 (see figure 2). Furthermore, the share of farm loans with “no” repayment problems declined to 90.1% from 91.6% a year ago. Also, repayment rates for non-real-estate farm loans were lower in the second quarter of 2025 compared with a year ago, and renewals and extensions of such loans were higher (see figure 3). The breakdown of the index numbers follows:
- The index of demand for non-real-estate farm loans was 121 for the second quarter of 2025; 40% of survey respondents observed higher loan demand compared with a year ago, while 19% observed lower demand.
- The index of funds availability stood at 90 for the second quarter of 2025; 8% of survey respondents noted that their banks had more funds available to lend than a year ago, while 18% noted they had less.
- The index of loan repayment rates for non-real-estate agricultural loans in the second quarter of 2025 was 71; only 2% of responding bankers noted higher rates of loan repayment than a year ago, while 31% noted lower rates.
- The index of loan renewals and extensions of non-real-estate farm loans was 135 in the second quarter of 2025; 35% of survey respondents reported more of them than a year earlier, while no respondents reported fewer.
The District’s average loan-to-deposit ratio rose to 78.1% in the second quarter of 2025—the highest reading since the first quarter of 2020 and over 3 percentage points below the average level desired by the responding bankers. The amount of collateral required by banks across the District was higher than a year ago. Over the first half of 2025, District banks made more farm operating loans and fewer farm mortgages than normal, according to responding bankers. Over the same time period, bankers reported that Farm Credit System lenders, as well as merchants, dealers, and other input suppliers, lent more funds to the agricultural sector than normal, while life insurance companies lent less.
Average nominal interest rates on farm operating, feeder cattle, and farm real estate loans were down a little during the second quarter of 2025 from the first quarter. As of July 1, 2025, the District’s average nominal interest rates on new operating loans (7.63%), feeder cattle loans (7.69%), and farm real estate loans (7.02%) were at their lowest levels since the fourth quarter of 2022. In real terms (after being adjusted for inflation with the PCEPI), the average interest rates on operating loans, loans for feeder cattle, and loans for farm real estate were up slightly from the first quarter of 2025 (their first increases after three consecutive quarters of declines).
2. Percentage of Seventh District farm loan portfolio with “major” or “severe” repayment problems
3. Credit conditions at Seventh District agricultural banks
| Latest period | Prior period | Year ago | |
|---|---|---|---|
| 2025:Q2 | 2025:Q1 | 2024:Q2 | |
| Indexesa | |||
| Loan demand | 121 | 143 | 104 |
| Funds availability | 90 | 94 | 74 |
| Loan repayment rates | 71 | 61 | 85 |
| Loan renewals and extensions | 135 | 133 | 123 |
| Average loan-to-deposit ratiob | 78.1 | 76.9 | 76.9 |
| Interest rates on farm loansc | |||
| Operating loans | 7.63 | 7.73 | 8.47 |
| Feeder cattle loans | 7.69 | 7.76 | 8.44 |
| Real estate loans | 7.02 | 7.09 | 7.55 |
Looking forward
Looking ahead to the third quarter of 2025, only 4% of the responding bankers anticipated farmland values to rise, while 78% anticipated them to be stable and 17% anticipated them to fall (the shares do not add up to 100% because of rounding). A majority of survey respondents were of the view that District farmland was overvalued (not a single respondent was of the view that it was undervalued).
Survey respondents expected higher volumes for non-real-estate agricultural loans (primarily for operating loans, feeder cattle loans, and loans guaranteed by the Farm Service Agency) in the third quarter of 2025 compared with year-earlier levels. Farm machinery, grain storage construction, and farm real estate loan volumes were expected to shrink below the levels seen in the third quarter of 2024. According to an Iowa respondent, “If the commodity market doesn't significantly improve, our farmers in this area are going to have a tough time making any profit for the second year in a row.” This view reflected the broad consensus of the responding agricultural bankers regarding the challenges facing corn and soybean operations, though livestock operations seemed to be in overall better shape.
Midwest Agriculture and Trade Uncertainty
On September 30, 2025, the Federal Reserve Bank of Chicago will hold a hybrid event to explore interrelationships between Midwest farming and agricultural trade. Registration for the annual Midwest Agriculture Conference is available online.


