Read our AgLetter Insights Q&A with author David Oppedahl next week for further insights into Seventh District farmland values and agricultural credit conditions described in this issue of AgLetter.
Farmland values
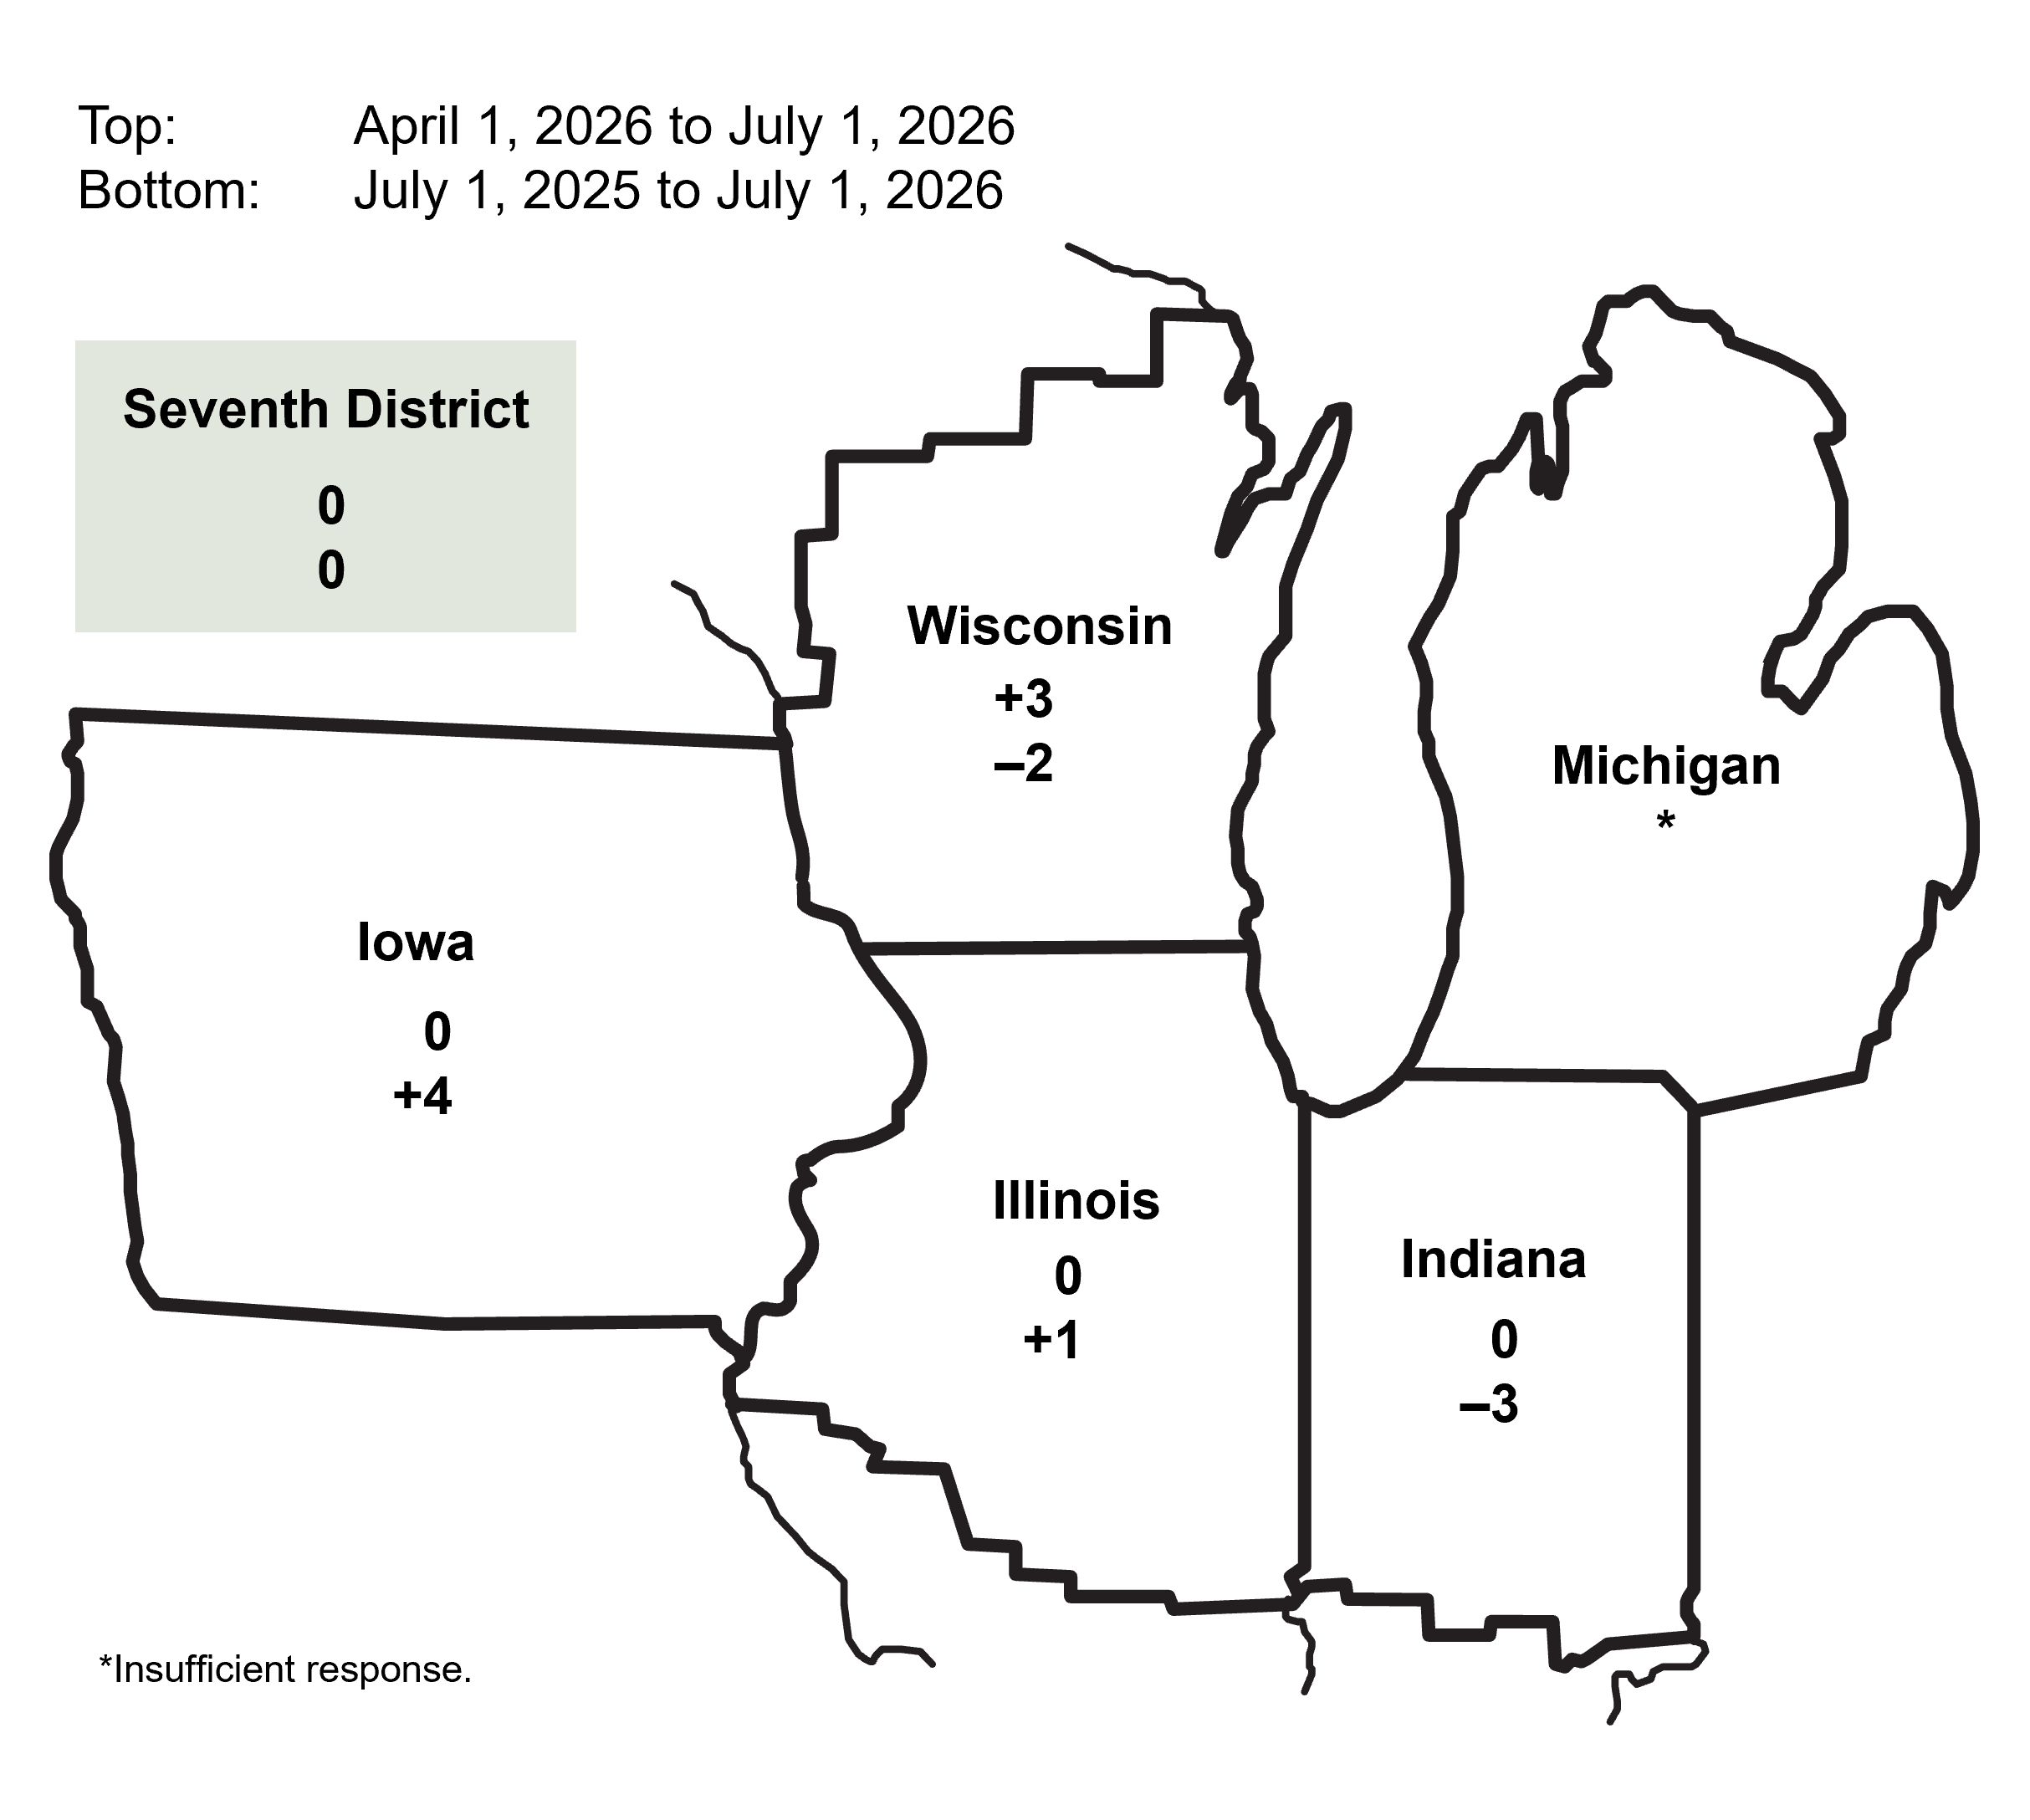
Farmland values for the Seventh Federal Reserve District were flat in the second quarter of 2026 from a year earlier, their slowest year-over-year growth since the fourth quarter of 2024. Values for “good” agricultural land also showed no change in the second quarter of 2026 relative to the first quarter, according to survey responses from 79 District agricultural lenders. Illinois and Iowa farmland values experienced year-over-year increases, whereas Indiana and Wisconsin farmland values experienced year-over-year decreases (see figure 1). In real terms (after being adjusted for inflation with the Personal Consumption Expenditures Price Index, or PCEPI), there was a year-over-year decrease of 3.7% in District agricultural land values. This was the largest year-over-year decline in real farmland values for the District since the third quarter of 2016. Several lenders commented that investment activity for data centers and solar and wind farms helped hold up agricultural land values.
1. Percent change in dollar value of “good” farmland
Credit conditions
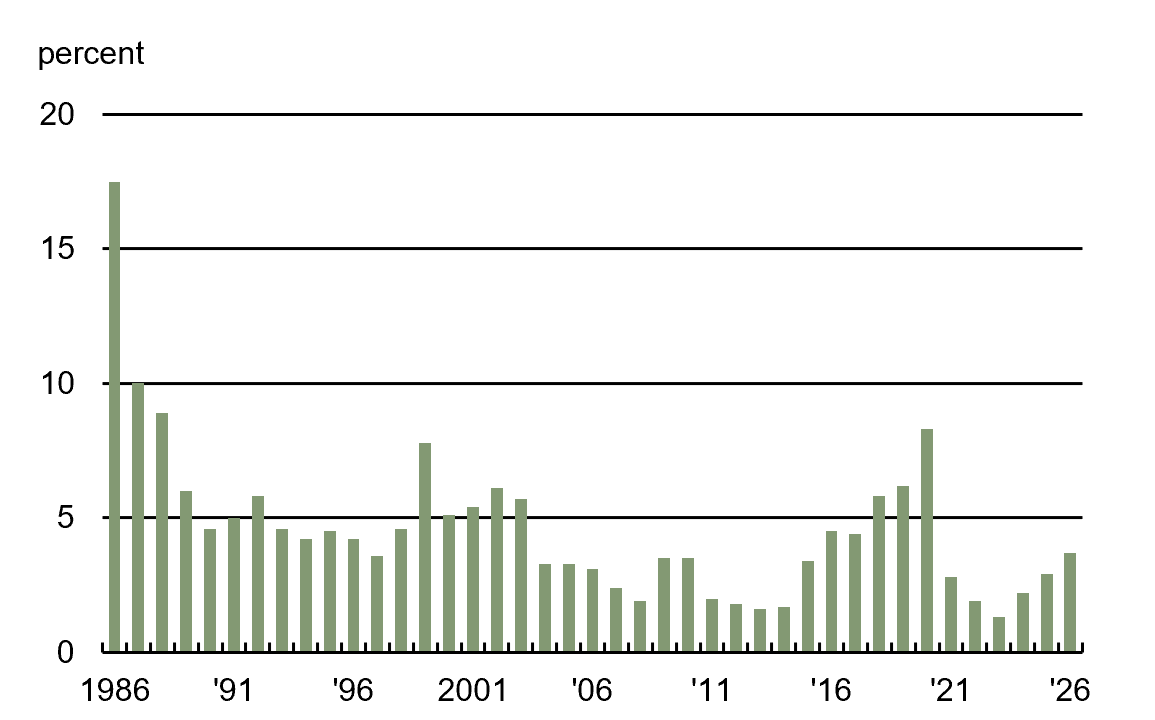
Agricultural credit conditions for the District were weaker in the second quarter of 2026 compared with a year ago. An Iowa respondent said, “Commodity price volatility and elevated production expenses are the factors weighing most heavily on credit conditions.” The share of farm loans with “major” or “severe” repayment problems in the District’s agricultural bank loan portfolio (as measured in the second quarter of every year) was 3.7% in 2026, up from last year’s level of 2.9% and the highest reading since 2020 (see figure 2). Furthermore, the share of farm loans with “no” repayment problems declined to 88.5% from 90.1% a year earlier. In addition, repayment rates for non-real-estate farm loans were lower in the second quarter of 2026 compared with a year ago, and renewals and extensions of such loans were higher (see figure 3). The breakdown of the index numbers for the second quarter of 2026 follows:
- The index of demand for non-real-estate farm loans was 111 for the second quarter of 2026; 30% of survey respondents observed higher loan demand compared with a year ago, while 19% observed lower demand.
- The index of funds availability remained at 90 for the second quarter of 2026; 4% of survey respondents noted that their financial institutions had more funds available to lend than a year ago, while 14% noted they had less.
- The index of loan repayment rates for non-real-estate agricultural loans was 73 in the second quarter of 2026; no responding lenders noted higher rates of loan repayment than a year ago, while 27% noted lower rates.
- The index of loan renewals and extensions of non-real-estate farm loans was 124 in the second quarter of 2026; 27% of survey respondents reported more of them than a year earlier, while 3% of respondents reported fewer.
The District’s average loan-to-deposit ratio rose to 80.7% in the second quarter of 2026—the highest reading since collection of these data began in the 1970s yet still over 3 percentage points below the average level desired by the responding bankers. Even so, 63% of responding bankers said that deposits at their banks had risen over the past year, whereas 19% said that they had fallen. Over the first half of 2026, District banks made more farm operating loans and farm mortgages than normal, according to responding lenders. Over the same time period, lenders reported that Farm Credit System institutions, as well as merchants, dealers, and other input suppliers, lent more funds to the agricultural sector than normal, while life insurance companies lent less. The amount of collateral required by lenders across the District was higher than a year ago.
Average nominal interest rates on farm operating (7.12%), feeder cattle (7.14%), and farm real estate loans (6.79%) were up a little during the second quarter of 2026 from the first quarter. In real terms (after being adjusted for inflation with the PCEPI), the average interest rates on operating loans, loans for feeder cattle, and loans for farm real estate were down from the first quarter of 2026 (the fourth consecutive quarter with declines for all three).
2. Percentage of Seventh District farm bank loan portfolio with “major” or “severe” repayment problems
3. Credit conditions at Seventh District agricultural lending institutions
| Latest period | Prior period | Year ago | |
|---|---|---|---|
| 2026:Q2 | 2026:Q1 | 2025:Q2 | |
| Indexesa | |||
| Loan demand | 111 | 141 | 121 |
| Funds availability | 90 | 90 | 90 |
| Loan repayment rates | 73 | 63 | 71 |
| Loan renewals and extensions | 124 | 136 | 135 |
| Average loan-to-deposit ratiob | 80.7 | 79.8 | 78.1 |
| Interest rates on farm loansc | |||
| Operating loans | 7.12 | 7.08 | 7.63 |
| Feeder cattle loans | 7.14 | 7.12 | 7.69 |
| Real estate loans | 6.79 | 6.74 | 7.02 |
Looking forward
Looking ahead to the third quarter of 2026, survey respondents expected higher volumes for non-real-estate agricultural loans (primarily for operating loans, feeder cattle loans, and loans guaranteed by the Farm Service Agency) compared with year-earlier levels. Farm machinery, grain storage construction, and farm real estate loan volumes were expected to shrink below the levels seen in the third quarter of 2025.
Only 5% of the responding lenders anticipated farmland values to rise in the third quarter of 2026, while 81% anticipated them to be stable and 14% anticipated them to fall. A large share of survey respondents (43%) perceived District agricultural land to be overvalued, though 57% of them viewed farmland as appropriately valued (not a single respondent reported it as undervalued). According to a Wisconsin lender, “At some point farmland values should plateau as outside pressure from solar and data centers subsides.”
Note: The published AgLetter results are based on survey responses from commercial banks and Farm Credit System institutions located in the Seventh Federal Reserve District. All survey results prior to the first quarter of 2026 reflect survey responses from commercial banks only.
Bumper Harvests, Big Questions: Where Do Midwest Crops Go?
On October 16, 2026, the Federal Reserve Bank of Chicago will hold a hybrid event focused on what farmers and those who purchase crops do with bumper harvests from midwestern fields. Additional information and registration for the annual Midwest Agriculture Conference are available online.