

Read our AgLetter Insights Q&A with author David Oppedahl for further insights into Seventh District farmland values and agricultural credit conditions described in this issue of AgLetter.
Farmland values
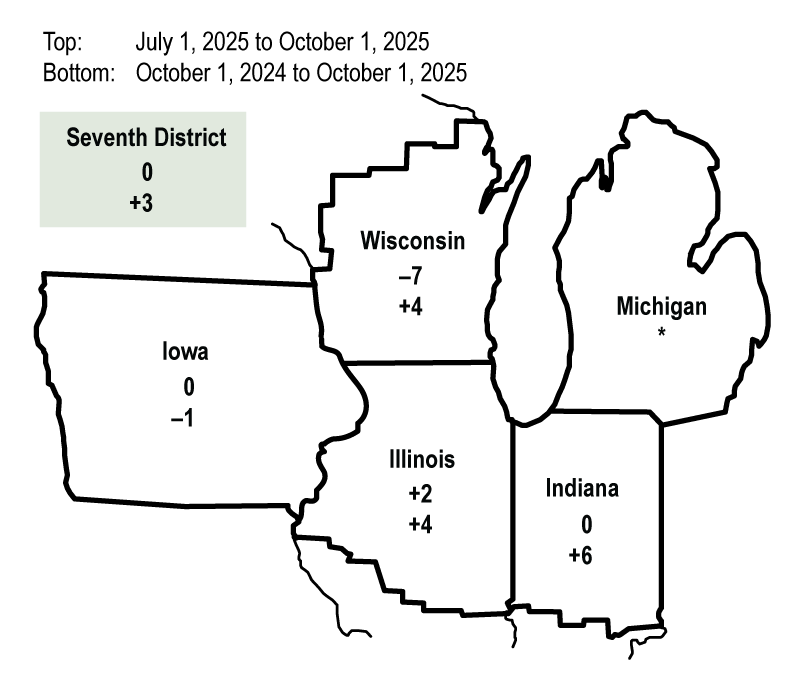
In the third quarter of 2025, the Seventh Federal Reserve District’s agricultural land values increased 3% from a year ago, matching their year-over-year gain of the previous quarter. Yet values for “good” farmland in the District overall were unchanged in the third quarter of 2025 from those in the second quarter, according to responses from 102 District agricultural bankers who completed the October 1 survey. Illinois, Indiana, and Wisconsin had year-over-year increases in farmland values, while Iowa was the only District state reporting a year-over-year decrease (see figure 1). A quarterly increase in Illinois farmland values was offset by a quarterly decrease in Wisconsin farmland values in the third quarter of 2025; Indiana and Iowa agricultural land values saw no changes from the second quarter of 2025.
1. Percent change in dollar value of “good” farmland
Credit conditions
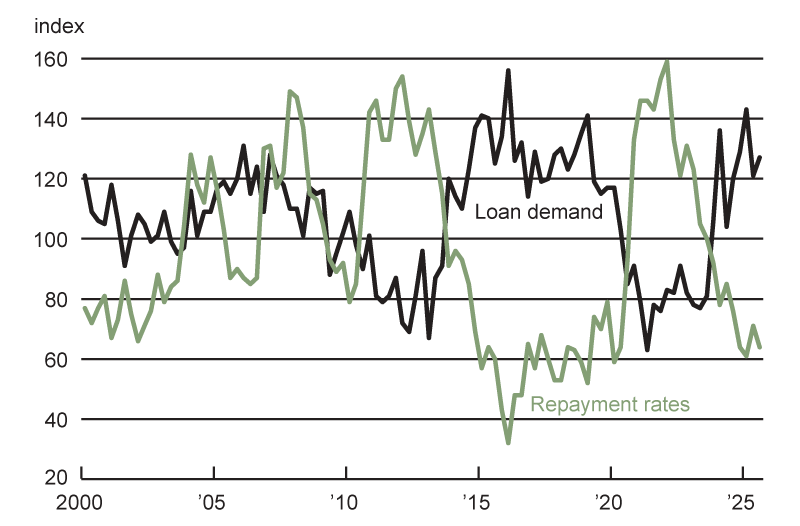
Agricultural credit conditions for the District softened further in the third quarter of 2025 (see figures 2 and 3). For the July through September period of 2025, repayment rates for non-real-estate farm loans were lower than a year earlier for the eighth quarter in a row. In addition, renewals and extensions of non-real-estate agricultural loans were higher than a year earlier for the ninth straight quarter. The District still saw stronger demand for non-real-estate farm loans in the third quarter of 2025 relative to a year ago; this was the eighth consecutive quarter of stronger demand. The availability of funds for lending by agricultural banks was lower than a year ago for the tenth quarter in a row.
The breakdown of the index numbers for the third quarter of 2025 follows:
- The index of demand for non-real-estate farm loans was 127; 39% of survey respondents observed higher loan demand compared with a year ago, while 12% observed lower demand.
- The index of funds availability stood at 90; 9% of survey respondents noted that their banks had more funds available to lend than a year ago, while 19% noted they had less.
- The index of loan repayment rates for non-real-estate agricultural loans was 64; only 2% of responding bankers noted higher rates of loan repayment than a year ago, while 38% noted lower rates.
- The index of loan renewals and extensions of non-real-estate farm loans was 134; 35% of survey respondents reported more of them than a year earlier, while just 1% reported fewer.
Collateral requirements for farm loans in the third quarter of 2025 rose from the same quarter of last year; 21% of the survey respondents reported that their banks required more collateral, while none reported that their banks required less.
The District’s average loan-to-deposit ratio declined to 76.9% in the third quarter of 2025. The gap between the average loan-to-deposit ratio and the average level desired by the responding bankers narrowed from a year ago to around 4 percentage points, with half of the survey respondents stating that their respective banks were below their targeted levels. Agricultural interest rates fell slightly during the third quarter of this year. As of October 1, 2025, the District’s average nominal interest rates on new operating loans (7.47%), feeder cattle loans (7.57%), and farm real estate loans (6.82%) were at their lowest levels since the end of 2022.
2. Loan demand and repayment rates for Seventh District non-real-estate farm loans
Source: Authors’ calculations based on data from Federal Reserve Bank of Chicago surveys of farmland values.
3. Credit conditions at Seventh District agricultural banks
| Latest period | Prior period | Year ago | |
|---|---|---|---|
| 2025:Q3 | 2025:Q2 | 2024:Q3 | |
| Indexesa | |||
| Loan demand | 127 | 121 | 120 |
| Funds availability | 90 | 90 | 92 |
| Loan repayment rates | 64 | 71 | 76 |
| Loan renewals and extensions | 134 | 135 | 128 |
| Average loan-to-deposit ratiob | 76.9 | 78.1 | 75.7 |
| Interest rates on farm loansc | |||
| Operating loans | 7.47 | 7.63 | 8.12 |
| Feeder cattle loans | 7.57 | 7.69 | 8.09 |
| Real estate loans | 6.82 | 7.02 | 7.19 |
Looking forward
For the final quarter of 2025, 29% of survey respondents expected District agricultural land values to decline (8% expected them to rise and 63% expected them to be stable). In line with these survey results, softer demand by agricultural producers for farmland will likely extend into 2026: 44% of survey respondents expected farmers to have weaker demand to acquire farmland this fall and winter compared with a year earlier, while 10% expected stronger demand. In contrast, 28% of survey respondents anticipated nonfarm investors to have stronger demand to purchase farmland over the same period, though 20% anticipated weaker demand from this market segment. Moreover, responding bankers narrowly projected an increase in the volume of agricultural land transfers during this fall and winter relative to a year ago. An Illinois banker suggested that 2025 losses could lead to “liquidation of farmland to inject additional working capital into farming operations.”
Net cash earnings (which include government payments) for crop farmers were expected to be lower over the next three to six months (i.e., during the fall and winter) than their levels of a year ago; just 3% of survey respondents forecasted them to be higher, while 92% forecasted them to be lower. Similarly, only 2% of survey respondents expected net cash earnings for dairy farmers to increase over the next three to six months relative to a year earlier, while 25% expected them to decrease. By contrast, 71% of responding bankers forecasted net cash earnings for cattle and hog farmers to increase over the next three to six months relative to a year ago, while 9% forecasted them to decrease.
Half the survey respondents anticipated a lower volume of farm loan repayments over the next three to six months relative to a year earlier (just 1% predicted a higher volume). Unsurprisingly, given the lower crop and dairy farm income expectations, forced sales or liquidations of farm assets owned by financially distressed farmers were expected to rise in the next three to six months relative to a year ago; 47% of the responding bankers projected them to increase, while only 3% projected them to decrease. Non-real-estate loan volumes were forecasted to be larger in the last three months of 2025 compared with the same three months of 2024. Farm real estate loan volumes were forecasted to be smaller in the final three months of 2025 compared with the same three months of a year earlier.


