Changing Banking Infrastructure: Access to Credit by Detroit’s Small Businesses
The story of distress in Detroit has been well-told from the riots of the 1960s through the near-collapse of the auto assemblers in 2008. The table below shows Detroit’s dramatic population loss since 1970, while both Michigan and the United States have had population increases almost every decade.
| Total population | 1970 | 1980 | 1990 | 2000 | 2010 |
|---|---|---|---|---|---|
| Detroit | 1,511,482 | 1,203,339 | 1,027,974 | 951,270 | 713,777 |
| Michigan | 8,875,083 | 9,262,078 | 9,295,297 | 9,938,444 | 9,883,640 |
| United States | 203,211,290 | 226,545,808 | 248,709,872 | 281,421,920 | 308,745,538 |
As Detroit tries to recover, and is the subject of much attention among researchers, policymakers, community economic development organizations and many other types of organizations, two Chicago Fed senior business economists, Robin Newberger and Maude Toussaint-Comeau are studying the role of access to credit by small businesses . Toussaint-Comeau presented part of their findings at a Federal Reserve Board of Governors Conference, “Small Business and Entrepreneurship during an Economic Recovery”, in November 2011. The goal of the conference was to provide a forum for a multidisciplinary dialogue among researchers, policymakers, and practitioners that focus on small business capital access and the role these firms play in job creation. Toussaint-Comeau explained that “small business access to credit is an important component of economic recovery, allowing for sustainable small business ownership, job creation, and neighborhood vitality.”
Newberger and Toussaint-Comeau’s Detroit case study focuses on the financial infrastructure in the city and compares it with those of three surrounding counties. For purposes of the study, the “financial infrastructure” is measured by the physical presence of bank branches as well as the level of credit activities to small businesses from banks. Blacks comprise 74% of the population in the low- and moderate- income (LMI) areas of Detroit versus only 8% in the non-LMI areas. By comparison, in the three surrounding counties, the percentage of Blacks in both LMI and non-LMI areas is only 4%. The LMI areas in Detroit also have a much higher percentage of occupied housing units without vehicles (21%) than the non-LMI areas (1%); and in the three surrounding counties, the percentages are 2% and 4%, respectively. This is consistent with the idea that LMI inner city residents are less mobile, which makes proximity to financial institutions much more relevant for these particular markets.
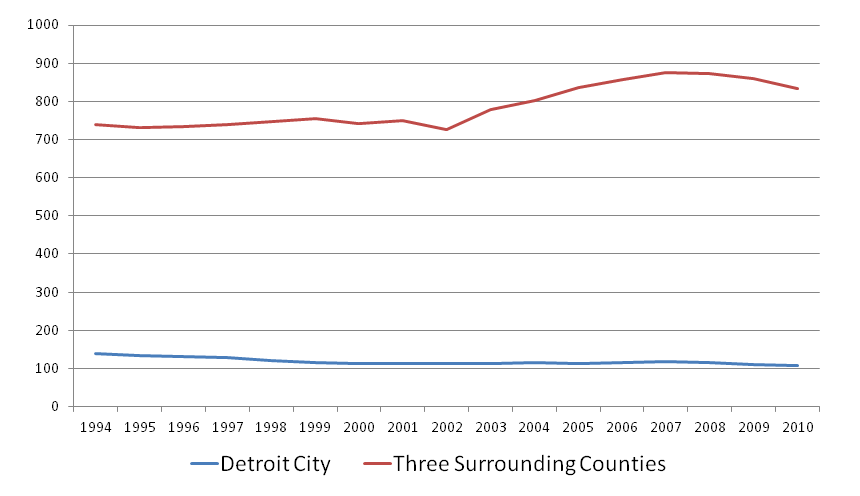
Perhaps the most basic finding is that the number of bank branches declined in Detroit (primarily in LMI areas), even as the number of bank offices increased outside the city (see chart below). This trend remains robust even after accounting for geographic area covered and population density.
1. Number of branches

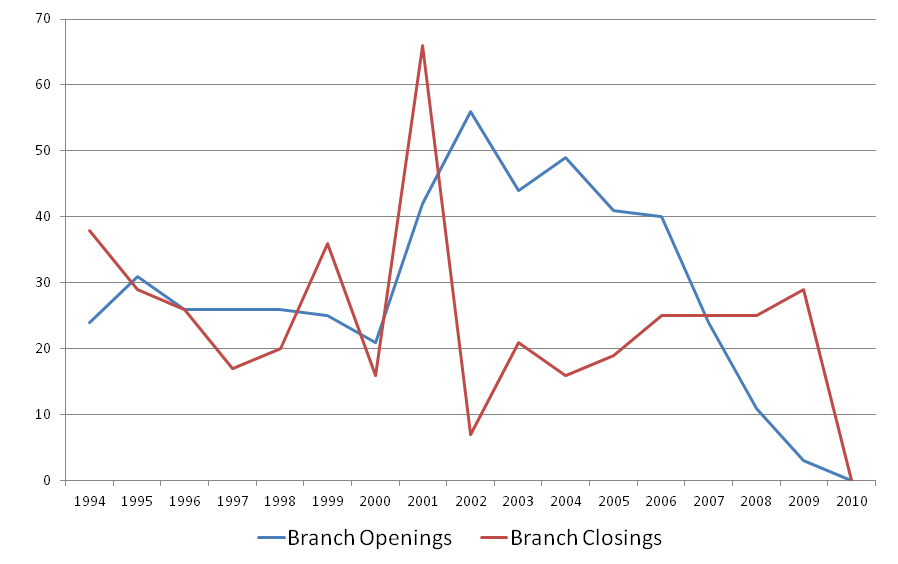
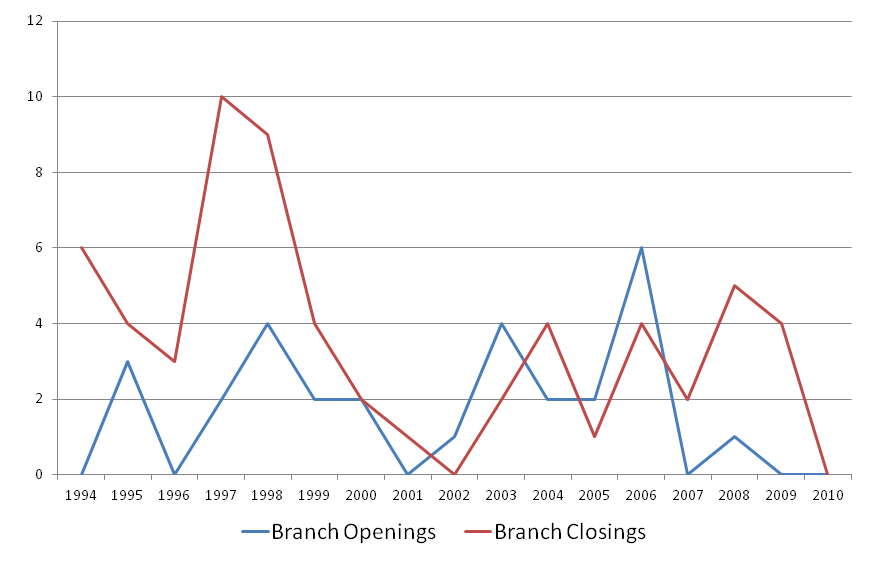
Additionally, the following two charts compare the opening and closing of branches outside of Detroit and in the city. We can see that in the three surrounding counties, the opening/closing axis ranges from 0 to 60, while in the city of Detroit the range is from 0 to 10. (The y-axis is scaled differently for the two areas). Over this period on average more banks closed than opened in the City of Detroit. By contrast, for the three surrounding counties there were more bank openings than closings over the same period. This holds true even as you control for geographic area covered and population density.
2. Three surrounding counties

3. Detroit city

In recent years, there have been a lot of efforts by foundations and private entities to promote small businesses in Detroit, and access to financial services for these businesses remains an important issue for the city.
In the coming months, we will have another blog on this topic as well as a Fed publication. In the meantime, readers may use these links to view Comeau's conference presentation and learn more about the conference.


