ICI Cities by the Numbers
Now that the interviews connected with our 10-city study are almost complete, the Community Development and Policy Studies Department (CDPS) is now focusing on the comparative data analysis aspect of the project. At a symposium on February 28, 2012, we will discuss more of the data from each city's case study factsheets. Meanwhile, this blog looks at changes in manufacturing and population, as well as data peaks and troughs. These data and the case study factsheets were derived from either the decennial census or a census-related source.1
We were careful to keep variable definitions and the subpopulations on which they are based consistent over time and between sources. Even so, please bear in mind that all figures (with the exception of the 2005–09 ACS estimates) represent snapshots rather than averages over a time period. In other words, differences between figures over time may reflect the timing of the measurement with respect to the business cycle in addition to the overall secular trend. Additionally, please use the ACS estimate data with caution as these figures represent estimates over a five-year period with potentially large margins of error. The data collected for the ICI project cover a wide range of topics, including population; age; race; educational attainment; industry, employment and income; household composition; and housing.
Manufacturing
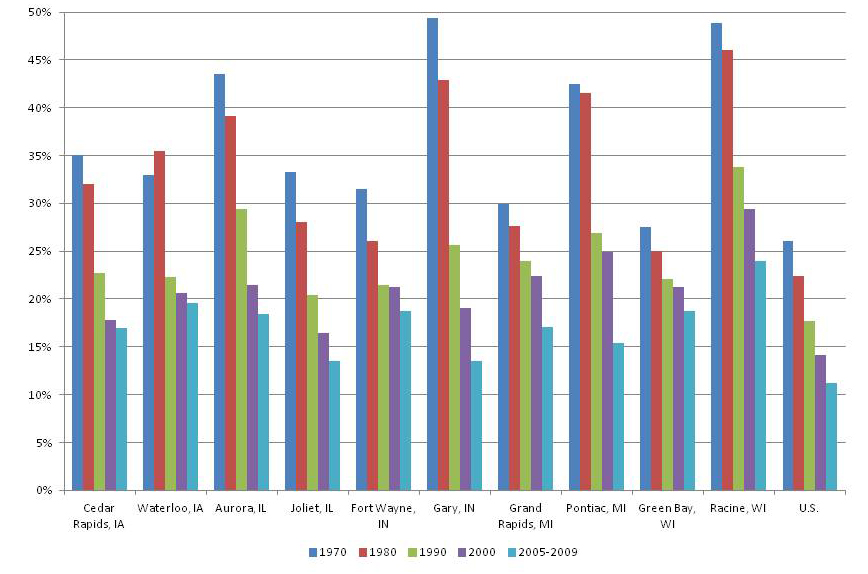
A main criterion for a city in the Seventh District to be selected for the Industrial Cities Initiative was that a substantial portion—i.e., at least 25% of the employed work force was employed in manufacturing as of 1960. Manufacturing jobs during the 1960s and early 1970s tended to be good jobs with generous benefits. Ten years later, these 10 cities were still bustling with employment in ranges well above the initial criteria, specifically, from 27.5% in Green Bay, WI, to 49.4% in Gary, IN.
This booming industry has since declined in each of the 10 cities selected and nationwide. As of the ACS estimates for 2005–09, only one of the cities, Racine, WI, has close to 25% of its work force employed in manufacturing (24.0%). Conversely, Gary, IN, had the smallest percentage of manufacturing employment at 13.5%. Below is a graphical representation of the percentage of manufacturing employment in each city and the U.S. since 1970. As we can see from the graph, the decade of the 1980s saw the largest drops in manufacturing employment. This begs the question as to whether manufacturing was displaced by other industries or whether the decline was driven by issues specific to manufacturing.
In the case of two cities: Pontiac, MI, and Gary, IN, both with large declines in manufacturing, we find that their overall population also decreased from 1970 to 2005–09. People left when the jobs left, which implies that no other industries took the place of manufacturing in these cities. However, in Joliet, IL, which also had a large decrease in manufacturing, the city’s population declined throughout the 1990s, but the city’s population has grown significantly since the turn of the century, as shown in the population table below. Joliet is focusing on other industries and initiatives, such as the Intermodal Center, which could be one reason for its recent population growth.
Chart 1. Percent employed in manufacturing
Population
The other main criterion for inclusion in our study was that the city needed to have a population of at least 50,000 in 1960. A Midwest city population that large in the 1960s typically indicated a dynamic place with a healthy economy. Below is a table of the percentage changes in the total population since 1970. Aurora, IL, and Joliet, IL, saw a boom in their population during the last two reporting periods, while the population in Gary, IN, has decreased every year since 1960. Pontiac, MI, has either decreased or stayed consistent. In comparison, the U.S. population overall has increased every year.
Table 1. Percentage change in total population
| 1970 to 1980 | 1980 to 1990 | 1990 to 2000 | 2000 to 2005-09 | |
|---|---|---|---|---|
| United States | 11.5% | 9.8% | 13.2% | 7.1% |
| Cedar Rapids, IA | –0.4% | –1.4% | 11.0% | 4.3% |
| Waterloo, IA | 0.6% | –12.5% | 3.4% | –3.5% |
| Aurora, IL | 9.6% | 22.5% | 43.6% | 20.6% |
| Joliet, IL | –3.0% | –1.4% | 38.2% | 34.6^ |
| Fort Wayne, IN | –3.1% | 0.5% | 18.9% | 22.7% |
| Gary, IN | –13.4% | –23.2% | –11.9% | –6.2% |
| Grand Rapids, MI | –8.0% | 4.0% | 4.6% | –2.3% |
| Pontiac, MI | –10.0% | –7.2% | –6.8% | 0.0% |
| Green Bay, WI | 0.1% | 9.7% | 6.1% | –1.3% |
| Racine, WI | –9.9% | –1.7% | –2.9% | 0.3% |
Other Interesting Data Points
An interesting breakdown of the total population is the young family/working age demographic of people aged 25–44 years old. A small percentage of people in this demographic could present a problem for a city, since it seems to indicate a lack of appeal of the area as a good place to raise a family. This could potentially hamper the area’s future growth, since this is the population segment that is at the age to reproduce and tends to generate economic activity. Waterloo, IA, had the smallest percentage of the population in this category in the 2005–09 ACS at 23.0%, while Aurora, IL, had the largest percentage of the population in this demographic at 33.2%. Waterloo, IA, also has a small percentage of the population in the young adult category of 20–24 year olds. Over half of this city’s population is under 19 or between the ages of 45 and 65.In terms of racial diversity, Aurora, IL, had the largest Hispanic population, 39.0%, while Cedar Rapids, IA, had the smallest, 3.0%. Green Bay, WI, saw a notable increase in its Black population, from 0.1% in 1970 to 2.5% in 2005–09, though this proportion obviously remains very small. In the most recent survey Gary, IN, had the largest share of Black population at 80.0%.
Unemployment remains a major issue nationally and regionally. During the last survey, Cedar Rapids, IA, had the lowest civilian unemployment rate of the 10 cities we are examining at 5.1%, and Pontiac, MI, had the highest civilian unemployment rate in the group at 18.6%.
Looking Ahead
In the coming months, while we will continue to blog about the Industrial Cities Initiative, we also plan to address other topics being studied by CDPS. This type of research typically has multiple stages and takes a long time to complete. We hope to use this blog to bring you some interesting findings from various stages of work in progress at the Chicago Fed.Footnotes
1 Aside from a few exceptions relating to 1970, all data from between 1970 and 1990 come from the decennial census via the University of Minnesota’s National Historical Geographic Information System (NHGIS). Link provided at the end of this blog.
Data Footenote:
NHGIS: Minnesota Population Center. National Historical Geographic Information System: Pre-release Version 0.1. Minneapolis, MN: University of Minnesota 2004.
All data from 2000 come from the 2000 census via American FactFinder
All data from 2009 come from the American Community Survey via American FactFinder
ICPSR: Some of the data (and tabulations) utilized in this (publication) were made available (in part) by the Interuniversity Consortium for Political Social Research. The data for City and County Data Book [United States] Consolidated Files, City Data 1944–1977 were originally collected by The U.S. Department of Commerce, Bureau of the Census. Neither the collector of the original data nor the Consortium bear any responsibility for the analyses or interpretations presented here.


