The Importance of Cars and Car Loans for People with Low and Moderate Incomes
This blog post discusses the substantial role of cars and the loans that people use to pay for them in the lives of households with low and moderate incomes (LMI households).1 It highlights five key points:
1. Cars are an important source of wealth and provide substantial economic benefits while also being the largest source of debt for LMI households.
2. It is particularly costly for LMI households to purchase cars, as they pay interest rates over and above what would be expected based on their risk of default, are often charged above market prices or are pushed to purchase more expensive cars, and take out longer loans that increase and prolong financial risk.
3. Racial and ethnic discrimination contributes to people of color paying higher interest rates on car loans than non-Hispanic White borrowers with similar income and credit scores, even though White borrowers are relatively more likely to default.
4. The limited information available about interest rates and other car loan terms faced by borrowers with different incomes, racial and ethnic identities, and default risks makes it difficult to measure the size and scope of problems in the car loan market, identify their causes, and offer evidence-based solutions.
5. While current conditions likely exacerbate these preexisting problems, they also create an even greater opportunity to improve the economic conditions of LMI households financing vehicles.
Cars are an important source of wealth and provide substantial economic benefits while also being the largest source of debt for LMI households.
Car ownership is ubiquitous in America, far outstripping home ownership. The homeownership rate in the United States is around 65%, but more than 91% of households have at least one vehicle. In all, there are about 284 million cars registered in the United States, more than the estimated 235 million licensed drivers. And while homes are a significant contributor to wealth for most Americans, for the approximately 25% of households with the lowest wealth, the majority of their total assets come from vehicles (see figure 1).2
1. Shares of total household assets in vehicles and real estate, by total wealth
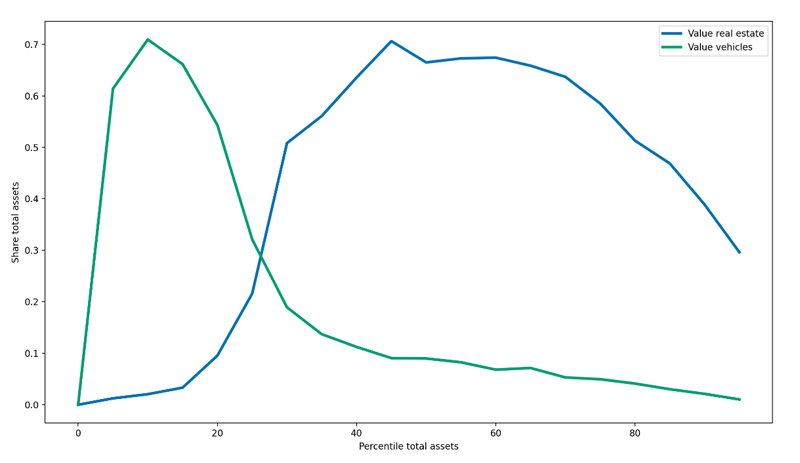
Although cars are the major source of wealth for LMI households, they are not wealth-building assets. Cars depreciate quickly, in stark contrast to homes, which have traditionally appreciated in value over long periods, even if that appreciation is not equitably distributed across racial and ethnic groups or neighborhoods.
Cars also provide substantial economic benefits, especially to those with low and moderate incomes and people of color. Cars get people to their jobs. In the latest available data, 69% of workers drove to work alone and 7.9% carpooled. Excluding those who are able to work from home (an option not afforded to the majority of LMI workers), more than 91% of commuters rely on cars to get to work. In addition to making it easier to get to a job, access to cars can improve the jobs available to workers. In one vehicle-access program 75% of people without cars who received subsidized vehicles were able to find better jobs and/or increase earnings. Moreover, access to a reliable vehicle can open up opportunities for gig economy work (e.g., rideshare or delivery services), which can help those who are cash strapped or need additional income. Car ownership may open up not just occupational opportunities, but also expanded educational opportunities, means by which to combat the effects of food deserts that are common in LMI communities, and improved residential options that can enhance broader economic opportunities.
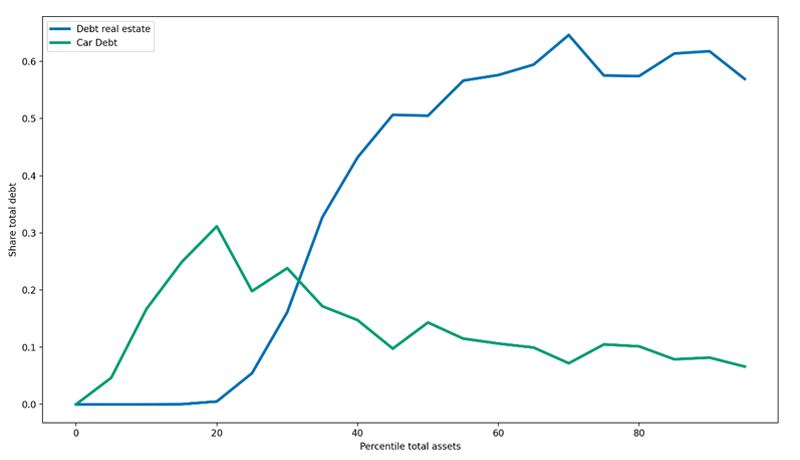
While cars are the largest single asset for many LMI households, and a key facilitator of economic activity, there are significant costs associated with these benefits. In fact, while cars represent the largest asset for the approximately 25% of households with the fewest assets, the loans used to acquire cars are the largest share of debt for the approximately 30% of lowest-wealth households (figure 2).4
2. Auto debt versus real estate debt by household wealth
It is particularly costly for LMI households to purchase cars, as they pay interest rates over and above what would be expected based on their risk of default, are often charged above market prices or are pushed to purchase more expensive cars, and take out longer loans that increase and prolong financial risk.
LMI and credit-challenged households struggling to find cars are likely to turn to higher cost lenders who offer “guaranteed acceptance” auto loans. Many of these loans occur at “buy here, pay here” (BHPH) auto dealers, where the dealer provides a buyer with both a car and a loan payable directly to the dealer. This should not be confused with “indirect auto lending” or “dealer arranged financing”, where a dealer secures credit from a third-party lender on the borrower’s behalf. BHPH may be particularly enticing to borrowers who are worried they would not qualify for credit via traditional dealer-arranged financing. Other subprime auto finance companies also promise easy access to credit or guaranteed approval for LMI borrowers. However, loans from BHPH dealers and subprime finance companies typically come at a high cost.5 The typical interest rate paid at a BHPH dealer or at a subprime finance company is typically 20% or more, compared with around 9% for subprime borrowers at a credit union or bank, despite similar default rates. For perspective, this means that a typical subprime borrower could save $1,000 or more if they could secure their loan from a bank or a similar lender via dealer-arranged financing.
Other practices in the subprime auto finance market also increase the costs for LMI car buyers. There is evidence that BHPH dealers frequently charge above market prices for vehicles to circumvent usury caps and that subprime borrowers are often pushed to purchase more expensive new vehicles that are difficult to afford. These practices tend to increase the principal LMI borrowers need to finance.
There has also been a trend toward longer-term lengths for auto loans that put borrowers at increased and prolonged financial risk, especially those with lower incomes and wealth. These longer loans can result in lower monthly payments—an attractive proposition for income-constrained households. However, longer terms also increase a borrower’s total cost and time in debt. Moreover, longer terms mean the car is likely to be “underwater” (where the value of the car is less than the outstanding loan balance) longer, especially when considering that loan-to-value ratios for autos typically exceed 100% at origination. And borrowers who fall behind on their loans can experience repossession with both a higher likelihood and shorter time frame compared to home foreclosure.
Racial and ethnic discrimination contributes to people of color paying higher interest rates on car loans than non-Hispanic White borrowers with similar income and credit scores, even though White borrowers are relatively more likely to default.
Racial and ethnic disparities exist in the market for auto loans, making it more expensive for people of color to obtain cars compared to their White counterparts with similar incomes and credit scores. In fact, a recent study shows non-White customers were often charged significantly more when financing a car even when they were better qualified than their White counterparts.
Some of this disparity results from the fact that borrowers who are Black are more likely to finance their loans at finance companies, a phenomenon that may speak to steering by dealers or differences in financial literacy or experiences. Some auto dealers have also disproportionately charged “junk fees” to borrowers of color.
But research shows that much of the disparity comes from differences in discretionary markups of auto loans. In dealer-arranged financing (which accounts for about 80% of auto loans), lenders often allow dealers to mark up interest rates by 200 basis points or more in exchange for profit sharing. For example, a lender may be willing to extend a loan to a borrower at 7% interest, and the dealer may mark that loan up so that the borrower instead pays 9%. Evidence shows that borrowers who are people of color have been systematically charged higher markups than their non-Hispanic White counterparts. Moreover, this disparity seems to result directly from prejudice. Specifically, research shows that these disparities are not related to differences in risk, financial literacy, or negotiation ability, but instead the result of racial and ethnic prejudice in the local market. Further evidence that these disparities are unjustified by underlying risk can be observed by the fact that, despite facing higher interest rates conditional on their income and credit scores, borrowers who are people of color are actually less likely to default than White borrowers. In short, while it costs LMI households more to finance a car, this is especially true for LMI borrowers who are people of color.
The limited information available about interest rates and other car loan terms faced by borrowers with different incomes, racial and ethnic identities, and default risks makes it difficult to measure the size and scope of problems in the car loan market, identify their causes, and offer evidence-based solutions.
A thorough understanding of the market for auto loans for people of color and LMI borrowers requires access to data that include information about loan traits (e.g., interest rates, term length), borrower characteristics (e.g., race/ethnicity, income, credit score), and vehicle characteristics (e.g., value, price paid). Understanding the causes of any disparities likely requires additional data on the characteristics of dealers and lenders setting the interest rates and markups.
While there are many sources of data on auto loans, each is limited because it lacks some of the key features mentioned here.6 Many of the best data sources are private/proprietary and/or limited in coverage and detail. As an example, retail transaction data have detailed information on vehicles and financing, but minimal information on borrower characteristics. Consumer credit and survey data often have the opposite problem, with information on the borrowers, but limited insight into the transaction. Additionally, auto lenders are prohibited from collecting most demographic data on their borrowers, meaning race and ethnicity are often estimated using complex statistical techniques. This limits the insight regulators, let alone the public, can have into the larger market for auto loans. Absent comprehensive and detailed data, reporting on auto lending activity often relies on data that are not publicly available and may provide only limited insights into lending patterns and practices.7
These limitations likely make it more difficult for a community development-focused lender to create a targeted and comprehensive auto lending program. The absence of data that can easily identify inequities in, or barriers to, credit may allow for more pernicious and persistent problems in the auto lending market.
While current conditions likely exacerbate these preexisting problems, they also create an even greater opportunity to improve the economic conditions of LMI households financing vehicles.
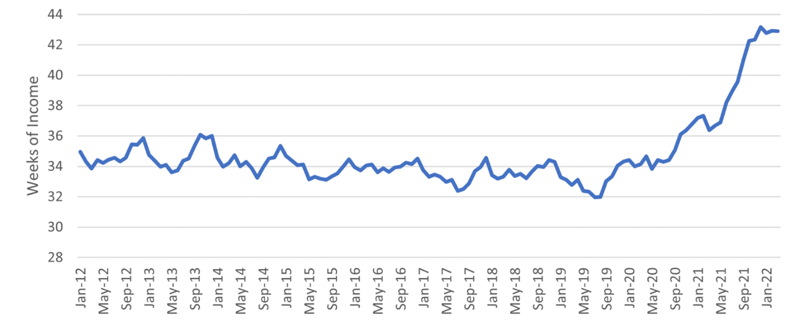
The pandemic and related supply-chain issues have likely exacerbated these long-standing disparities by making it harder and more expensive for LMI households to buy and finance cars. During this period, tight market conditions and greater concentration in franchised dealers have driven up prices for both new and used cars. As an illustration of just how much prices have increased, the number of weeks of median income required to purchase an average new car had increased from less than 35 weeks before the pandemic to about 43 weeks by January 2022 (figure 3).
3. Weeks of median U.S. income needed to purchase a new light vehicle
These high prices have only increased the importance of auto loans, as fewer people can afford to pay cash for their cars (assuming dealers would even allow it). Competition for cars has hit LMI households hard, as the data show higher loan amounts and less access to loans for subprime borrowers.
While the current market pressures have highlighted and increased the difficulties and disparities facing borrowers who are people of color and LMI borrowers, the current market conditions did not cause those problems, and the problems are likely to persist even if/when things return to “normal” in the market for cars.
The flip side of this coin is that the returns to policies and practices that address the difficulties and disparities facing borrowers who are people of color and LMI borrowers may be particularly high right now and will likely continue to pay dividends moving forward. As discussed here, the higher interest rates paid on car loans by LMI borrowers and, in particular, borrowers who are people of color, are higher than their default risk would imply they should be. Much of this appears to be due to steering to high-cost lenders and racial and ethnic discrimination in pricing. Data limitations will necessarily make it difficult to craft evidence-based targets and strategies to address this. That said, it follows that auto lending practices and policies that avoid steering to higher-cost lenders and reduce racial and ethnic discrimination will expand access to affordable loans and offer the potential to benefit households that have been negatively impacted by these practices. Reducing these disparities in auto lending could have outsized returns for the approximately 30% of households with the lowest wealth for whom auto loans are the largest source of debt.
Notes
1 This post uses LMI to refer broadly to multiple conditions closely intertwined with low and moderate income, such as low wealth or low credit scores.
2 That vehicles are an important source of wealth for LMI households helps to explain the prevalence of high-cost auto title loans, a multibillion dollar industry that provides access to wealth stored in vehicles, but that carries significant risk of vehicle seizure.
3 Laura C. Murphy, 2022, “Understanding Changing Term structure of Auto Loans” [Presentation Slides], Northwestern University, Department of Economics.
4 There are other significant costs frequently associated with car ownership that may be especially costly for LMI households, including fuel, maintenance/servicing, insurance, etc.
5 Some BHPH dealers and finance companies are exceptions and demonstrate a commitment to provide broad access to affordable cars and loans. The discussion here refers to findings from research and analysis that considers the typical or average experiences of borrowers at these lenders.
6 Some other examples of current data used by researchers or regulators include samples of data from credit reporting agencies, data produced by certain lenders in response to class-action lawsuits, supervisory data collected from specific lenders during Equal Credit Opportunity Act fair lending exams, survey data, etc. None of these are comprehensive in their coverage of the market, many lack details on the specifics of the transaction (e.g., underwriting, pricing) and those with greater details on the loans typically lack information on borrower demographics.
7 In contrast, the data made available by the Home Mortgage Disclosure Act (HMDA) cover the vast majority of mortgages, describe key characteristics of both transactions and borrowers, and provide “sunshine” on the mortgage market to ensure regulators and the public have the information necessary to identify and create policies to address any problems.


