Measuring the Recovery in Economic Activity During the Covid-19 Pandemic
In a previous blog post, we described several indexes produced by the Federal Reserve Banks of Chicago, Philadelphia, and New York and showed how they could be used to measure the decline in U.S. economic activity in the spring of 2020. Here, we show how they can now be used to track the subsequent recovery.
On June 8, 2020, the National Bureau of Economic Research (NBER) issued a statement announcing that its Business Cycle Dating Committee determined U.S. economic activity had reached a cyclical peak in February 2020. According to most measures, economic activity plummeted in March and April of this year. Beginning in May 2020, many of the economic indicators tracked by the NBER and others as measures of the U.S. business cycle began to improve. To demonstrate this, figure 1 plots the Chicago Fed National Activity Index (CFNAI).
Figure 1. Chicago Fed National Activity Index (CFNAI) versus Aruoba-Diebold-Scotti Business Conditions Index (ADSBCI)
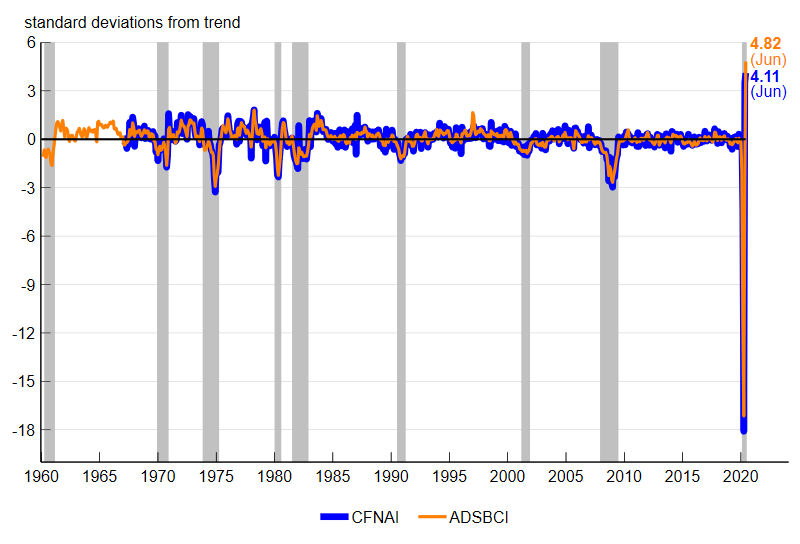
Sources: Federal Reserve Bank of Chicago; and authors’ calculations based on data from the Federal Reserve Bank of Philadelphia from Haver Analytics.
The CFNAI is a monthly index designed to gauge overall economic activity for the U.S. based on 85 economic indicators drawn from four broad categories of macroeconomic data: production and income; employment, unemployment, and hours; personal consumption and housing; and sales, orders, and inventories. It is constructed to have an average value of zero and a standard deviation of one. Since economic activity tends toward a trend growth rate over time, a positive index reading has historically been associated with growth above trend and a negative index reading with growth below trend. With this in mind, note that the units in figure 1 are standard deviations, such that a value of +1.0 indicates that the index was 1 standard deviation above its long-run average.
The latest release of the CFNAI—which came out on July 21, 2020, for data through June 2020—reported the index had reached an all-time high in its history extending back to March 1967, just beating out the previous all-time high, set in May 2020. It is important to keep in mind, however, that the CFNAI is a measure of growth. Despite two very strong months of above-trend growth according to the index, the level of economic activity in the U.S. is still far from its pre-pandemic level. This is evident by the fact that the April value of the index alone was nearly two-and-a-half times as negative (–18.09) as the sum of the May value (+4.11) and June value (+3.50).
Figure 1 also plots a similar index produced by the Philadelphia Fed called the Aruoba-Diebold-Scotti Business Conditions Index (ADSBCI). Both the ADSBCI and CFNAI are shown as standard deviations from their sample means in the figure, but the ADSBCI sample history extends back to January 1960 and covers only six macroeconomic data series.1 However, since five of these six series tend to be those that receive large weights in the CFNAI (growth in U.S. real gross domestic product, or GDP, is not among its 85 series), the two indexes tend to mirror each other quite closely. This is clearly evident in the recent values of the ADSBCI, with it too reaching all-time highs in the past two months following a record decline in April.
To broadly gauge how far U.S. economic activity remains from its pre-pandemic level, we use an alternative set of indexes produced by the Chicago Fed. The Brave-Butters-Kelley Indexes (BBKI) are based on 500 monthly indicators of growth in U.S. economic activity—almost six times more indicators than used for the CFNAI—and like the ADSBCI include quarterly real GDP growth from the U.S. Bureau of Economic Analysis, with a history extending back to January 1960. We focus on a particular index from this set called BBK Monthly GDP Growth. Because this index is scaled to match official U.S. GDP growth, we can interpret its units as monthly (log) annualized percent changes that will aggregate to match the quarterly (log) annualized percent change in U.S. GDP. This feature is useful in creating the plot in figure 2 showing the cumulative decline in U.S. GDP from February through June 2020.
Figure 2. Cumulative decline in Brave-Butters-Kelley (BBK) Monthly GDP Growth since February 2020
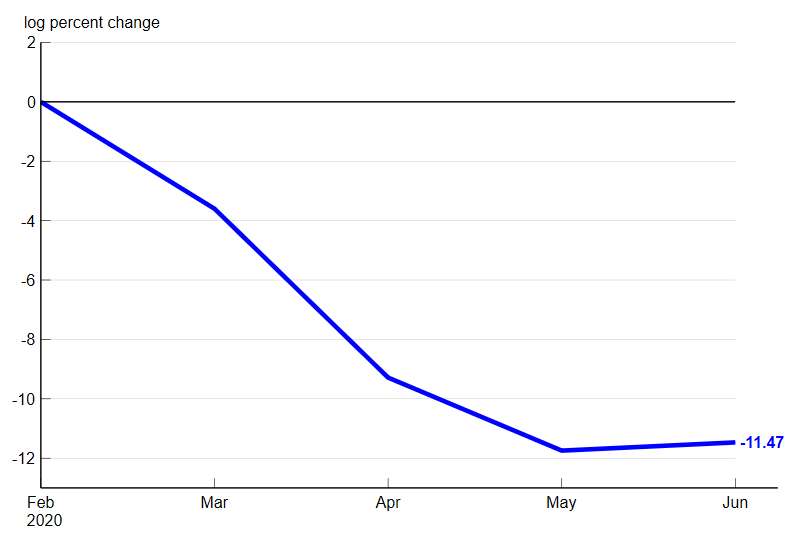
Source: Authors’ calculations based on data from the Federal Reserve Bank of Chicago from Haver Analytics.
At –11.47% through June 2020, BBK Monthly GDP growth in figure 2 indicates that the U.S. economy still has far to go to reach its pre-pandemic level of economic activity. A similar pattern can also be seen in figure 3—which compares BBK Monthly GDP Growth with the Weekly Economic Index (WEI), a new economic activity index produced by the New York Fed. The WEI is scaled in terms of year-over-year real GDP growth. Therefore, to make an apples-to-apples comparison in this case, we transform BBK Monthly GDP Growth into year-over-year real GDP growth. Both indexes through June 2020 remained negative, pointing to U.S. GDP being below its level of a year ago.
Figure 3. Brave-Butters-Kelley (BBK) Monthly GDP Growth versus Weekly Economic Index (WEI)
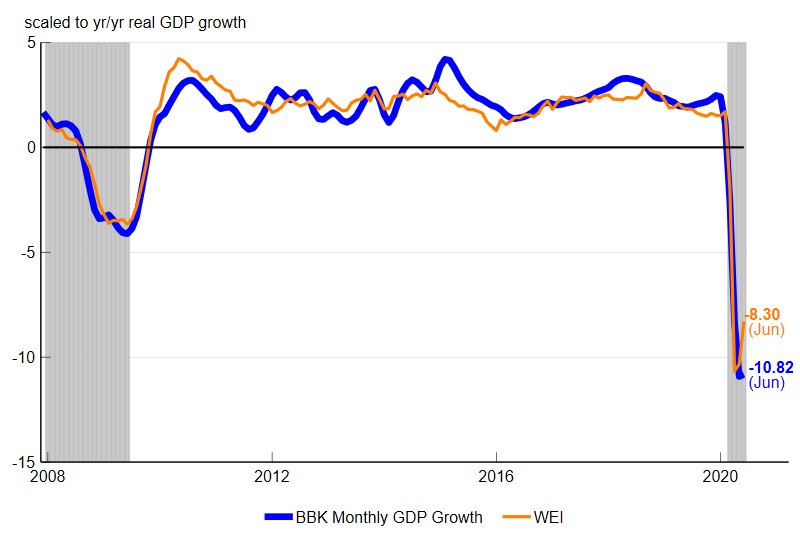
Sources: Authors’ calculations based on data from the Federal Reserve Bank of Chicago and Federal Reserve Bank of New York from Haver Analytics.
With the public health situation rapidly evolving in the U.S., these summary indexes of economic activity should continue to shed further light on the path of the economy in the coming months. More information on the CFNAI and BBKI can be found on the Chicago Fed’s Economic Data page.
Notes
1 The six indicators are nonfarm payrolls, industrial production, real manufacturing and trade sales, real personal income less transfer payments, initial unemployment insurance claims, and real gross domestic product growth for the U.S.


