A First Look at the Employment Response by Industry to Covid-19 Vaccine Take-Up
In this Chicago Fed Insights blog post, we take a first look at the relationship between industry employment and Covid-19 vaccine take-up. As the U.S. population becomes increasingly vaccinated against Covid-19, the ongoing recovery in the labor market is expected to strengthen. In early 2020, employment was hit hardest in industries where it was either difficult to work from home or where demand was severely limited by social distancing restrictions. One might expect then that jobs in these industries would benefit the most from the Covid-19 vaccines and the potential for a return to more normal levels of economic activity. However, the timing and extent of any such impact on the labor market remain uncertain.
We analyze state-level payroll data to investigate the relationship between employment and Covid-19 vaccination rates. Our analysis of these data by industry suggests that gains in employment in some industries have already been positively associated with higher vaccine take-up; but through early 2021, this was most strongly evident in the accommodation and food services industry. This result also varies regionally: Relative to other parts of the U.S., western states show a stronger correlation between employment in the accommodation and food services industry and vaccination rates, whereas southern states show a much weaker connection.
Comparing state-level payrolls by industry before and after vaccine availability
We begin by comparing state-level payrolls for each industry (or state-industry payroll data) before and after Covid-19 vaccines became available in the U.S. To measure vaccine take-up in each state, we use the percentage of the civilian noninstitutional population aged 16 and above that was fully vaccinated for Covid-19 in mid-May 2021.1 Covid-19 vaccines in the U.S. were not widely distributed before January 2021. Therefore, we use the months of January through May 2021 as our sample period for when vaccines became available.
Ending the vaccine data in May is necessary in order to compare them against state-level payroll data for each industry from the U.S. Bureau of Labor Statistics (BLS), because these BLS data are currently only available through the same month.2 In order to measure payrolls and vaccinations on a consistent basis, we also divide the former by the same measure of state population used to construct the measure of vaccine take-up. Then, to account for the fact there may have been some pre-existing trends within states and industries, we take the difference between the monthly average percent change in industry payrolls during the period when vaccines became available and a pre-vaccine baseline period—for the months of January through May 2019.
With these data, we next run a series of linear regressions—statistical processes that measure the degree of correlation between two variables. Specifically, our regression analysis relates the differences in average payroll growth between the periods before and after vaccines became available to vaccine take-up. In these regressions, we limit our analysis to only the contiguous U.S. states (and exclude the District of Columbia), and include those states for which payroll data are available from the BLS for a given industry.3 We also include U.S. Census division “fixed effects” in the regressions.4 This means that in establishing the relationship between changes in payrolls and vaccine take-up between our two sample periods, we restrict our focus to the variation across states within each Census division.
Census division fixed effects help to account for factors that are unlikely to vary across our two time periods, before and after vaccine availability (such as political and cultural considerations5), but that are likely to impact both payrolls and vaccine take-up. To account for any remaining spatial dependence in the state-industry payroll data not correlated with vaccine take-up, we adjust the regression’s standard errors (showing the precision of the estimate of the correlation) for “clustering” at the U.S. Census division level. The four Census regions (Northeast, South, Midwest, and West) each contain at least two Census divisions (with nine in total—see note 4).
Regression estimates
The estimated coefficients from these regressions (showing the degree of correlation) and their standard errors are shown in table 1. We also show in the table whether the correlations are statistically significantly different from zero, marking each of these instances with an asterisk (*). In order to see the impact that the Census division fixed effects have on these coefficients and their statistical significance, we present regression results both with and without them.
Table 1. Payroll growth by industry and vaccine take-up: January–May 2021 versus January–May 2019
| Industry | Without Census division fixed effects | With Census division fixed effects |
|---|---|---|
| Accommodation and food services | 0.113* | 0.080* |
| (0.020) | (0.030) | |
| Administrative, waste management, and remediation services | 0.034 | 0.051 |
| (0.026) | (0.052) | |
| Arts, entertainment, and recreation | 0.043 | –0.170 |
| (0.076) | (0.119) | |
| Construction | 0.010 | –0.017 |
| (0.020) | (0.020) | |
| Educational services | –0.010 | –0.036 |
| (0.030) | (0.044) | |
| Finance and insurance | –0.004 | –0.021* |
| (0.006) | (0.007) | |
| Government | 0.012 | 0.012 |
| (0.010) | (0.016) | |
| Health care and social assistance | 0.010* | 0.003 |
| (0.004) | (0.006) | |
| Information | –0.007 | –0.050 |
| (0.014) | (0.028) | |
| Manufacturing | 0.004 | –0.002 |
| (0.005) | (0.010) | |
| Management of companies and enterprises | –0.001 | –0.003 |
| (0.011) | (0.011) | |
| Mining and logging | 0.037 | 0.029 |
| (0.038) | (0.039) | |
| Other services | 0.023 | 0.001 |
| (0.014) | (0.022) | |
| Professional, scientific, and technical services | 0.009 | 0.019 |
| (0.010) | (0.014) | |
| Real estate, rental, and leasing | –0.004 | –0.001 |
| (0.016) | (0.028) | |
| Retail trade | 0.013 | 0.015 |
| (0.008) | (0.014) | |
| Transportation, warehousing, and utilities | –0.016 | 0.006 |
| (0.014) | (0.019) | |
| Wholesale trade | 0.006 | 0.023 |
| (0.015) | (0.033) |
Notes: The table displays coefficients and standard errors adjusted for clustering by Census division (in parentheses) from linear regressions comparing differences in the rate of growth in industry payrolls before and after Covid-19 vaccines became available in the U.S. with the rate of vaccine take-up across U.S. states. We present results from regressions that exclude and include additional Census division fixed effects as controls. See note 4 for details on Census divisions.
Sources: Authors’ calculations based on data from the U.S. Bureau of Labor Statistics from Haver Analytics and the Centers for Disease Control and Prevention.
As table 1 shows, a positive correlation typically exists between changes in industry payrolls and vaccine take-up across the contiguous U.S. states between our two time periods (of the 18 industries only six are negative in the first column of results in table 1 and eight are negative in the second column). However, only for a handful of industries is this correlation (positive or negative) statistically significantly different from zero at the 95% confidence level. This is true despite our estimates being quite large in some instances (e.g., for the arts, entertainment, and recreation industry). In those cases, our estimates are highly imprecise (i.e., showing large standard errors) because of the large amount of variability across states in terms of the relationship between employment and vaccination rates.6
Generally speaking, the conclusions drawn from table 1 are similar with and without the Census division fixed effects included in the regressions. However, for the three industries where we find statistically significant correlations (accommodation and food services, health care and social assistance, and finance and insurance), their inclusion matters. Including Census division fixed effects leads to a statistically insignificant correlation between employment and vaccine take-up in the health care and social assistance industry and a statistically significant correlation in the finance and insurance industry. Furthermore, their inclusion reduces the magnitude of the positive correlation in the accommodation and food services industry by almost 30%.
Thus, the results in table 1 confirm the need to account for factors that are likely to impact both payrolls and vaccine take-up. To investigate this further, we generated figure 1, which displays graphically results from Census division fixed effect regressions for our measures of percent changes in payrolls, run separately for the periods before and after Covid-19 vaccines became available. Unlike in table 1, in this figure we focus on only the industries with correlations that are statistically significantly different from zero in the second column of table 1—namely, the accommodation and food services industry and the finance and insurance industry.
Figure 1. Regression results for two industries in the periods before and after vaccine availability
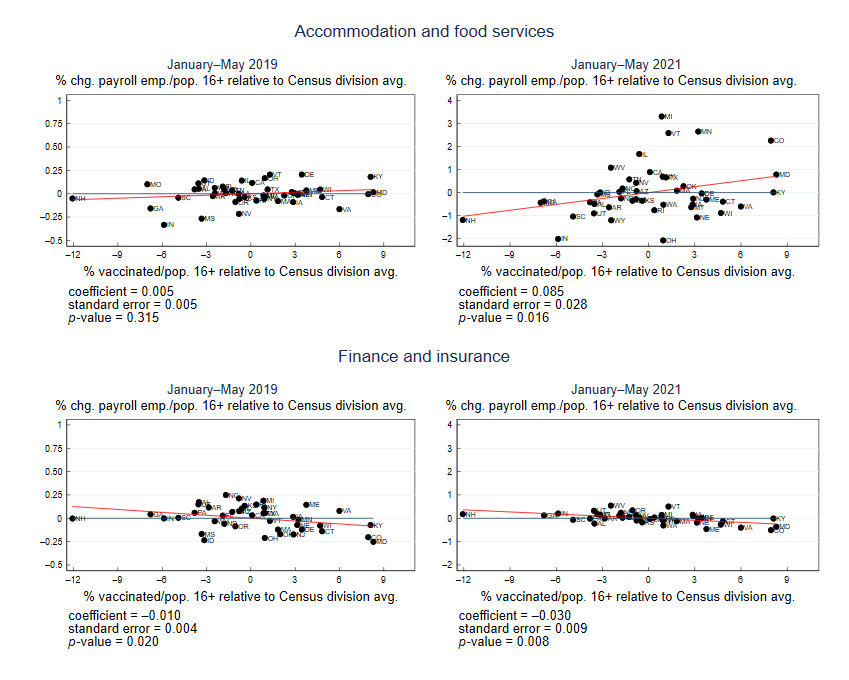
Sources: Authors’ calculations based on data from the U.S. Bureau of Labor Statistics from Haver Analytics and the Centers for Disease Control and Prevention.
We should expect to find a zero correlation in this figure (i.e., statistically insignificant differences between the red and blue lines) for both industries during the period of time before vaccines became available. A result to the contrary suggests that our regressions are misspecified and that the correlation we estimate between employment and vaccine take-up may instead capture other factors present prior to Covid-19 vaccines becoming available that are correlated with differences in vaccination rates across states.
For at least one of the two industries—finance and insurance—this is in fact what we see in the regression results reported below the bottom left panel of the figure. There is indeed a statistically significant negative correlation between employment growth in this industry in 2019 and Covid-19 vaccination rates in 2021—long before these vaccinations began.7 For this reason, we choose to focus solely on the accommodation and food services industry. The estimate we obtain for this industry in figure 1 using data for only the period after vaccines became available is comparable to that in table 1 in terms of both statistical significance and magnitude.
Accommodation and food services employment and vaccine take-up by region
In table 2, we break down our regression estimates for the accommodation and food services industry further, examining possible differences in the relationship between employment in this industry and vaccine take-up by Census region (see note 4). These four separate regressions reveal that the positive association between changes in accommodation and food services industry payrolls and vaccine take-up varies considerably across the U.S., with the strongest correlation for the West Census region and the weakest correlation for the South Census region.
Table 2. Accommodation and food services payroll growth and vaccine take-up, by U.S. Census region
| U.S. Census region | With Census division fixed effects |
|---|---|
| West (excluding HI and AK) | 0.218* |
| (0.01) | |
| Midwest | 0.098* |
| (0.006) | |
| Northeast | 0.073* |
| (0.001) | |
| South | 0.03 |
| (0.018) |
Notes: The table displays coefficients by Census region and standard errors adjusted for clustering by Census division (in parentheses) from linear regressions comparing differences in the rate of growth in payrolls for the accommodation and food services industry before and after Covid-19 vaccines became available in the U.S. with the rate of vaccine take-up across U.S. states. All regressions include Census division fixed effects as controls. See note 4 for details on Census divisions and regions.
Sources: Authors’ calculations based on data from the U.S. Bureau of Labor Statistics from Haver Analytics and the Centers for Disease Control and Prevention.
To put the numbers in table 2 in perspective, we consider the following thought experiment. Imagine increasing every state’s rate of vaccine take-up through mid-May 2021 by 1 percentage point (say, from 15% of the population to 16% of the population). The regression coefficients in table 2 tell us how much higher the monthly average percent change in accommodation and food services payrolls would be in early 2021 than it was in early 2019 as a result of this change. We can then translate these differences into the expected number of additional jobs that would be added in early 2021. Adding up these numbers across the states, we arrive at the total expected number of additional jobs for the industry.
Running the numbers for this experiment, we find that accommodation and food services payrolls would increase by about 15,000 more jobs per month as a result. In arriving at this number, though, we rather arbitrarily assumed an increase of 1 percentage point in state vaccine take-up rates in our thought experiment. This turns out to be a reasonable choice given the amount of variation in vaccine take-up that we do see across states. For instance, the standard deviation (a measure of dispersion around the average) of vaccine take-up across states was about 6 percentage points, with a difference of about 20 percentage points between the states with the highest and lowest vaccine take-up through mid-May 2021. If we instead repeat our thought experiment using the actual increases in state vaccine take-up rates from mid-May to mid-June,8 it suggests that accommodation and food services payrolls in June will be boosted by about 90,000 jobs by the recent increase in vaccinations.
Conclusion
Despite a gain of almost 1 million jobs this year, payrolls in the accommodation and food services industry are still close to 2 million jobs lower than in February 2020—a month prior to when the World Health Organization declared the Covid-19 outbreak a global pandemic and many U.S. states began implementing lockdown measures. Our analysis suggests, however, that employment in this industry has been the most responsive to changes in Covid-19 vaccine take-up. Interestingly, this relationship in the lower 48 U.S. states appears to be strongest for the western states and weakest for the southern states. Based on these regional differences and vaccine take-up through mid-June, our results suggest that increasing vaccination rates could add about 90,000 jobs in June to accommodation and food services payrolls.
Notes
1 Centers for Disease Control and Prevention (CDC) data, available online, accessed on May 13, 2021. Only those individuals aged 16 and above could be fully vaccinated at this time; the CDC’s definition of “fully vaccinated” against Covid-19 is available online. We divide the number of fully vaccinated individuals for each state by the state’s civilian noninstitutional population aged 16 and above.
2 The reference week for the May 2021 Current Employment Statistics (CES) survey (also known as the establishment or payroll survey), published by the BLS, was the week ending on May 17, 2021.
3 Not every state reports payroll data for all of the industries that we examine in our regressions in table 1.
4 Details on Census divisions, as well as Census regions, are available online. While not part of our analysis, both Hawaii and Alaska are part of the Pacific division and West region.
6 Both the accommodation and food services and arts, entertainment, and recreation industries are part of the larger leisure and hospitality sector. That said, the accommodation and food services industry accounts for about 85% of leisure and hospitality payrolls at the national level.
7 Several other industries display a similar result. For example, the arts, entertainment, and recreation industry shows a statistically significant positive correlation between employment growth in 2019 and Covid-19 vaccination rates in 2021. This is further reason why we focus solely on the accommodation and food services industry.
8 For this calculation, we use the CDC data through June 12, 2021, for fully vaccinated individuals aged 18 and above in order to avoid including 12–15 year olds, and assume that growth in the civilian noninstitutional population aged 16 and above was the same in June as it was in May for each state.


