What Is Happening to Higher-Ed Enrollment?
Despite the widely documented benefits of enrolling and completing a college degree, postsecondary enrollment has been declining overall since fall 2010. Declines in the number of individuals enrolling in college are worrisome to the colleges themselves, and researchers and the press wrote of the impending enrollment “crisis” prior to the Covid-19 pandemic (e.g., Grawe, 2017; and Bloomberg, 2014). However, the decline in the shares of young people enrolling in college also has important individual and societal ramifications, making it important for researchers and policymakers to understand the underlying causes. In this blog post, we discuss trends in postsecondary enrollment and factors driving these trends. We explore what young people in particular are doing with their time if they are not pursuing higher education, and we discuss some of the implications of the changes in activity and time use for young people and the economy.
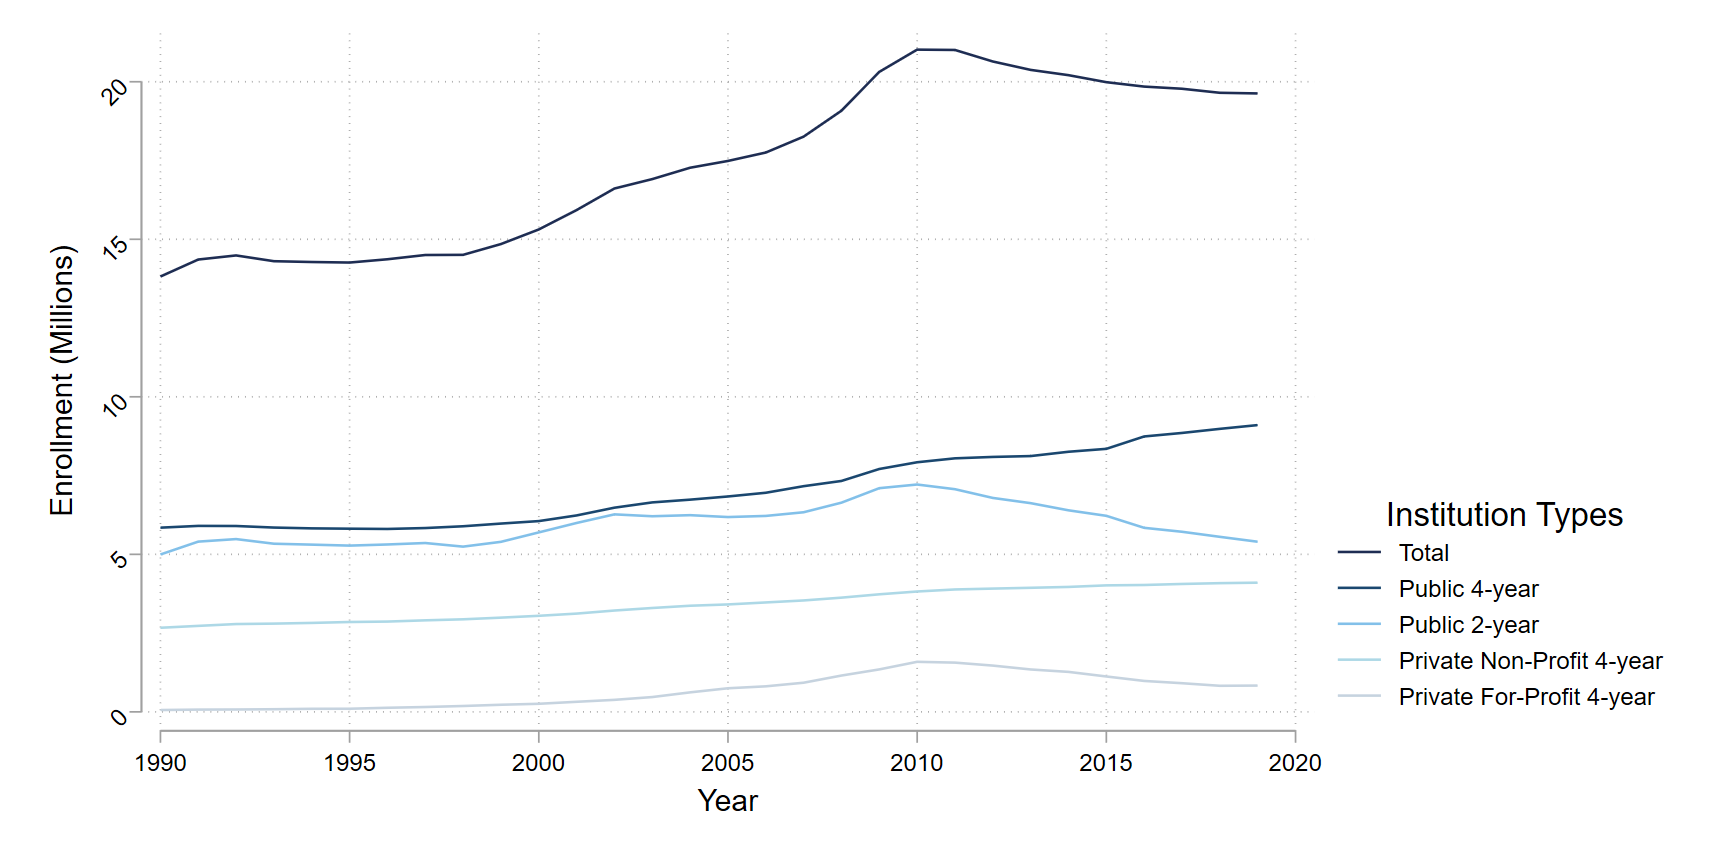
There has been a lot of talk in the press about the pandemic-era declines in postsecondary enrollment. But even before the pandemic, enrollment was declining. In fact, total postsecondary enrollment peaked in fall 2010 (see figure 1), roughly coinciding with a peak in the population of 18 to 21-year-olds.1 Enrollment in the private nonprofit and public four-year college sectors continued to rise between 2010 and 2019, but those increases were more than offset by enrollment declines in the public two-year and private for-profit four-year sectors.2 As a result, total enrollment declined by an annual average rate of 0.8% per year between 2010 and 2019.
How do we explain this decline? In part, it reflects a decline in the population of traditional college-going age. Between 2010 and 2019, the estimated population of 18 to 21 year olds in the United States declined by an average 0.6% per year. The population changes don’t tell the whole story, however—college enrollment rates of young people declined as well, with the percentage of recent high school completers enrolling in college falling from 68% in 2010 to 66% in 2019.3 Researchers have found that college enrollment often increases when unemployment rates are increasing (Long, 2004; Barrow and Davis, 2012), so perhaps it’s not surprising that enrollment rates were declining throughout the 2010 to 2019 period, a time of economic expansion and falling unemployment rates.
1. Total fall enrollment by type of institution, fall 1990 through fall 2019

Following the onset of the Covid-19 pandemic in early 2020, the decline in postsecondary enrollment accelerated (see figure 2)—falling 3.3% between fall 2019 and fall 2020 and an additional 2.7% between fall 2020 and fall 2021, more than three times the annual average over the prior decade. Public two-year institutions experienced the largest enrollment declines in both years—a 12.9% decline in 2020 and a further 5.0% decline in 2021. This large decline in public two-year college enrollment likely reflects both supply- and demand-side factors. For example, two-year colleges offer many courses that require hands-on learning, such as assembly, repair, and maintenance courses, that would have had to reduce class sizes in response to the pandemic (Schanzenbach and Turner, 2022). Further, students who enroll at two-year public institutions are more likely to have lower incomes and/or have dependents of their own, so they are likely to have faced greater barriers to enrollment during the pandemic, including increased childcare needs or lack of access to broadband internet service. However, enrollment rates continued to decline in fall 2021 as pandemic restrictions eased, labor markets strengthened, and vaccination rates improved nationwide. Indeed, enrollment declines were fairly sizable across all sectors between fall 2020 and fall 2021 (see figure 2), perhaps driven by individuals finding employment opportunities more attractive than pursuing further education.
2. Enrollment changes by type of institution, fall 2020 through fall 2022

The most recent data from the National Student Clearinghouse suggest that enrollments may be returning to their pre-pandemic trends. Enrollment continued to decline between fall 2021 and fall 2022 by an additional 1.1% (figure 2).4 However, the decline in enrollment at public two-year colleges slowed substantially in this period to −0.4%, and the overall rate of decline is much more in line with the pre-pandemic trend in enrollment, which averaged −0.8% per year from 2010 to 2019.
Consistent with these pandemic-era declines in total number of students enrolled, the enrollment rate for recent high school completers declined an additional 3.5 percentage points to 61.8% in 2021, the lowest rate since 2001. Looking more generally at all school enrollment regardless of high school completion status, there has also been a decline in the percentage of all 16 to 24 year olds enrolled in either high school or college. The percentage of teens (aged 16 to 19) enrolled in school peaked in 2011 and declined 5 percentage points to 81% in 2021. Over the same period, the school enrollment rate for young adults (aged 20 to 24) declined from 40% to 37%.5 As noted earlier, falling enrollment rates may reflect that individuals find employment opportunities more attractive than pursuing further education. If this is the case, we should see corresponding rises in labor force participation.
Are young people entering the labor force in greater numbers (instead of going to school)?
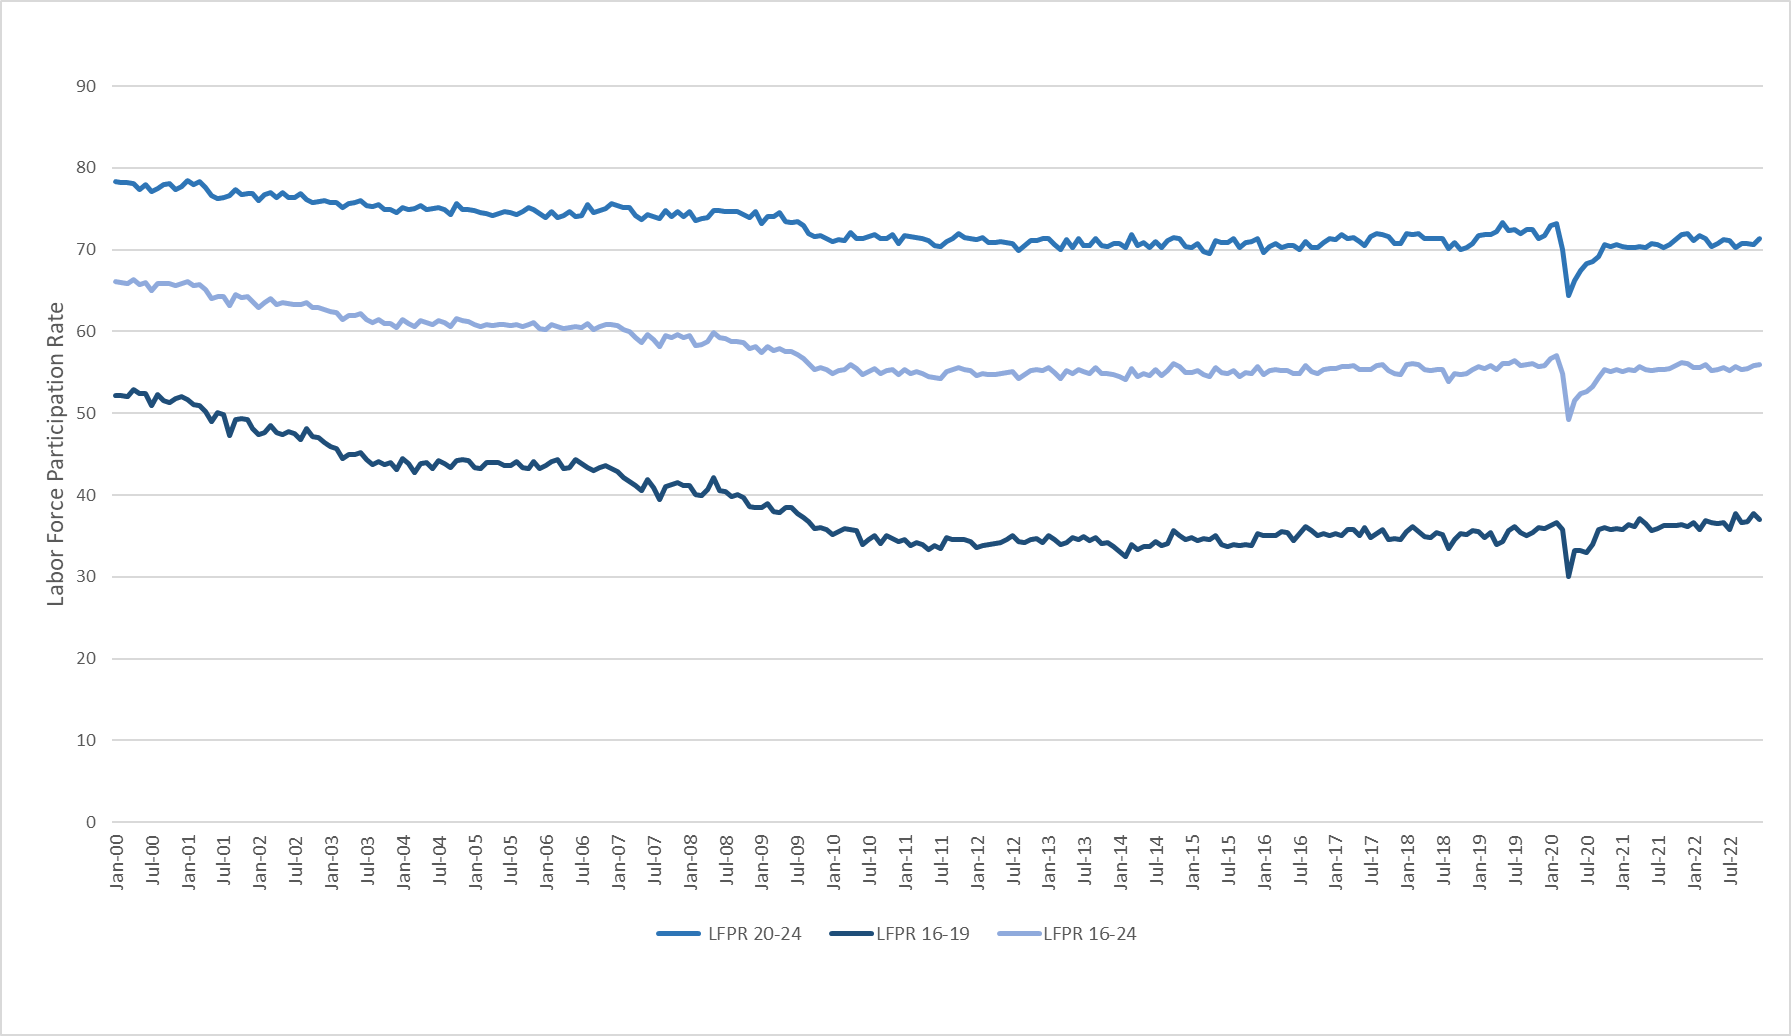
Apparently not. In fact, only about half of the decline in enrollment among teens could potentially be explained by a shift to greater labor force participation, and there has been no increase in labor force participation among 20 to 24 year olds. Labor force participation of young people aged 16 to 19 declined substantially between 2000 and 2010 and has only recovered slightly over the past ten years. The labor force participation rate for individuals 16 to 19 years old was 52% in 2000 and declined by 17 percentage points to 35% in 2010. As of December 2022, the labor force participation rate for teens aged 16 to 19 had increased to 37% (figure 3). This increase is less than half the size of the decline in the share enrolled in school. Labor force participation for individuals 20 to 24 years old also declined between 2000 and 2010 but has shown no sign of recovery. Specifically, labor force participation for 20 to 24 year olds was 77.8% in 2000, declined to 71.4% in 2010, and stood at 71.3% in December 2022 (figure 3).
3. Labor force participation rates by age, January 2000 through December 2022

How are young people spending their days? Has this changed over time?
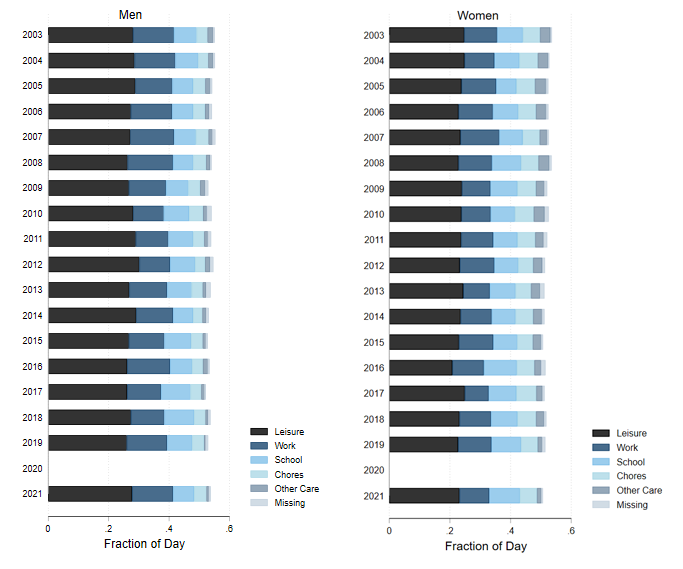
We use American Time Use Survey (ATUS) data to look for changes in how 16 to 24 year olds are spending their time as labor force participation and school enrollment rates have declined. One possible explanation for these declines could be that young people are taking on more care and other responsibilities at home rather than working or going to school and hiring outside help for childcare, elder care, and other home help services. In the figures that follow, we grouped primary activities from the time diary data into seven categories—personal care, leisure, work, school, chores, care for others, and missing—and calculated the average share of a day spent on each activity, separately for men and women. The stacked bar charts show these averages for all categories, excluding personal care, of which the largest subcategory is sleep. We show these averages separately for men and women since changes in activities may systematically differ by sex.
Overall, young people aged 16 to 24 report spending a somewhat higher share of their day—roughly 30 more minutes—on personal care in 2019 than in 2003. The increases in time spent on personal care are largely accounted for by declines in reported time spent on leisure activities, followed by declines in the percentage of time spent caring for others. Notably, we don’t see an obvious shift from time spent on school and market work toward chores and caring for others. Also notable is that the share of time spent working was largely unchanged for both young men and young women over this period, despite the sizable declines in labor force participation rates.6 This suggests that hours worked increased among those who were participating, but aggregate time use patterns do not provide a clear story regarding changes in time use related to the decline in participation in school and work.
4. Proportion of the day young men and young women spend on different activities, 2003 through 2021

Implications for individuals’ labor market prospects and the economy
It is well documented that individuals who enroll and complete more education have better labor market outcomes. Specifically, earnings increase and unemployment decreases with educational attainment, leading to corresponding declines in poverty. Further, increased educational attainment has been linked to lower mortality (Buckles et al., 2016) and incarceration (Lochner and Moretti, 2004) rates, and greater civic participation (Milligan, Moretti, and Oreopoulos, 2004). It can even have beneficial spillovers to the next generation, as maternal education has a positive impact on infant health (Currie & Moretti, 2003). As such, declining enrollment of young people in higher education will likely have adverse effects on labor market and other outcomes of this generation and may adversely affect future generations as well.
Not only will declining enrollment impact individuals and families, but declining enrollment will also likely affect growth of the U.S. economy. U.S. economic growth depends, in part, on the skills of the U.S. workforce. Thus, declining shares of young people enrolling in postsecondary education suggests that we will see associated declines in the average skill levels of the future workforce. While there has been some shift by employers toward recognizing skills obtained through channels other than formal education, the continued high average rate of return to a college education implies that the need for workers with at least some college education has not changed significantly.
Given the individual and societal ramifications of declining enrollment rates, it will be important for researchers and policymakers to understand the causes, whether they are due to a perceived increase in the riskiness of the investment, decreased affordability, or a decline in the value of education. Further, to the extent that enrollment rate declines today instead reflect delayed enrollment, community colleges may play an important role in helping this generation attain skills later while also balancing family and work. If this is the case, community college enrollment will likely recover somewhat, and these colleges will need continued investment to meet future demand.
Notes
1 Estimates of the resident population aged 18 to 21 peaked in 2011 at 18.1 million. Between 2011 and 2019, the estimated number of residents in this age range declined by 5.4%. See Digest of Education Statistics Table 101.10.
2 Enrollment in the smaller two-year private for-profit sector also declined over this period, but it makes up less than 2% of total enrollment. Enrollment in the even smaller two-year private nonprofit sector increased.
3 The enrollment rate of recent high school completers is based on October CPS data on the share of individuals aged 16 to 24 who had completed high school earlier in the calendar year and report being enrolled in college. See Digest of Education Statistics Table 302.10. Authors’ calculations using October CPS data from IPUMS-CPS, University of Minnesota, www.ipums.org for 2021.
4 NSC Research Center First Look Fall 2022 data are reported separately for undergraduate and graduate enrollment. We take a weighted average of the enrollment changes using undergraduate and graduate enrollment shares for 2020 from Digest of Education Statistics 2021 (Table 303.60).
5 Authors calculations based on the Annual Social and Economic Supplement of the Current Population Survey from IPUMS-CPS, University of Minnesota, www.ipums.org. Overall, the percentage of 16 to 24 year olds enrolled in either high school or college fell from 60% in 2011 to 58% in 2019.
6 Estimates of labor force participation from the ATUS differ in levels from those in the CPS data; however, the declines are even larger. Between 2003 and 2019, the labor force participation rate for men 16 to 24 years of age in the ATUS fell by 11 percentage points, while the corresponding rate for women fell by 9 percentage points.


