

Introduction and summary
Public school choice in Chicago has been in existence for more than 30 years and has noticeably expanded over the past 15 years. In 1987, United States Secretary of Education William Bennett labeled Chicago’s public schools the “worst in the nation.” At that time, reportedly one-half of Chicago’s 64 high schools ranked in the bottom 1 percent on the ACT among schools that administered the test.1 Bennett further said Chicago parents should consider private school options, arguing that increased competition from private schools would improve the performance of Chicago Public Schools (CPS). Since then, private school enrollment in Chicago among 15 year olds has actually fallen—from 22.3 percent in 1990 to 11.9 percent in 2015.2 At the same time, the quality of CPS schools has generally improved. Average ACT scores have risen, while dropout rates have declined (Allensworth et al., 2016).
In the nearly 30 years since Bennett’s statement, CPS has implemented a number of policies aimed at improving school performance, some of which led to a dramatic increase in public high school options. Specifically, 2002 to 2010 was a period of rapid expansion in the number of high schools available to students within the CPS system. Major reforms such as Renaissance 2010 and the Chicago High School Redesign Initiative focused on increasing the number of high-quality public school options by splitting up large high schools, creating new small high schools by design, and spurring the opening of a number of charter high schools. During this period, the district also opened more selective-enrollment high schools and special programs within high schools, such as International Baccalaureate (IB), both of which admit students based on prior achievement. As a result, the number of public high schools in Chicago grew from 76 to 138 over the 15-year period from 2002 to 2016.
The expansion of school choice within CPS raises a number of questions: Who enrolls in these different types of schools? How does choice change the racial and academic composition of schools? What are the time costs students face when exercising choice? Are these additional choices improving the quality of education available to Chicago’s students? In this article, we provide descriptive evidence on the enrollment decisions of first-time ninth-grade students and how they have changed over this 15-year period. We outline some of the arguments for and against school choice and then examine changes in various characteristics related to those arguments and the questions above: changes in who exercises choice by opting out of assigned schools, student sorting by race and academic achievement, student exit from and entry to the school district, and the distance students travel to school—all things that might change as a consequence of increased school choice. We present these as descriptive rather than causal relationships and do not address how traditional outcomes such as test scores and graduation rates have changed, although we do note that they have improved over this period as well.
Overall, the share of CPS students enrolling in their assigned neighborhood high school has been steadily decreasing. We find that the students most likely to enroll in a high school other than their assigned school are African American students and those living in the poorest neighborhoods. The most popular option for these students is attending a charter high school. Students with very high test scores are also likely to attend a high school other than their neighborhood school; their most popular choice is a selective high school that admits students based on academic performance. While racial segregation at the school level has not changed dramatically with the expansion of choice, we find that students are somewhat more likely to attend a school with peers who have similar incoming test scores, especially students from lower-income neighborhoods. Also, as a direct consequence of students enrolling in high schools that are not their neighborhood high school, we find an increase in the average distance between where students live and where they attend high school. Finally, a growing share of CPS eighth-grade elementary students are subsequently enrolling in a CPS high school for ninth grade rather than leaving the district for high school, suggesting that the high school options offered by the district have become more attractive to parents and students.
In the following section, we discuss the arguments for and against expanding school choice, along with some of the relevant literature. Next, we describe the types of high school choices that are available to families and students in Chicago and how they have changed over a 15-year period between 2002 and 2016, followed by a description of the data and analytic sample of first-time ninth-graders in CPS. Finally, we look at the potential consequences of choice and discuss their implications.
Background and literature
Arguments in favor of school choice include offering a better match between students and schools, creating more racially integrated schools, and improving school quality. Traditionally, students were assigned to attend a public school based on the neighborhood in which they resided. Breaking the relationship between where students reside and where they go to public school has the potential to make students and families better off. In particular, it may allow parents to enroll their children in schools that better match their own preferences over school curriculum and programming or their children’s needs without having to choose a private school or relocate to another neighborhood or school district. In the same way, expanding school choice may also attract new families to the district. Further, in cities where there is a great deal of residential segregation based on race and ethnicity, school choice in the form of magnet schools with race quotas has been used as a way to create integrated public schools on a voluntary basis.
Of course, the idea that public school quality will improve due to the expansion of choice is the argument that receives the most attention. This idea is most commonly associated with Milton Friedman (1962) and his belief that the government should finance education through vouchers that families could spend directly on “approved” educational services rather than through the government provision of education. If schools are competing with one another to attract students and the public and/or private dollars associated with their enrollment, then theory would suggest that schools would improve or change the programs they are offering in order to attract students. Further, if this competition makes public schools more efficient, then, theoretically, student achievement could increase without increasing the cost of public schooling. In this view of choice, a school that did not offer a high-quality education would shut down because it could not attract enough students (or funding) to operate. As a result, only high-quality public schools would remain. Public schools, however, do not operate within the free market, and in Chicago many public high schools remain open despite chronic low performance and dwindling student enrollment. In fact, Chicago has typically not closed traditional public high schools out of concern for student safety related to mixing students from different neighborhoods and asking students to cross gang lines to travel to school (Chicago Public Schools, Commission on School Utilization, 2013).
In addition to theoretical arguments in support of school choice, there are established literatures that look at the impact of attending specific types of choice schools (for example, selective/exam schools, charter schools) on academic outcomes. A growing body of evidence suggests that any apparent academic benefits of attending exam or selective schools with admission criteria based on academic performance are likely due to selection (Abdulkadiroğlu, Angrist, and Pathak, 2014; Dobbie and Fryer, Jr., 2014; Clark, 2010; and Barrow, Sartain, and de la Torre, 2016). The evidence on charter schools is mixed—lottery studies find mixed or modest (Hoxby and Rockoff, 2005; Hoxby and Murarka, 2009; and Gleason et al., 2010) to large (Dobbie and Fryer, Jr., 2013; Angrist et al., 2012; and Abdulkadiroğlu et al., 2016) positive impacts on student test scores. Finally, even in systems of choice, families still have the option to sort residentially to a neighborhood with a school they prefer, and there is evidence that families are willing to pay more to live in a neighborhood with a school that has higher test scores (see, for example, Black, 1999; Barrow, 2002; Bogart and Cromwell, 1997; Figlio and Lucas, 2004; and Gibbons, Machin, and Silva, 2013).
There are also arguments opposing increased school choice that relate to potential costs, including increased uncertainty, disparate access to “good” schools, and more time spent commuting to school. One common concern is that the uncertainty about how to apply to high school and which high school a student will be able to attend creates confusion and increases anxiety for students and their families. Some further argue that the anxiety and confusion may be highest among the most-disadvantaged students and families in the district who may lack the knowledge to navigate the school choice system. A related concern is that neighborhood schools are left with the students who are most difficult to educate, while choice schools disproportionately attract the higher-achieving, higher-income students who are arguably less costly to educate (Fiske and Ladd, 2000). Critics also assert that charter schools push out low-achieving students and students with serious behavioral issues, whereas traditional public schools must serve the students that come through their doors. There are, additionally, direct costs to more students attending school outside of their neighborhood in terms of transportation time and costs. Time costs are certainly borne directly by students and their families, but to the extent that a school district provides transportation to its students, increased choice may lead to increased transportation costs for the district as well.
Contrasting with the idea that choice might be a strategy for mitigating segregation, there are concerns that increased choice may lead to resegregation of public schools. There is prior research about how school choice might exacerbate the kind of student sorting that critics fear (for example, generating more racial isolation and concentrating high-achieving students into a small number of schools). Indeed, there are several studies outside the United States that find increases in student sorting across schools in terms of ethnicity, immigration status, ability, and socioeconomic status associated with the adoption of policies that increased parental choice and competition. See, for example, Fiske and Ladd (2000) on New Zealand, Söderström and Uusitalo (2010) on Stockholm, Sweden, and Burgess et al. (2004) on England. In the United States, Bifulco and Ladd (2007) find that the growth of charter schools in North Carolina increased the racial isolation of black and white students; and more generally, Hoxby (2000) finds that racial segregation increases within a metropolitan area as the number of schools increases. Taken together, the research suggests that the expansion of school choice in Chicago may result in more sorting of students on a variety of dimensions.
High school options in Chicago
CPS is an open enrollment district. Each student has a designated attendance-area school that is located close to their home, but students can apply to other neighborhood schools that have open seats and other special programs and schools across the district (for example, charter schools, magnet schools, or IB programs).3 The options vary widely when it comes to their performance rating and academic composition—from selective-enrollment schools that have admission criteria and serve very high-achieving students to many popular neighborhood schools to a number of poorly performing schools that the district views as needing “intensive support” and potentially being subject to sanctions.4 Even within a single neighborhood school, there may be a number of specialized programs, such as IB, fine arts, honors tracks with accelerated coursework, and career and technology education (CTE) focused on developing skills in programs ranging from agriculture to information technology. These programs within schools often have admission requirements based on students’ prior academic achievement. In 2016, CPS eighth-graders were faced with more than 300 potential high schools or special programs within schools when making decisions regarding where to apply or enroll in high school.
On its website and in guidebooks published annually, CPS provides detailed information about each school, including overall performance ratings as well as average test scores, graduation rates, and student and teacher reports on the school environment. This information includes instructions on any relevant application processes. Families also have access to high school fairs and individual school open houses. The application process in an open enrollment district can be a burden on families, so CPS has taken steps to streamline it. Many of the admission decisions and lotteries are now run by the CPS central office, with the major exception being charter schools, for which students must apply to individual schools or charter management organizations. For the 2018–19 school year, CPS has adopted a single application system for most CPS high schools, with the goal of eventually having 100 percent of CPS high schools participating.
Regardless of any hurdles, perceived or actual, many CPS high school students opt to attend a school other than their default neighborhood high school. In 2002, the first year of our data, 51 percent of first-time ninth-grade students opted out of their attendance-area high schools. As shown in figure 1, this percentage has been growing steadily over time.5 By 2016, 75 percent of ninth-graders chose to attend a school other than their assigned neighborhood high school. In this section, we describe the types of choices available to students, as well as application and admission requirements. We use these categories of schools throughout the article to describe how the choices students make have changed over time.
Neighborhood high schools
Neighborhood high schools are the default high school option for CPS students. If a student lives within a school’s attendance boundaries, there is no application process and the student is guaranteed a seat.6 Students living outside the attendance boundaries must apply; if there are more applicants than seats available, students are entered into a randomized lottery for admission. There also may be special programs within neighborhood high schools to which students can apply. For example, Lake View High School offers a science, technology, engineering, and mathematics (STEM) program—students within the neighborhood boundary are automatically admitted, while students from outside the boundary must participate in the school’s general lottery if Lake View receives more applicants than seats available. In contrast, other neighborhood high schools have programs within their schools that require applications for admission regardless of whether the student lives in the attendance area. For example, Senn High School runs an IB Diploma Programme, and all interested students must apply and meet minimum academic standards to be admitted to the program regardless of where the student lives. Admission requirements vary across high schools for these special programs, although nearly all programs have some sort of minimum eligibility requirements based on standardized test scores.
Figure 1. Percentage of first-time, ninth-grade students attending a choice school

Sources: Authors’ calculations using Chicago Public Schools (CPS) data available from the University of Chicago Consortium on School Research, the CPS High School Guide (various years), and the CPS Board of Education’s documentation of board actions.
In later discussion, we refer to a neighborhood high school as a student’s “assigned” high school if they are attending the neighborhood high school that is also their attendance-area school. If a student is attending a neighborhood high school that is not their attendance-area high school, we say that the student is attending an “other neighborhood” high school.
Other citywide high schools
In addition to special citywide programs within neighborhood high schools, there are also entire high schools that offer specialized curricula, specifically career academies, magnet, and military schools. Career academies offer school-wide CTE programs that include area-specific coursework and curricula, as well as internships at local businesses. Some of these schools have minimum-achievement requirements and others do not, although all require applications and a lottery if the school is oversubscribed. Magnet schools generally offer accelerated curricula or specialize in particular subject areas such as the fine arts. These schools usually have no attendance boundaries (although preference is sometimes given to students who live within 1.5 miles of the school), require an application, have admissions criteria, and admit eligible students through a lottery. Military academies have a college-preparatory curriculum, but they also focus on developing leadership and teamwork skills. Similar to the selective-enrollment high schools, military academies admit students based on an application score that is constructed from seventh-grade standardized test scores, final seventh-grade grades in core subject areas, and an admissions test.
Charter high schools
Charter schools are an increasingly available and popular option in Chicago. They are funded by the district but are not subject to the same rules and regulations as other CPS schools. Charter school students take the same tests required by the state as other CPS students, and these scores are reported to the CPS central office, but the schools do not have to report other information such as individual student grades or disciplinary infractions. Charter schools that have more applicants than seats available run their own lotteries for admissions rather than participating in a district-run application process, so interested students must contact schools or charter networks directly to apply. Even if schools are undersubscribed, students must still apply for admission.
Selective-enrollment high schools
These high schools are purposefully designed to meet the needs of the district’s most academically advanced students and offer a rigorous, college-preparatory curriculum. With selective-enrollment high schools, the application process is available online and the criteria for admission are well publicized. Admission is based on seventh-grade standardized test scores, final seventh-grade grades in core subject areas, an admissions test, and, in part, on the neighborhood in which a student lives. The district divides the city’s census tracts into four tiers based on socioeconomic status (SES) and elementary school performance. Seats are reserved at each selective high school for students living in each of the four SES tiers. These SES admission quotas were put into place for the first time for the cohort of ninth-graders entering high school in the fall of 2010.7 We believe that all other districts make admissions decisions for these types of high schools based solely on academic performance, so CPS is unique in that it reserves seats for high-achieving students from low-income neighborhoods. All applicants rank up to six selective-enrollment high schools on their application. In 2013, these selective schools received over 14,000 applications for 4,100 seats.
In figure 2, we display the location of each of the CPS high schools in 2016. The circles on the map denote a school and the color of the circle represents the type of school (corresponding to the types discussed previously in this section); black lines represent census tract boundaries corresponding to the 2010 definitions. High schools of all four types are located throughout the city. There has been a concerted effort by the district to open selective high schools on the South Side of the city to increase access for students from more-disadvantaged neighborhoods. It is also interesting to note that the charter school locations are relatively dispersed, although there is a popular perception that these schools tend to locate on the West and South Sides of the city in neighborhoods with high African American populations.
Figure 2. Location of CPS high schools by type, 2016

Sources: Authors’ mapping based on school address files from University of Chicago Consortium on School Research; and authors’ categorization of school types based on Chicago Public Schools (CPS) data available from the University of Chicago Consortium on School Research, the CPS High School Guide (various years), and the CPS Board of Education’s documentation of board actions.
Changes in school types over time
Figure 3 summarizes the number of high schools by type in each year. For the purposes of this figure, each school is only counted once, so any high school with an attendance area is categorized as a neighborhood high school. From 2002 to 2016, the total number of high schools in our sample increases from 76 to 138, despite declines in overall enrollment. In 2002, we identify 62 schools as neighborhood or other citywide high schools. By 2016, we identify 80 schools in these categories. The number of schools in the other citywide high school category went from 11 in 2002 to 30 in 2016, with a net decline of one neighborhood high school over this same period (from 51 to 50).8 The number of charter and selective high schools also expanded over this period. There were seven of each type in 2002. By 2016, there were 11 selective high schools and 47 charter high schools.9
Figure 3. Count of Chicago public high schools by type

Sources: Authors’ calculations using Chicago Public Schools (CPS) data available from the University of Chicago Consortium on School Research, the CPS High School Guide (various years), and the CPS Board of Education’s documentation of board actions.
Data and analytic sample
In order to look at the expansion of high school choice in Chicago, we assemble CPS enrollment records on active students from spring 2002 through spring 2016, which include basic demographic information as well as census block group codes that are generated by the University of Chicago Consortium on School Research using students’ address of record. The University of Chicago Consortium also uses census and American Community Survey (ACS) socioeconomic data at the census block level to create proxies for student’s family background characteristics. We make use of their poverty/income index, which is based on median family income and the percentage of males employed in the census block group and put census block groups into four quartiles (weighted by the number of first-time ninth-grade students).10 To these data, we merge distance measures from student home census block groups to CPS high schools.11 Throughout, we limit our analysis to the school enrollment decisions of first-time ninth-grade students.
We also use test score data to describe, for example, how the choices made by low-achieving students compare with those made by high-achieving students. CPS students take standardized tests in the spring of grades 3–8. From these data, we make use of a University of Chicago Consortium predicted eighth-grade test score in order to calculate incoming achievement for high school students.12 For table purposes, we categorize students into quartiles of incoming achievement by cohort using this measure.13
We categorize the high school each student attends into one of five types—assigned high school (the neighborhood high school corresponding to the student’s address), other neighborhood high school (any high school with an attendance area that is not the student’s assigned high school), selective high school (includes only the CPS selective-enrollment high schools), charter high school (any charter high school), or other citywide high school (any high school that does not fall into one of the first four categories).14 We are not able to identify specific programs in which students are enrolled, so some students enrolled at a selective high school, for example, may actually be enrolled at a program housed in a selective high school building but not in the selective-enrollment high school program. Likewise, a student enrolled in a special program within their neighborhood high school will be categorized as enrolled in an assigned high school, whereas a student enrolled in that same program but living outside of the attendance area will be categorized as enrolling in an other neighborhood high school. Further, in 2007, we are unable to identify a student’s assigned high school, so we omit that year from the figures and discussion below that focus on the type of school attended.
Changes in district and city demographics
While the high school landscape has changed over the last 15 years in Chicago, the district has also faced declining enrollment, particularly over the past seven years. In figure 4, we present data on total grade 9 enrollment from 2002 through 2016 in a stacked bar figure with each color representing one of three race/ethnicity groups—African American students in orange, Latino students in green, and all other races combined in blue. Several recent trends are visible in this picture. Total high school enrollment in ninth grade has declined by 12 percent since peaking in 2009. This decline is entirely due to decreasing enrollment of African American students. From 2009 to 2016, ninth-grade enrollment by African American students fell by 47 percent compared with a 10 percent increase in ninth-grade enrollment for Latino students and a 9 percent increase in enrollment for students of other races. As a result, ninth-grade cohorts went from being 52 percent African American, 33 percent Latino, and 15 percent other in 2002 to being 38 percent African American, 47 percent Latino, and 14 percent other in 2016.15
Figure 4. High school student enrollment by race/ethnicity

Source: Authors’ calculations using Chicago Public Schools (CPS) data available from the University of Chicago Consortium on School Research.
Figure 5. Population of Chicago 15 year olds by race/ethnicity

The observed decline in CPS ninth-grade enrollment reflects in part a decline in the relevant-aged population of Chicago over this period and in part a change in who enrolls in CPS; the decline in the number of 15 year olds in the city has been much steeper than the decline in CPS ninth-grade enrollment. In figure 5, we present data from the decennial census and the American Community Survey for available years on the number of 15 year olds by race/ethnicity in Chicago.16 The total number of 15 year olds living in Chicago declined by 26 percent between 2009 and 2015, reflecting a 34 percent decline in the number of African American 15 year olds, a 9 percent decline in the number of Latino 15 year olds, and a 35 percent decline in the number of 15 year olds in the other race category. As a result, the population of 15 year olds went from 44 percent African American, 34 percent Latino, and 23 percent other in 2000 to 38 percent African American, 43 percent Latino, and 19 percent other in 2015. These demographic trends will be important to keep in mind as we examine trends in choice over this same period.
Figure 6. First-time, ninth-grade student enrollment by school type

Sources: Authors’ calculations using Chicago Public Schools (CPS) data available from the University of Chicago Consortium on School Research, the CPS High School Guide (various years), and the CPS Board of Education’s documentation of board actions.
How have high school enrollment patterns changed?
We look broadly at the types of public high schools that students enroll in and how that changes over time. Figure 6 displays the number of grade 9 students enrolled in each type of high school from 2002 through 2016, with a gap in 2007 due to missing data on assigned high schools. In 2002, roughly one-half of all ninth-grade students were attending their assigned high school, with one-quarter of the total opting to enroll in an other neighborhood high school, and the remainder equally split between enrolling in a selective high school and an other citywide high school. The most noticeable change over time is the growth in charter high school enrollment. Roughly 500 grade 9 students were enrolled in a charter high school in 2002, but by 2016 the ninth-grade charter enrollment had increased to nearly 6,500 students— roughly one-quarter of all CPS ninth-graders. Selective high school enrollment also increased somewhat over this period as CPS expanded the number of selective high school options by converting existing high schools into selective high schools. As a percentage of total grade 9 enrollment, selective high school enrollment increased from 9 percent in 2002 to nearly 15 percent in 2016.
Growth in enrollment at charter and selective high schools has come at the cost of enrollment at neighborhood high schools. The share of grade 9 students enrolled at their assigned high school declined from 49 percent in 2002 to only 25 percent in 2016. The share enrolled at other neighborhood high school programs also declined, from 26 percent to 18 percent. These declines in enrollment occurred with no significant reduction in the number of neighborhood high schools (previously shown in figure 3, p. 8). As a result, the average ninth-grade cohort at a neighborhood high school declined in size from about 390 students to 225 students between 2002 and 2016 (counting students enrolled in both assigned and other neighborhood high schools). The decline in ninth-grade cohort size at the other citywide high schools was relatively large as well, falling from around 310 students to 140 students as the number of other citywide high schools grew from 11 to 30.17 As a result, five neighborhood high schools have a ninth-grade cohort with 50 or fewer students, and five other citywide high schools have a ninth-grade cohort with fewer than 50 students, arguably too small to offer a comprehensive high school curriculum or an array of extracurricular activities.18
Different choices for different students
It is a popular notion that there are winners and losers in school choice and that not all families have access to a wide variety of schooling options. There are concerns, for example, that students from more-affluent families may have access to a greater variety of choices because they can navigate the system well, while students and families with fewer resources or less knowledge of the system may have to rely on their assigned high schools. In fact, we show empirically that the students who are most engaged in choice19 are those living in the poorest neighborhoods.20 At the same time, it is true that academically high-performing students also engage in a lot of choice. These two groups of students make different choices and have different options available to them, but revealed preferences suggest that there is high demand for school choice for students from a variety of backgrounds. In this section, we provide evidence about the choices that students in different subgroups (racial/ethnic, gender, prior achievement, and neighborhood income) make when enrolling in high school as ninth-graders and how those choices have changed over time.
Table 1 shows how students within each subgroup are distributed across types of schools for 2002 (left panel) and 2016 (right panel). The top rows of the panels indicate the percentage of all first-time ninth-grade students in that year attending each type of high school, and subsequent rows indicate the percentages of each subgroup of students in that year attending each type of high school. In 2002, nearly one-half of all students attended their assigned high school (49.5 percent); by 2016, only one-quarter attended their assigned high school (25.0 percent), with just over one-quarter attending a charter high school (26.4 percent) and 15 percent attending a selective high school. Here, we focus on how students in 2016 were engaging in choice, while providing some contrasts with choice in 2002.
In 2016, African American students were much less likely to attend an assigned high school than students of other races (14.4 percent compared with 32.1 percent of Latino students and 29.9 percent of other students). Instead, about one-fifth of African American students attended an other neighborhood high school (20.1 percent), one-fifth attended an other citywide high school (18.1 percent), and one-third attended a charter high school (35.9 percent). Also noteworthy, the most popular option among non-African American/non-Latino students was to attend a selective high school (38.4 percent). Male and female students are distributed similarly across school types, with girls slightly more likely to attend selective high schools than boys, and boys slightly more likely to attend an assigned or charter high school than girls. In 2002, Latino students, boys, low-achieving students, and students from higher-income (third- and highest-quartile) neighborhoods were the most likely to attend their assigned high school. This remained true in 2016, although for all groups there had been a decline in the share choosing to enroll in their assigned high school. The percentage decline in assigned high school attendance was higher among African American students than Latino or other students, with the opening of more charter high schools providing an attractive option for African American students.
We also find differences in school enrollment decisions by incoming achievement. Nearly one-third of the lowest-achieving students attended an assigned high school in 2016 (31.4 percent) compared with just over one of every eight highest-achieving students (12.7 percent). In a district such as CPS where there are special schools and programs that base admission on a student’s prior test scores, students with high levels of achievement will have more options available to them. As such, nearly half of high achievers attended a selective high school (45.3 percent) in 2016 compared with less than 10 percent of students in any lower quartile of test scores. In 2002, students with test scores in the top quartile were also the most likely to attend a school other than their assigned high school. However, the largest increase in school choice was among students in the lowest quartile of test scores in eighth grade—only one-third exercised school choice in 2002 compared with more than two-thirds in 2016. Almost all of this increase in choice comes from enrollment in charter high schools.
Table 1. Distribution of students across CPS type by subgroup, 2002 and 2016

Source: Authors’ calculations using Chicago Public Schools (CPS) data available from the University of Chicago Consortium on School Research.
Students also make different choices based on the level of income in their neighborhood. In 2016, few students who lived in the lowest-income neighborhoods attended their assigned high school (13.5 percent), suggesting families located in very poor neighborhoods prefer other schooling options to their assigned high school. These numbers contrast with the perception that most students living in poor neighborhoods get “stuck” in their assigned high school; in fact, a large number of them attend another school. For students living in the poorest neighborhoods, charter high schools are a popular option, with 36.6 percent of students attending a charter high school (compared with 18.0 percent of students living in the highest-income neighborhoods). It is also noteworthy that while charter high school enrollment has increased across the board (not surprising because there were very few charters at the beginning of our period), the increase in enrollment comes disproportionately from less-advantaged groups, such as students with relatively low test scores and students living in relatively high-poverty neighborhoods. On the other hand, students living in the highest-income neighborhoods are the most likely to attend their assigned high school (30.9 percent), providing suggestive evidence that there is still school choice through residential sorting even within school systems that have a lot of nonresidential-based choice. That is, families living in higher-income parts of the city are more willing to attend their assigned high schools than families from poorer parts of the city.
What does increased choice mean for the school district?
Questions remain about the consequences of increased choice, and we provide empirical evidence in this section. Specifically, we look at changes from 2002 to 2016 in the aggregate characteristics of schools by type, the sorting of students across schools (in terms of race/ethnicity and prior academic achievement), the entry and exit of students from the district, and distance traveled to attend high school. It is important to note that the suggestive evidence we provide does not isolate the causal effects of school choice on these factors, as many reforms were occurring over this period.
Overview of student characteristics by school type
The differences in choices made by students discussed above generate differences in average student characteristics by school type. In table 2, we display the characteristics of the students who attend each type of school. The numbers should be read down the column for each year and school type (for example, in 2002 the overall racial/ethnic breakdown of the district was 51.7 percent African American, 33.4 percent Latino, and 14.9 percent other). Because we contrast changes over time in the distribution of student characteristics within each type of school, we display the 2002 and 2016 averages side by side. We note that these are average characteristics by year and school type, so they will mask some heterogeneity in student body composition across schools within year and type.
Relative to the district as a whole in 2016, neighborhood high schools were serving a larger share of Latino students, boys, and students from higher-income neighborhoods. They were also enrolling students with relatively lower eighth-grade test scores. These comparisons to the district as a whole are quite similar to the comparisons in 2002, with the exception that neighborhood high schools were serving somewhat higher-income students in 2016 than they were in 2002. In 2016, 55 percent of neighborhood high school students came from neighborhoods in the top two income quartiles compared with 51 percent in 2002.
Table 2. Student composition by CPS type, 2002 and 2016

Source: Authors’ calculations using Chicago Public Schools (CPS) data available from the University of Chicago Consortium on School Research.
Other citywide high schools as a sector have become noticeably more balanced in terms of their racial/ethnic distribution. In 2016, 44 percent of other citywide students were African American, 46 percent were Latino, and 11 percent were other, relatively close to the overall distribution in the district. In contrast, charter high schools serve a relatively high share of African American students and relatively few other race students, and selective high schools serve a relatively high share of other race students and low shares of African American and Latino students.
Other citywide high schools have also become more balanced in their shares of girls (51 percent) and boys (49 percent) compared with 2002, when 54 percent of other citywide high school students were girls and 46 percent were boys. Charter high schools are also relatively balanced by gender, being 51 percent male. In contrast, selective high schools continue to serve a higher share of girls—56 percent in 2016, up from 55 percent in 2002.
Not surprisingly, other citywide high schools, which often base admission on prior student achievement, serve somewhat higher shares of students in the upper quartiles of the eighth-grade test score distribution. They also draw somewhat higher shares of students from low-income neighborhoods. Fifty-two percent of other citywide high school students in 2016 scored above the median in eighth grade (compared with 63 percent in 2002), and 28 percent came from the lowest-income neighborhoods (down from 39 percent). Charter students as a whole were much more disadvantaged. In 2016, 66 percent of charter high school students scored below the median student on the eighth-grade test, and 35 percent came from the lowest-income neighborhoods. At least in Chicago, it does not appear as if charters are “cream-skimming” on these two dimensions. There is no doubt that the selective high schools serve the most-advantaged students in the district—their students are both higher achieving and more likely to be from a neighborhood in one of the top two income quartiles. However, the expansion of selective high schools between 2002 and 2016, perhaps combined with the use of neighborhood socioeconomic status in the admission decisions, has increased the representation of students from neighborhoods with below-median levels of income—40 percent of selective high school students came from these neighborhoods in 2016 compared with 30 percent in 2002. Perhaps for these same reasons, selective high schools as a whole are serving a larger share of students in the third quartile of achievement, even though the highest-achieving students were more likely to enroll in a selective high school in 2016 than in 2002 (see table 1).
Racial composition of schools
School choice may increase racial segregation if students opt out of their assigned high school to attend high schools with other students of the same race. For example, in Chicago, neighborhood high school catchment areas are relatively large, potentially covering a diverse set of neighborhoods. CPS students and their families may use school choice to opt out of neighborhood high schools into schools that are more homogenous in terms of race. In fact, research from other settings (cited earlier) suggests that segregation may indeed increase with the expansion of school choice. On the other hand, Chicago is quite residentially segregated and school choice operating through programs such as magnet schools has been a strategy for reducing school segregation. If choice schools attract students from a wider and more diverse population than the neighborhood catchment areas, then high schools could become less segregated as students exercise choice. In this section, we present evidence on how much racial segregation exists in CPS high schools and the extent to which it has changed over time, in order to examine whether the expansion of choice is associated with increased segregation.
Figure 7. 2002 race/ethnicity enrollment shares by high school, first-time ninth-graders

Source: Authors’ calculations using Chicago Public Schools (CPS) data available from the University of Chicago Consortium on School Research.
Figures 7 and 8 show the racial composition of each high school in the district in 2002 and 2016, respectively, with schools sorted by the percentage of students who are African American.21 What is striking in both figures is how many high schools have virtually no racial diversity at all. In 2002, 31 out of 76 high schools (40 percent) were at least 90 percent African American and another three high schools (4 percent) were at least 90 percent Latino. In 2016, 45 out of 138 high schools (30 percent) were at least 90 percent African American, and 15 schools (11 percent) were at least 90 percent Latino. Thus, in 2016, 54 percent of African American students attended a high school that was at least 90 percent African American, and 24 percent of Latino students attended a high school that was at least 90 percent Latino.
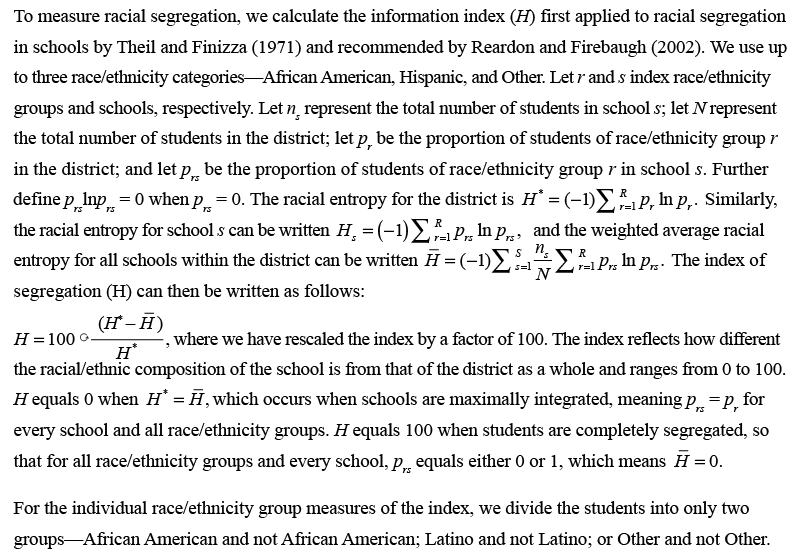
In table 3, we present data for assessing how racial segregation has changed in CPS over this period of choice expansion using the information index of racial segregation introduced by Theil and Finizza (1971) and recommended by Reardon and Firebaugh (2002). We have up to three mutually exclusive race/ethnicity groups—African American, Latino, and Other. We rescale the index so it ranges from 0 to 100. The index reflects how differently race/ethnicity groups are sorted across schools relative to their overall representation in the student population. For both years, we present the segregation indexes overall and separately for African American, Latino, and other-race students. For these latter calculations, we employ a two-group version of the index. For example, the segregation index for African American students categorizes students as either African American or not African American. In each year, we present the statistic based on the schools in which students are actually enrolled (the “Observed” column), as well as a counterfactual calculation of the same statistic that presumes each student enrolls in their assigned neighborhood high school (the “Counterfactual” column). A value of 0 for the overall version of the index would mean that schools were “perfectly” integrated; that is, every school enrolled students in proportion to their share in the overall student population. A value of 100 would mean that students were completely segregated; that is, each school contains students of only a single race/ethnicity group. See box 1 for more details.
Figure 8. 2016 race/ethnicity enrollment shares by high school, first-time ninth-graders

In the 2001–02 school year, the value of the overall segregation index is 43.5. The group-specific values of the segregation index in the 2001–02 school year indicate that African American students are relatively more segregated than Latino and other students. The value of the index is 45.6 for African American students, 30.1 for Latino students, and 15.8 for other students.
Between the 2001–02 and 2015–16 school years, we see a slight increase in the overall measure of segregation from 43.5 to 44.7, a slight decline in the segregation of African American students, and slight increases in the segregation of Latino and other students. The overall index suggests that the expansion of school choice has not led to a dramatic rise in racial segregation in CPS high schools; high schools were segregated in 2001–02 and remain segregated in 2015–16.
We offer another way to think about changes in racial segregation in the counterfactual column of table 3. Here, we show the counterfactual calculations of the information indexes, assuming that all students attend their assigned high school. Of course, this exercise relies on the strong and unlikely assumption that residential-location decisions are not affected by access to school choice. Further, we must assume that the number of neighborhood high schools would stay constant even if all students attended them; in reality if all students attended their assigned high school, the number or capacity of neighborhood high schools would have to increase.22 This second comparison requires looking within each year and comparing the counterfactual column to the observed column. In this exercise, we also see relatively small differences in our estimates of racial and ethnic segregation between the counterfactual estimates and the estimates based on actual high school attended. With the exception of other-race students, there is somewhat less segregation in the observed distribution of students across high schools than if all students attended their assigned neighborhood high school. Based on this evidence, school choice has not mitigated the high residential segregation in the district.
Box 1. Information theory index of segregation
Academic achievement composition of schools
Another common concern about school choice is that schools of choice—such as charter or magnet schools—attract the most-motivated or highest-performing students, leaving neighborhood schools with harder-to-serve populations whose students could benefit from access to stronger-performing peers and associated resources. If this is the case, empirically we would expect the distribution of prior achievement across schools to be wider—with a widening gap in incoming achievement of students between neighborhood and choice schools. In other words, the expansion of school choice might exacerbate sorting of students by achievement.
Table 3. Racial segregation across schools

Source: Authors’ calculations using Chicago Public Schools data available from the University of Chicago Consortium on School Research.
In figures 9 and 10, respectively, we show the distribution of incoming achievement for each high school in the district in 2002 and 2016. Each boxplot in these figures represents the distribution of incoming achievement at a given CPS high school. The boxplots are sorted from the school with the lowest average achievement to the highest. In both years, the lowest-ranked school is a neighborhood high school and the highest-ranked school is a selective high school. Between 2002 and 2016, the average achievement level at entry increased at all CPS high schools, with roughly 16-point increases in average test scores at both the bottom- and top-ranked schools based on average eighth-grade test scores of incoming ninth-grade students (an increase of 0.9 of a standard deviation based on the 2002 distribution). Visually, we do not see evidence of a large increase in sorting across schools on prior achievement.
Table 4 provides statistical evidence that there has indeed been some increase in sorting across schools by prior achievement. Each cell in the table represents the adjusted R-squared from a regression of student-level standardized eighth-grade test scores on school fixed effects. It tells us the share of the variation in test scores that is explained solely by the high school the student attends. The first column uses all students, while the subsequent columns use subsamples of students based on our neighborhood income categories. We think it is important to look at these data by neighborhood income level due to the fact that selective and some other citywide high schools explicitly consider neighborhood SES in the admission process. Overall, there was a slight increase in the adjusted R-squared between 2002 and 2016, meaning that high school fixed effects explained a larger share of the variation in student eighth-grade test scores in 2016 than in 2002. Looking at the different subgroups, we see that this “ability” sorting across schools is especially strong among students from the highest-income neighborhoods but has remained relatively stable for that subgroup. Ability sorting is less pronounced among students from the lowest-income neighborhoods, but we do see an increase in sorting on ability between 2002 and 2016.
Entry and exit of students
Keeping students in the district, and attracting additional students to the district, could have important implications for the schools and the city. For example, families remaining in the city rather than relocating to the suburbs may have consequences for the city’s tax base. Expansion of high school options in Chicago should arguably increase the probability that students and their families will find a school that is a good fit within the school district, rather than having to turn to private schools or other public school districts. If this is the case, we would expect to see a larger share of eighth-grade students continuing to enroll in CPS for ninth grade, or equivalently a decline in the share of eighth-grade students who exit CPS between eighth and ninth grade. The increase in the number of high school options may also increase the share of ninth-grade students entering from outside of CPS elementary schools. Table 5 presents statistics on exit and entry percentages from 2002 through 2016.23
Figure 9. 2002 eighth-grade test score distributions by high school

Source: Authors’ calculations based on data from the University of Chicago Consortium on School Research.
Indeed, the percentage of eighth-grade students exiting CPS dropped nearly 6 percentage points from 2002 to 2016. In 2002, nearly one in five CPS eighth-grade students (18 percent) did not enroll in CPS the following year for ninth grade. By 2016, the rate of exit had fallen to 12 percentage points, suggesting that a higher share of eighth-grade students and their families were finding high school options that were good matches for them. CPS has not seen a corresponding increase in the share of students entering CPS at ninth grade. In fact, there was a decline in the entrance rate from nearly 15 percent in 2002 to 12 percent in 2016. That said, the entrance and exit rates are now approximately equal, so that there is no longer a sizable decline in total enrollment between eighth and ninth grade. We think this suggests that, on net, families may be finding CPS high school options more appealing, although we cannot rule out other explanations—such as a decline in the number of private school seats or in families’ ability to relocate to a suburban school district.
Distance traveled
Finally, school choice may be costly in terms of travel time, as it is likely to increase the average distance that students travel to school compared with a system in which all students attend their assigned high school. However, all else being equal, adding more high school options has the potential to reduce the average distance traveled if there are more high schools located near students’ homes. In order to look at this question, we use geocoded information on census block group of residence and school addresses to calculate average distance traveled to school “as the crow flies.”
Figure 10. 2016 eighth-grade test score distributions by high school

Table 4. Percent of variation in standardized incoming test scores explained by high school, overall and by neighborhood income

Source: Authors’ calculations using Chicago Public Schools data available from the University of Chicago Consortium on School Research.
Table 6 presents information on the average distances between home and students’ assigned high schools and between home and the high school they attended for 2002 and 2016. On average, students lived roughly 1.5 miles from their assigned high school in both years. The average distance between where a student lives and where they go to high school, however, was more than double that. In 2016, students traveled an average of 3.7 miles to high school. In the rows below average distance to high school attended, we break down the average distance by the type of school attended. Students choosing to enroll in their assigned high school had the shortest average distance of 1.3 miles, and students attending a selective high school were traveling the farthest, 5.8 miles, which was more than a mile farther than the next-highest average of 4.5 miles for students attending a neighborhood high school other than their assigned high school.
Table 5. Percentages of eighth-grade students exiting CPS and ninth-grade students entering CPS

Source: Authors’ calculations using Chicago Public Schools (CPS) data available from the University of Chicago Consortium on School Research.
Between 2002 and 2016, the distances traveled by students increased from 3.0 to 3.7 miles, primarily due to the increase in the number of students taking up choice. Among students who attended their assigned high school, the distance was roughly 1.3 miles and was unchanged between 2002 and 2016. For students enrolling in a school other than their assigned high school, the average distance traveled in 2016 ranged from 3.9 miles for those attending a charter high school to 5.8 miles for those attending a selective high school. For the citywide and selective high schools, the average distance traveled fell somewhat between 2002 and 2016 as the number of these schools grew. In contrast, the average distance traveled to attend a charter high school increased by 0.4 miles, in spite of the rapid increase in the number of charter high schools across the city. The overall increase in distance to high school was largely driven by the dramatic increase in charter enrollment over this period. Thus, any declines in potential distance to high schools as a result of expanding the number of high school options were outweighed by the fact that more students selected a choice high school.
Discussion and conclusion
High school choice in Chicago has expanded tremendously over the past 15 years, in terms of both the number of schools available to students and the number of students opting for a school other than their assigned neighborhood high school. A major rationale for expanding school choice is to increase competition, which should, in turn, increase the quality of education received by all children, both those opting for charter or private schools and those in the local district-run public schools. We might expect, then, that regardless of what happens to schools in terms of segregation of students by ability or race or how far they travel to school, student achievement across the district should increase. As noted above, the best research on charter school effectiveness is mixed. There is even less evidence on how the competitive pressure of increased choice affects local public schools. While we do not have well-identified studies on the effects of school choice in Chicago to rule out other explanations, it is true that high school student achievement has generally improved over the past 15 years. High school graduation rates have increased, average 11th-grade ACT scores have risen, dropout rates have fallen, and a higher share of CPS high school graduates are enrolling in a four-year college or university immediately after graduation (see Allensworth et al., 2016; and Nagaoka and Healey, 2016). Much has changed over this period, including the adoption of many other district initiatives to improve high schools, so we cannot make causal claims based on the contemporaneous trends in expansion of choice and improved student outcomes. At the same time, increased school choice in Chicago may have contributed in part to the improvement in these outcomes, and this is worthy of further research.
Table 6. Average distance in miles between residential and school census block groups for assigned high schools and high schools attended

Sources: Authors’ calculations using Chicago Public Schools data available from the University of Chicago Consortium on School Research and ArcGIS.
Many opponents of school choice generally argue for limiting school choice and increasing investment in neighborhood high schools. One common concern is that choice schools get the “best” students, leaving neighborhood schools with the responsibility to educate students who are less well prepared, have fewer family resources, or are less academically motivated. Indeed, this is the case with the selective high schools in Chicago because they explicitly admit students based on prior achievement. In addition to being higher achieving on average, selective high school students are also more likely to come from higher-income neighborhoods. Conversely, we provide evidence that charter high schools are attracting some of the most-disadvantaged students in CPS in terms of both eighth-grade achievement and neighborhood income levels. When we examine sorting across high schools regardless of type, we find there is an increase in sorting of students across schools based on prior student achievement, particularly for students living in the poorest neighborhoods in the city. However, simply eliminating choice would likely have the largest impact on students living in the poorest neighborhoods, almost all (86 percent) of whom opt out of their assigned neighborhood high school. In contrast, our attempt to measure the degree to which school choice is related to racial segregation suggests that under the current choice regime, there is little difference in segregation compared with the counterfactual situation in which all students attend their assigned neighborhood high school; and there is little evidence that the expansion in choice over the last 15 years strongly increased racial segregation.
We acknowledge that increased choice does not come without costs to individual families. One of the most direct costs of choice borne by students is the increase in commuting distance to school that accompanies the decision to attend a high school other than one’s assigned high school. But there are other important costs that we do not capture here; for example, the costs in terms of stress and anxiety that students and families incur while navigating the high school application process, including the uncertainty about where one will attend high school. While many applications are completed centrally online, charter schools have separate applications as do some high school programs in regular CPS schools. There is also the additional complication for the district about how to manage its portfolio of schools, some of which are chronically low-performing and face dwindling enrollment.
In Chicago, the management of the district’s portfolio of high schools receives a lot of public attention. The recent contract agreement with the Chicago Teachers Union promised to limit the increase in charter schools over the next four years. At the same time, there is continuing talk of opening new high schools on the South Side and a new selective-enrollment high school somewhere fairly centrally located. The district is also in the midst of a five-year moratorium on closing schools that began in 2013 after it had closed a record 49 elementary schools the previous school year. Given the demand for more high-quality schooling options and the dwindling enrollment in some neighborhood high schools, CPS is likely to be forced to make difficult decisions to close some high school options in order to offer more efficiently sized high schools with comprehensive programs. Of course, this problem is not unique to Chicago, nor indeed to the United States. Fiske and Ladd (2000) describe a similar problem with failing schools in the much more competitive school environment of New Zealand. Schools could not attract enough students but were also not closed down due to concerns about where students would go instead. Although CPS is understandably reluctant to close neighborhood high schools for a number of reasons, the reality is that high schools serving smaller and smaller cohorts of students are costly to run and are increasingly unable to offer a full complement of courses (Lutton, 2014). Thus, CPS will continue to face challenges about what to do with these schools and how to help the students who do attend them to transition to other schools.
Choice is at the forefront of the national dialogue about education policy, and students’ revealed preferences in Chicago suggest that there is significant demand for high schools outside of assigned neighborhood high schools, especially among more-disadvantaged students. Of course, increases in investments at neighborhood high schools and other policy changes could reverse this trend at the local level, but school choice in Chicago and across the country is unlikely to go away in the near future. That said, without a large increase in CPS enrollment at the high school level, the sheer number of public high schools in Chicago is likely to decline over the next several years. A strategic approach to management of the district’s portfolio of high schools is necessary in the current environment.
NOTES
1 Associated Press, 1987, “Schools in Chicago are called the worst by education chief,” New York Times, November 8.
2 We use decennial census and American Community Survey (ACS) data from Ruggles et al. (2015) to calculate private school enrollment statistics.
3 Chicago is not unique in the number of public school options available to families. Providing parents and students with choice when it comes to public schooling is an increasingly popular policy across the nation. For example, Boston’s public school system has no assigned neighborhood schools, so students and their families choose among all high schools. The district assigns students to schools based on proximity and student ranking of schools. More radically, after Hurricane Katrina, the New Orleans public school system eliminated its large central office, and individual schools are now governed by independent organizations such as charter boards.
4 For the purposes of this article, we focus on the choices available to traditional high school students. CPS also includes specialized high schools for students with disabilities for whom placement with general education peers is not appropriate. There are also “second-chance” high schools available for students who have previously dropped out of high school or otherwise need another option to finish.
5 Data on students’ assigned school are missing for the 2006–07 school year.
6 One exception seems to be the four small high schools housed at the Little Village Lawndale Campus. They have neighborhood attendance boundaries, but according to the CPS High School Guide: 2016–2017, even neighborhood students need to submit an application that includes an essay.
7 Prior to 2010–11, admission was in part determined by student race instead of neighborhood socioeconomic status. In response to a court-ordered desegregation consent decree, white students at magnet schools could not comprise more than 35 percent of a given school’s student body.
8 The small net change in the number of neighborhood high schools masks a fair amount of change over this period. For example, four neighborhood high schools were closed entirely (Calumet Career Prep Academy; DuSable; Dyett, which reopened in fall 2016 as Dyett High School for the Arts; and Englewood Technical Prep Academy), while six new neighborhood schools were opened (four as part of the Little Village Lawndale Campus small high schools—Infinity Math, Science and Technology High School, Multicultural Academy of Scholarship High School, Greater Lawndale High School for Social Justice, and World Language High School—plus North-Grand High School to alleviate crowding on the West Side and Solorio Academy High School to alleviate crowding on the Southwest Side). There were also large high schools broken into small high schools that shared a single building and then reconstituted back into one large high school, as well as five citywide high schools for which attendance-area boundaries were established over this period (Chicago Vocational Career Academy, Douglass Academy, Hirsch Metropolitan, Hope College Prep, and Richards Career Academy).
9 Six charter high schools serving ninth-grade students closed over this period, including one that was open in 2002.
10 With the exception of the 2007–08 school year, less than 1 percent of students are missing information on the neighborhood income index.
11 In order to calculate distances, Chicago census block groups were mapped using ArcGIS and a Mercator projection system with meters as the basic distance unit. The coordinates of each block group’s centroid was calculated in meters as were distances between block group centroids. These distances were then converted to miles.
12 The predicted test score comes from a three-level hierarchical linear model, with a measurement model at level 1 taking into account the standard error associated with any single test score, and test scores nested within year (level 2) and students (level 3). The model additionally controls for the student’s age (and square term) at the time of the test, cumulative number of times the student was retained, cumulative number of times the student skipped a grade, the school, and the student’s cohort. The advantages of using predicted eighth-grade scores instead of observed eighth-grade scores are: 1) we have information on students who may be missing scores in eighth grade but have scores from previous years; and 2) a test score measure constructed using multiple test administrations is less subject to noise than a single administration.
13 The percentages are based on students with test score observations. Depending on the year, between 10 and 17 percent of students are missing test scores.
14 As noted above, we do not consider high school students in a variety of nontraditional high school programs such as those for pregnant teens, diverse learners, or second-chance students. This excludes 5.6 percent of first-time grade 9 students between 2002 and 2016 with a declining share over time. In 2002, 8.5 percent of grade 9 students attended one of these alternative programs, whereas only 3.4 percent attended such a program in 2016.
15 In 2002, 71 percent of students in our “other” category report their race/ethnicity as white, 28 percent report Asian or Pacific Islander, and 1 percent report Native American or Alaskan Native. In 2010, the race/ethnicity categories are expanded to include multiracial as an option, so in 2016 60 percent of our other category report being white; 29 percent report Asian, Pacific Islander, or Hawaiian; 8 percent report multiracial; 2 percent report Native American or Alaskan Native; and 1 percent are missing.
16 In order to make the decennial census/ACS data from Ruggles et al. (2015) comparable to CPS data on student race and ethnicity, we define individuals as Latino if they report their ethnicity is Mexican, Cuban, Puerto Rican, or other Hispanic; as African American if they report race is black or African American; and as other if they are neither black/African American nor Hispanic in the census.
17 The average first-time ninth-grade cohort size at selective high schools has also declined, but this is largely driven by the fact that Lane Tech is more than twice the size of the newly opened selective high schools, leading to a decline in average ninth-grade cohort size for selective high schools. For example, if we consider only the seven selective high schools that were open in 2002, the average ninth-grade cohort size has actually increased from 347 to 436.
18 It is possible that there are advantages to being in a small high school. During the 2000s in Chicago and other districts, there was a push to open intentionally small high schools with the goal of providing more personalized attention to students and creating more intimate learning communities. Research on the effects of these small schools is mixed, with the most consistent finding being improved likelihood of graduating from high school (Abdulkadiroğlu, Hu, and Pathak, 2013; Barrow, Schanzenbach, and Claessens, 2015; Bloom and Unterman, 2014; Schwartz, Stiefel, and Wiswall, 2013; and Sporte and de la Torre, 2010). We note, however, that this finding may not apply to schools that are small because of low demand as opposed to schools that are small by design.
19 By choice, we mean specifically a student choosing to attend a school other than their assigned high school. It is certainly the case that families make residential choices and attending an assigned high school is also a choice. For the rest of the article, though, we mean opting out of an assigned high school as observed choice.
20 Of the students living in the poorest neighborhoods, 80 percent are African American.
21 We are using data on cohorts of first-time ninth-graders, so these distributions may differ somewhat from overall high school racial composition to the extent that enrollment, progress, and dropout patterns are correlated with race and are potentially changing over time.
22 Increasing the number of neighborhood high schools will not affect the index, as long as each high school becomes a number of smaller high schools with identical racial compositions.
23 For ninth-grade entry, we measure entry as a percentage of the previous year’s eighth-grade enrollment. Measuring entry in this way means that the denominator for calculating exit and entry rates is the same, resulting in easier comparison.
REFERENCES
Abdulkadiroğlu, Atila, Joshua D. Angrist, Peter D. Hull, and Parag A. Pathak, 2016, “Charters without lotteries: Testing takeovers in New Orleans and Boston,” American Economic Review, Vol. 106, No. 7, July, pp. 1878–1920.
Abdulkadiroğlu, Atila, Joshua D. Angrist, and Parag Pathak, 2014, “The elite illusion: Achievement effects at Boston and New York exam schools,” Econometrica, Vol. 82, No. 1, January, pp. 137–196.
Abdulkadiroğlu, Atila, Weiwei Hu, and Parag Pathak, 2013, “Small high schools and student achievement: Lottery-based evidence from New York City,” National Bureau of Economic Research, working paper, No. 19576, October.
Allensworth, Elaine M., Kaleen Healey, Julia A. Gwynne, and René Crespin, 2016, High School Graduation Rates through Two Decades of District Change: The Influence of Policies, Data Records, and Demographic Shifts, UChicago Consortium on School Research, research report, June.
Angrist, Joshua D., Susan M. Dynarski, Thomas J. Kane, Parag A. Pathak, and Christopher R. Walters, 2012, “Who benefits from KIPP?,” Journal of Policy Analysis and Management, Vol. 31, No. 4, Fall, pp. 837–860.
Associated Press, 1987, “Schools in Chicago are called the worst by education chief,” New York Times, November 8, http://www.nytimes.com/1987/11/08/us/schools-in-chicago-are-called-the-worst-by-education-chief.html, accessed on July 14, 2016.
Barrow, Lisa, 2002, “School choice through relocation: Evidence from the Washington, D.C. area,” Journal of Public Economics, Vol. 86, No. 2, November, pp. 155–189.
Barrow, Lisa, Lauren Sartain, and Marisa de la Torre, 2016, “The role of selective high schools in equalizing educational outcomes: Heterogeneous effects by neighborhood socioeconomic status,” Federal Reserve Bank of Chicago, working paper, No. 2016-17, November.
Barrow, Lisa, Diane Whitmore Schanzenbach, and Amy Claessens, 2015, “The impact of Chicago’s small high school initiative,” Journal of Urban Economics, Vol. 87, May, pp. 100–113.
Bifulco, Robert, and Helen F. Ladd, 2007, “School choice, racial segregation, and test-score gaps: Evidence from North Carolina’s charter school program,” Journal of Policy Analysis and Management, Vol. 26, No. 1, Winter, pp. 31–56.
Black, Sandra E., 1999, “Do better schools matter? Parental valuation of elementary education,” Quarterly Journal of Economics, Vol. 114, No. 2, May, pp. 577–599.
Bloom, Howard S., and Rebecca Unterman, 2014, “Can small high schools of choice improve educational prospects for disadvantaged students?,” Journal of Policy Analysis and Management, Vol. 33, No. 2, Spring, pp. 290–319.
Bogart, William T., and Brian A. Cromwell, 1997, “How much more is a good school district worth?,” National Tax Journal, Vol. 50, No. 2, June, pp. 215–232.
Burgess, Simon, Brendon McConnell, Carol Propper, and Deborah Wilson, 2004, “Sorting and choice in English secondary schools,” University of Bristol, Department of Economics, Centre for Market and Public Organisation, working paper, No. 04/111, October.
Chicago Public Schools, Commission on School Utilization, 2013, “Interim report: Commission on School Utilization,” Chicago, March 6, https://sites.google.com/a/schoolutilization.com/commission-on-school-utilization/Commission-Materials/interim-report, accessed on January 30, 2017.
Chicago Public Schools, Office of Access and Enrollment, 2016, CPS High School Guide: 2016–2017, Chicago, http://www.clissold-school.org/ourpages/auto/2012/10/3/33052335/2016-2017%20High%20School%20Guide_English.pdf, accessed on August 8, 2016.
Clark, Damon, 2010, “Selective schools and academic achievement,” B. E. Journal of Economic Analysis and Policy, Vol. 10, No. 1, February, pp. 1–40.
Dobbie, Will, and Roland G. Fryer, Jr., 2014, “The impact of attending a school with high-achieving peers: Evidence from the New York City exam schools,” American Economic Journal: Applied Economics, Vol. 6, No. 3, July, pp. 58–75.
Dobbie, Will, and Roland G. Fryer, Jr., 2013, “Getting beneath the veil of effective schools: Evidence from New York City,” American Economic Journal: Applied Economics, Vol. 5, No. 4, October, pp. 28–60.
Figlio, David N., and Maurice E. Lucas, 2004, “What’s in a grade? School report cards and the housing market,” American Economic Review, Vol. 94, No. 3, June, pp. 591–604.
Fiske, Edward B., and Helen F. Ladd, 2000, When Schools Compete: A Cautionary Tale, Washington, DC: Brookings Institution Press.
Friedman, Milton, 1962, Capitalism and Freedom, Chicago: University of Chicago Press.
Gibbons, Stephen, Stephen Machin, and Olmo Silva, 2013, “Valuing school quality using boundary discontinuities,” Journal of Urban Economics, Vol. 75, May, pp. 15–28.
Gleason, Philip, Melissa Clark, Christina Clark Tuttle, Emily Dwoyer, and Marsha Silverberg, 2010, The Evaluation of Charter School Impacts: Final Report, U.S. Department of Education, Institute of Education Sciences, National Center for Education Evaluation and Regional Assistance, NCEE 2010-4029, June.
Hoxby, Caroline M., 2000, “Does competition among public schools benefit students and taxpayers?,” American Economic Review, Vol. 90, No. 5, December, pp. 1209–1238.
Hoxby, Caroline, and Sonali Murarka, 2009, “Charter schools in New York City: Who enrolls and how they affect their students’ achievement,” National Bureau of Economic Research, working paper, No. 14852, April.
Hoxby, Caroline M., and Jonah E. Rockoff, 2005, “The impact of charter schools on student achievement,” Harvard University and Columbia Business School, working paper, March, http://www.rand.org/content/dam/rand/www/external/labor/seminars/adp/pdfs/2005hoxby.pdf.
Lutton, Linda, 2014, “At West Side Chicago school, kids go without teachers,” WBEZ, March 11, https://www.wbez.org/shows/wbez-news/at-west-side-chicago-school-kids-go-without-teachers/b7e91690-1255-41c3-9475-1ff422522e9e, accessed on February 21, 2017.
Nagaoka, Jenny, and Kaleen Healey, 2016, “The educational attainment of Chicago Public Schools students: 2015: A focus on four-year college degrees,” UChicago Consortium on School Research, research brief, June.
Reardon, Sean F., and Glenn Firebaugh, 2002, “Measures of multigroup segregation,” Sociological Methodology, Vol. 32, No. 1, August, pp. 33–67.
Ruggles, Steven, Katie Genadek, Ronald Goeken, Josiah Grover, and Matthew Sobek, 2015, Integrated Public Use Microdata Series: Version 6.0, University of Minnesota, machine-readable database, http://doi.org/10.18128/D010.V6.0.
Schwartz, Amy Ellen, Leanna Stiefel, and Matthew Wiswall, 2013, “Do small schools improve performance in large, urban districts? Causal evidence from New York City,” Journal of Urban Economics, Vol. 77, September, pp. 27–40.
Söderström, Martin, and Roope Uusitalo, 2010, “School choice and segregation: Evidence from an admission reform,” Scandinavian Journal of Economics, Vol. 112, No. 1, March, pp. 55–76.
Sporte, Susan, and Marisa de la Torre, 2010, “Chicago High School Redesign Initiative: Schools, students, and outcomes,” University of Chicago, Urban Education Institute, Consortium on Chicago School Research, research report, May.
Theil, Henri, and Anthony J. Finizza, 1971, “A note on the measurement of racial integration of schools by means of informational concepts,” Journal of Mathematical Sociology, Vol. 1, No. 2, pp. 187–193.


