Impact of Student-Based Budgeting in Chicago Public Schools
Over the past 20 years, U.S. school districts have increasingly adopted funding models that aim to allocate money to schools based on individual student need. One such approach—weighted student funding—apportions funds to schools based on a combination of total enrollment and the characteristics of the students they serve. Chicago Public Schools (CPS) adopted such a funding model, known as student-based budgeting (SBB), beginning with the 2013–14 school year.
Prior to the adoption of SBB, staff positions were allocated to CPS schools based on student enrollment projections. Under SBB, however, the district instead uses a per-pupil weighted formula to distribute funds to schools and then allows school principals to decide how to spend this money on staff or other areas (e.g., curriculum, student services, etc.). The weights in this formula depended on students’ grade levels and the percentage of time they spend in a general education classroom (versus receiving special education instruction in a pull-out setting). The goal was in part to give school principals increased flexibility over how to best allocate funds to meet their students’ needs. In a recent working paper, we find that the switch to SBB resulted in greater equity in school funding, with relatively more funds being directed toward schools serving higher shares of low-income students (as measured by the percentage of students eligible for free or reduced-price lunch).
After full implementation of student-based budgeting, per-pupil expenditures at schools serving higher shares of students from low-income families exceeds per-pupil expenditures at schools serving relatively higher income students by more than $1,000.
In our analysis, we divide elementary schools into five bins based on the percentage of students in the school who were eligible for free or reduced-price lunch (FRL). Bin 1 includes schools where less than 20% of students are FRL-eligible, while bin 5 includes schools where more than 80% of students are FRL-eligible (most CPS elementary schools are in bin 5).
Figure 1 plots average inflation-adjusted per-pupil expenditures at the school level over our sample period for schools in bin 1 (dark blue solid line with circles) versus bin 5 (light blue dashed line with diamonds).1 As shown in figure 1, during the pre-SBB and transition periods, inflation-adjusted expenditures per pupil were relatively similar for schools in these two groups. After the transition period, however, average inflation-adjusted expenditures per pupil diverged across these two groups of schools. This divergence was caused by both decreases in per-pupil expenditures in the lowest eligibility bin (bin 1) and increases in the highest bin (bin 5). In the final year of our sample, average per-pupil expenditures in the highest FRL-eligibility bin were nearly $11,000 compared with $8,900 for schools in the lowest FRL-eligibility bin.
1. Per-pupil expenditures over time by school share of students eligible for free or reduced-price school lunch (FRL)
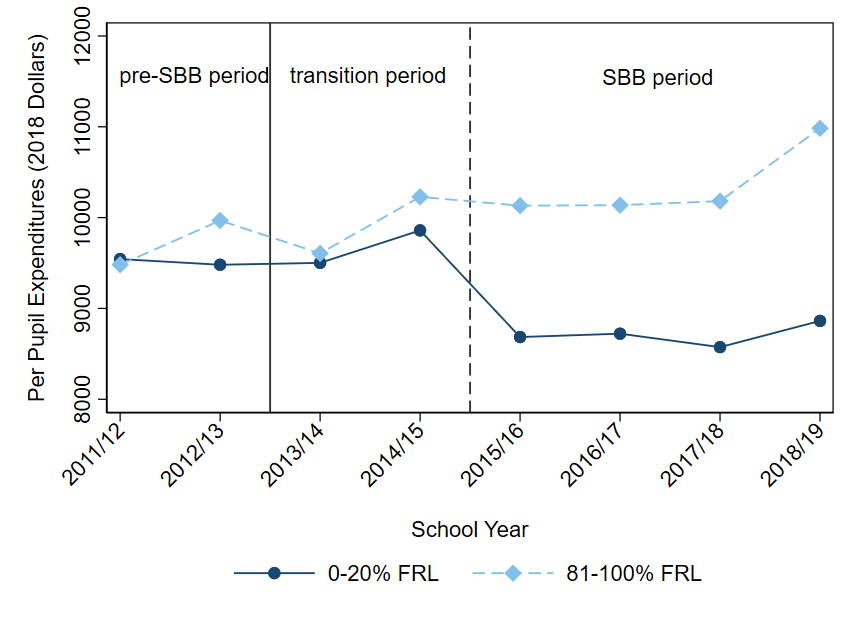
Source: Authors’ calculations based on publicly available CPS budget and demographic data.
The relative rise in per-pupil expenditures at schools with higher numbers of students from families with low incomes was driven by the shift to SBB.
Beginning with the 2013–14 school year, CPS budget data include detailed information on the sources of funds contributing to individual school budgets. Using this detailed data, we can look at the difference in per-pupil expenditures between schools in the highest and lowest FRL-eligibility bins and determine the funding sources that contributed to observed differences. We group funds into five categories: 1) 114 and 115 funds, which are the combined special and regular education funds2; 2) Supplemental General State Aid (SGSA) and federal Title I funds, which are the state and federal dollars for schools that are based on the number and shares of low-income students served; 3) 124 funds (school special income funds), which reflect private foundation grants and donations that schools secure on their own; 4) equity grant funds, which were introduced in the final year of our sample and were directed to schools with low enrollment; and 5) other funds, which include a variety of categories such as Head Start and preschool funding from the state (both of which allocate more money on a per-pupil basis to schools serving more low-income students).3
Figure 2 plots the total difference or “gap” (depicted in black diamonds) in per-pupil expenditures between schools in the highest and lowest FRL-eligibility bins over the 2011–12 through 2018–19 school years. This gap is the difference in the heights of the dark blue and light blue lines depicted in figure 1. Vertical lines demarcate our three periods of study (pre-SBB, transitional, and SBB periods). The solid vertical line represents the onset of SBB funding, and the dashed vertical line marks the end of the transition period. When the gap is zero, average per-pupil expenditures at schools in the highest and lowest FRL-eligibility bins are equal. The vertical bars behind the black diamonds depict how much each of the five funding sources contributes to the gap. The height of the bar for each category illustrates how much it contributes to the overall gap in average per pupil funding between schools in the highest and lowest FRL-eligibility bins. When schools in the highest FRL-eligibility bin receive more dollars per pupil from a particular source than schools in the lowest bin, the bar for that source lies above the zero line. Correspondingly, when schools in the highest FRL-eligibility bin receive fewer dollars per pupil from a source than schools in the lowest bin, the bar for that source lies below the zero line.
2. Average difference in per-pupil expenditures between the highest and lowest FRL-eligibility schools, overall and by source
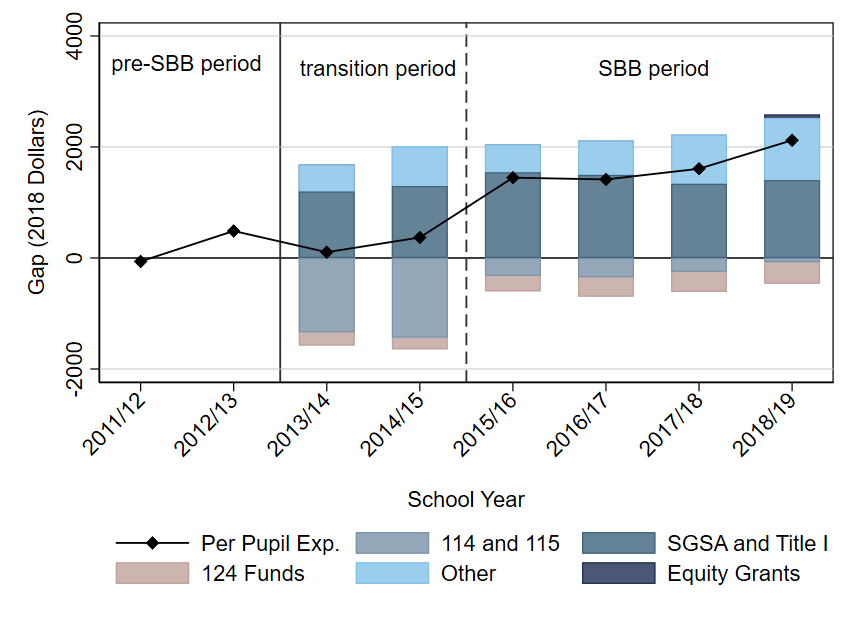
Source: Authors’ calculations based on publicly available CPS budget and demographic data.
The 2011–12 school year was the only year in which the gap in average per-pupil expenditures was negative (although small), with schools in the highest FRL-eligibility bin spending $62 per pupil less than schools in the lowest FRL-eligibility bin. The gap was positive in every subsequent school year, reflecting in part that CPS was successful at directing relatively more funding toward schools with the highest shares of FRL-eligible students, particularly in later school years. The increasingly positive gap between schools serving the highest versus lowest shares of FRL-eligible students occurred despite the fact that the SBB formulas used by CPS do not directly allocate more dollars toward FRL-eligible students (or schools serving higher shares of FRL-eligible students). In other words, the dollars allocated to a school for a grade 3 general education student are the same whether the student is eligible for free or reduced-price lunch or not and whether or not they attend a school with a high or low share of other FRL-eligible students. However, as we show, the switch to the SBB funding formula was effective in equalizing the combined special and regular education funds (114 and 115) across schools serving lower and higher shares of low-income students.
The gap in per-pupil expenditures was relatively small during the SBB transition period, $105 to $369 per pupil, after which the spending gap widened to around $1,500 per pupil. This gap stayed relatively constant through 2017–18 and then widened further again in 2018–19, in part due to equity grants that were awarded to schools with low total enrollment (most of which are in the highest FRL-eligibility bin).
Notably, gaps in per-pupil special and regular education funding (114 and 115) narrowed from around −$1,400 during the SBB transition period to −$350 in 2016–17 and −$77 in 2018–19.4 Once again, we see that the switch to SBB helped equalize regular and special education funding for high- and low-FRL eligible schools. Not surprisingly, Title I funding and supplemental state grants (see figure 2) are fundamental in ensuring that relatively more dollars are allocated to schools serving larger numbers (and higher shares) of FRL-eligible students. Over all years shown, these funds contributed between $1,200 and $1,500 per pupil to the gap in spending between high- and low-FRL eligibility schools.
Offsetting the forces that work toward equalizing or increasing funding for schools in the highest FRL-eligibility bin—adoption of SBB and categorical aid for FRL-eligible students—are the school special income (124) funds. The per-pupil gap in special income funds was −$240 in 2013–14, growing in absolute value terms to −$387 in 2018–19.
How does SBB help equalize funding across schools?
As we noted earlier, SBB funding does not vary with student-level FRL eligibility nor the share of FRL-eligible students served by the school. However, one reason that the SBB system might equalize funding between schools serving high and low shares of FRL-eligible students is if schools differ in terms of how experienced their teachers are—and thus average teacher salary level. Based on national data, schools with less-experienced teachers, on average, tend to serve higher shares of students from low-income families. Thus, while the CPS SBB model for distributing general funds does not explicitly target FRL-eligible students, it could lead to a relative increase in per-pupil funding in schools serving higher shares of FRL-eligible students because less-experienced teachers typically earn less than more-experienced teachers. Under the staff-position-based allocation budgeting system (pre-SBB), differences in teacher experience likely translated into large differences in school-level expenditures on teacher salary (and therefore large differences in per-pupil expenditures). In other words, a principal could end up spending more money in the old regime by attracting more experienced teachers to their school, which was more likely to be the case in higher-income districts.
Although we cannot explicitly observe average experience and salary levels with the available data, we can look at how school-level spending on teacher salaries and benefits changed over school years 2013–14 through 2018–19. As shown in figure 3, the evolution of average inflation-adjusted per-pupil expenditures on salary and benefits by school FRL eligibility closely mirrors what happened to overall per-pupil expenditures (see figure 1). We see some increase for schools serving the highest shares of students from low-income families and decreases for schools with relatively small shares of low-income students.
3. Per-pupil expenditures on salary and benefits by FRL eligibility
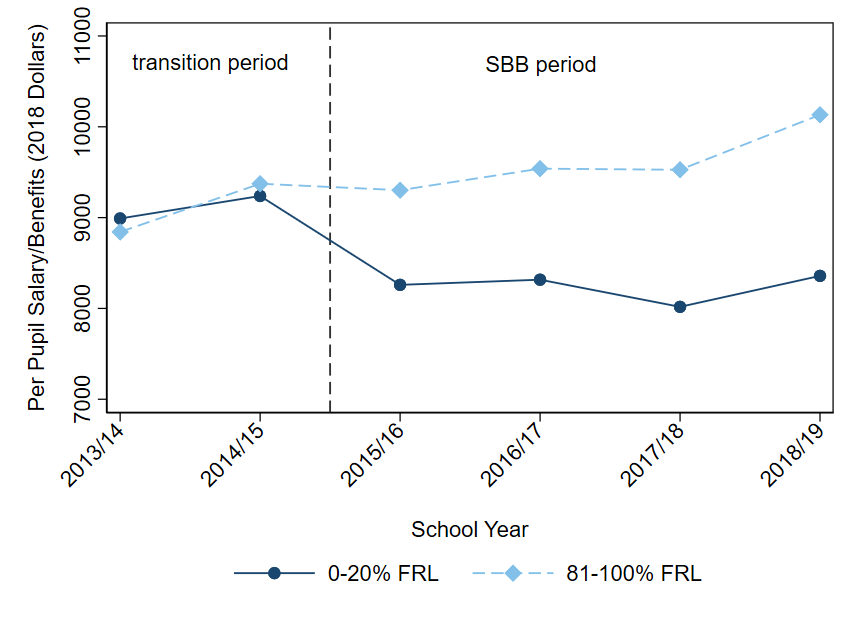
Source: Authors’ calculations based on publicly available CPS budget and demographic data.
Prior to the adoption of SBB, the primary resources under direct control of the principal were Supplemental General State Aid and federal Title I funds, which made up a relatively small share of the overall school budget. SBB increased flexibility for principals by giving them control over a greater share of school-level funding in order to make spending tradeoffs that made the most sense for their individual school. While SBB in no way ensures that schools are receiving adequate levels of funding, our analysis demonstrates that in the Chicago context, SBB distributed dollars more equitably across schools serving higher and lower shares of students whose families are at the low end of the income scale.
Notes
1 We refer to the first two school years (2011–12 and 2012–13) in our study as the “pre-SBB” period. During these two school years, CPS used a school-level budgeting system primarily based on staff allocations. We refer to the 2013–14 and 2014–15 school years as the “transition period” because CPS did not immediately replace the staff position-based system with SBB. For example, if a school’s enrollment in the fall fell short of the enrollment projection from the previous spring, school budgets were not cut (i.e., the school was “held harmless” and funding was not entirely based on the weighted formula). Following these two transitional school years, the SBB system was fully implemented: School-level budgets were determined by the weighted formula and then decisions about how the funds were spent were made by school principals. We refer to school years 2015–16 through the end of our sample as the SBB period.
2 CPS experimented with allocating special education funds through SBB in FY 2017 and FY 2018; as a result we cannot separate 114 and 115 funds in each year.
3 Head Start, school improvement, teacher quality, and IDEA grants. The largest of these are the early childhood education funds (Head Start and state preschool) and the school improvement funds, both of which allocate more funds on a per-pupil basis to schools in the highest FRL-eligibility bin.
4 The regular education funds are substantially larger than the special education funds on a per-pupil basis (including all pupils, not just those receiving special education services). For FY 2019, the total special education ending budget was less than one-third the size of the total regular education fund ending budget (CPS FY 2020 Interactive Budget). However, because CPS experimented with including some special education funding in SBB in school years 2016–17 and 2017–18, we cannot disaggregate the funds separately.


